Level A Head
307
Analysis and Design
of Beams for Bending
5
The beams supporting the multiple overhead cranes system shown in this picture are subjected to transverse loads causing the beams to bend. The normal stresses resulting from such loadings will be determined in this chapter.
C
H
A
P
T
E
R
308
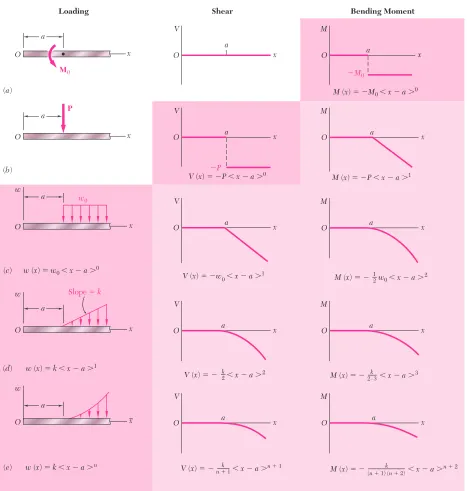
Analysis and Design of Beams for BendingThe transverse loading of a beam may consist of concentrated loads expressed in newtons, pounds, or their multiples, kilonewtons and kips (Fig. 5.2a), of a distributed load w, expressed in N/m, kN/m, lb/ft, or kips/ft (Fig. 5.2b), or of a combination of both. When the load wper unit length has a constant value over part of the beam (as between A and Bin Fig. 5.2b), the load is said to be uniformly distributedover that part of the beam.
Beams are classified according to the way in which they are supported. Several types of beams frequently used are shown in Fig. 5.3. The distance Lshown in the various parts of the figure is called the span. Note that the reactions at the supports of the beams in parts a, b,and cof the figure in-volve a total of only three unknowns and, therefore, can be determined by P1, P2,...,
C B
P 1
(a) Concentrated loads
w
P 2
A D
(b) Distributed load A
B
C
Fig. 5.2
L
(a) Simply supported beam Statically
Determinate Beams
Statically Indeterminate Beams
L2 L1
(d) Continuous beam
L
(b) Overhanging beam
L
Beam fixed at one end and simply supported
at the other end (e)
L
(c) Cantilever beam
L
(f) Fixed beam
Fig. 5.3
Fig. 5.1 5.1. INTRODUCTION
This chapter and most of the next one will be devoted to the analysis and the design of beams,i.e., structural members supporting loads ap-plied at various points along the member. Beams are usually long, straight prismatic members, as shown in the photo on the previous page. Steel and aluminum beams play an important part in both structural and mechanical engineering. Timber beams are widely used in home con-struction (Fig. 5.1). In most cases, the loads are perpendicular to the axis of the beam. Such a transverse loading causes only bending and shear in the beam. When the loads are not at a right angle to the beam, they also produce axial forces in the beam.
the methods of statics. Such beams are said to be statically determinateand will be discussed in this chapter and the next. On the other hand, the re-actions at the supports of the beams in parts d, e,and fof Fig. 5.3 involve more than three unknowns and cannot be determined by the methods of statics alone. The properties of the beams with regard to their resistance to deformations must be taken into consideration. Such beams are said to be statically indeterminateand their analysis will be postponed until Chap. 9, where deformations of beams will be discussed.
Sometimes two or more beams are connected by hinges to form a sin-gle continuous structure. Two examples of beams hinged at a point Hare shown in Fig. 5.4. It will be noted that the reactions at the supports involve four unknowns and cannot be determined from the free-body diagram of the two-beam system. They can be determined, however, by considering the free-body diagram of each beam separately; six unknowns are involved (including two force components at the hinge), and six equations are avail-able.
It was shown in Sec. 4.1 that if we pass a section through a point C of a cantilever beam supporting a concentrated load Pat its end (Fig. 4.6), the internal forces in the section are found to consist of a shear force equal and opposite to the load Pand a bending couple Mof moment equal to the moment of Pabout C. A similar situation prevails for other types of supports and loadings. Consider, for example, a simply supported beam AB carrying two concentrated loads and a uniformly distributed load (Fig. 5.5a). To determine the internal forces in a section through point Cwe first draw the free-body diagram of the entire beam to obtain the reactions at the supports (Fig. 5.5b). Passing a section through C, we then draw the free-body diagram of AC(Fig. 5.5c), from which we determine the shear force Vand the bending couple M.
The bending couple M creates normal stresses in the cross section, while the shear force Vcreates shearing stressesin that section. In most cases the dominant criterion in the design of a beam for strength is the maximum value of the normal stress in the beam. The determination of the normal stresses in a beam will be the subject of this chapter, while shear-ing stresses will be discussed in Chap. 6.
Since the distribution of the normal stresses in a given section depends only upon the value of the bending moment Min that section and the geo-metry of the section,† the elastic flexure formulas derived in Sec. 4.4 can be used to determine the maximum stress, as well as the stress at any given point, in the section. We write‡
(5.1, 5.2)
where I is the moment of inertia of the cross section with respect to a centroidal axis perpendicular to the plane of the couple, y is the dis-tance from the neutral surface, and cis the maximum value of that dis-tance (Fig. 4.13). We also recall from Sec. 4.4 that, introducing the
elas-sm⫽ 0M0c
I sx
⫽ ⫺My I
P¿
5.1. Introduction
309
B H
(a) A
C B
H
(b) A
Fig. 5.4
B C
A w
a
P
1 P2
(a)
B C
C A
w P1
RA RB
P2
(b)
A wa
P1
V M
RA
(c) Fig. 5.5
†It is assumed that the distribution of the normal stresses in a given cross section is not affected by the deformations caused by the shearing stresses. This assumption will be veri-fied in Sec. 6.5.
‡We recall from Sec. 4.2 that Mcan be positive or negative, depending upon whether the concavity of the beam at the point considered faces upward or downward. Thus, in the case considered here of a transverse loading, the sign of Mcan vary along the beam. since, on the other hand,s is a positive quantity, the absolute value of Mis used in Eq. (5.1).
m
310
Analysis and Design of Beams for Bending tic section modulus of the beam, the maximum value of the normal stress in the section can be expressed as(5.3)
The fact that is inversely proportional to S underlines the impor-tance of selecting beams with a large section modulus. Section moduli of various rolled-steel shapes are given in Appendix C, while the sec-tion modulus of a rectangular shape can be expressed, as shown in Sec. 4.4, as
(5.4)
where b and hare, respectively, the width and the depth of the cross section.
Equation (5.3) also shows that, for a beam of uniform cross section, is proportional to Thus, the maximum value of the normal stress in the beam occurs in the section where is largest. It follows that one of the most important parts of the design of a beam for a given loading condition is the determination of the location and magnitude of the largest bending moment.
This task is made easier if a bending-moment diagramis drawn, i.e., if the value of the bending moment M is determined at various points of the beam and plotted against the distance xmeasured from one end of the beam. It is further facilitated if a shear diagramis drawn at the same time by plotting the shear Vagainst x.
The sign convention to be used to record the values of the shear and bending moment will be discussed in Sec. 5.2. The values of Vand Mwill then be obtained at various points of the beam by drawing free-body dia-grams of successive portions of the beam. In Sec. 5.3 relations among load, shear, and bending moment will be derived and used to obtain the shear and bending-moment diagrams. This approach facilitates the determination of the largest absolute value of the bending moment and, thus, the deter-mination of the maximum normal stress in the beam.
In Sec. 5.4 you will learn to design a beam for bending, i.e., so that the maximum normal stress in the beam will not exceed its allowable value. As indicated earlier, this is the dominant criterion in the design of a beam. Another method for the determination of the maximum values of the shear and bending moment, based on expressing Vand Min terms of sin-gularity functions,will be discussed in Sec. 5.5. This approach lends itself well to the use of computers and will be expanded in Chap. 9 to facilitate the determination of the slope and deflection of beams.
Finally, the design of nonprismatic beams,i.e., beams with a variable cross section, will be discussed in Sec. 5.6. By selecting the shape and size of the variable cross section so that its elastic section modulus varies along the length of the beam in the same way as it is possible to design beams for which the maximum normal stress in each section is equal to the allowable stress of the material. Such beams are said to be of constant strength.
0M0,
S⫽I
Ⲑ
c 0M00M0:
sm
S⫽1
6bh 2
sm
sm⫽ 0M0
S
sm S⫽I
Ⲑ
c5.2. SHEAR AND BENDING-MOMENT DIAGRAMS
As indicated in Sec. 5.1, the determination of the maximum absolute values of the shear and of the bending moment in a beam are greatly facilitated if Vand Mare plotted against the distance xmeasured from one end of the beam. Besides, as you will see in Chap. 9, the knowl-edge of Mas a function of xis essential to the determination of the de-flection of a beam.
In the examples and sample problems of this section, the shear and bending-moment diagrams will be obtained by determining the values of Vand Mat selected points of the beam. These values will be found in the usual way, i.e., by passing a section through the point where they are to be determined (Fig. 5.6a) and considering the equilibrium of the portion of beam located on either side of the section (Fig. 5.6b). Since the shear forces Vand have opposite senses, recording the shear at point Cwith an up or down arrow would be meaningless, unless we in-dicated at the same time which of the free bodies ACand CB we are considering. For this reason, the shear Vwill be recorded with a sign: a plus sign if the shearing forces are directed as shown in Fig. 5.6b, and a minus sign otherwise. A similar convention will apply for the bending moment It will be considered as positive if the bending couples are directed as shown in that figure, and negative otherwise.† Summarizing the sign conventions we have presented, we state:
The shear V and the bending moment M at a given point of a beam are said to be positive when the internal forces and couples acting on each portion of the beam are directed as shown in Fig. 5.7a.
These conventions can be more easily remembered if we note that
1. The shear at any given point of a beam is positive when the
externalforces (loads and reactions) acting on the beam tend
to shear off the beam at that point as indicated in Fig. 5.7b.
2. The bending moment at any given point of a beam is positive when the externalforces acting on the beam tend to bend the
beam at that point as indicated in Fig. 5.7c.
It is also of help to note that the situation described in Fig. 5.7, in which the values of the shear and of the bending moment are positive, is precisely the situation that occurs in the left half of a simply sup-ported beam carrying a single concentrated load at its midpoint. This particular case is fully discussed in the next example.
M. V¿
5.2. Shear and Bending-Moment Diagrams
311
B C
A
w
x
P1 P
2
(a)
C
B
C A
w P
1
RA
(b)
V M
P2
RB M'
V'
V M
M' V'
(a) Internal forces
(positive shear and positive bending moment)
(b) Effect of external forces (positive shear)
(c) Effect of external forces (positive bending moment)
†Note that this convention is the same that we used earlier in Sec. 4.2
Fig. 5.6
Fig. 5.7
314
SAMPLE PROBLEM 5.1
For the timber beam and loading shown, draw the shear and bending-moment diagrams and determine the maximum normal stress due to bending.
SOLUTION
Reactions. Considering the entire beam as a free body, we find
Shear and Bending-Moment Diagrams. We first determine the inter-nal forces just to the right of the 20-kN load at A.Considering the stub of beam to the left of section 1 as a free body and assuming Vand Mto be positive (according to the standard convention), we write
We next consider as a free body the portion of beam to the left of section 2 and write
The shear and bending moment at sections 3, 4, 5,and 6are determined in a similar way from the free-body diagrams shown. We obtain
For several of the latter sections, the results may be more easily obtained by considering as a free body the portion of the beam to the right of the section. For example, for the portion of the beam to the right of section 4, we have
We can now plot the six points shown on the shear and bending-moment diagrams. As indicated earlier in this section, the shear is of constant value be-tween concentrated loads, and the bending moment varies linearly; we obtain therefore the shear and bending-moment diagrams shown.
Maximum Normal Stress. It occurs at B, where is largest. We use Eq. (5.4) to determine the section modulus of the beam:
Substituting this value and into Eq. (5.3):
Maximumnormalstressinthebeam⫽60.0MPa 䉳
s m⫽
0MB0
S ⫽
150⫻103N ⴢm2
833.33⫻10⫺6 ⫽60.00⫻10 6
Pa 0M0 ⫽ 0MB0 ⫽50⫻10
3 Nⴢm
S⫽16bh 2
⫽1610.080m2 10.250m2 2
⫽833.33⫻10⫺6 m3 0M0
⫹g©M4⫽0: ⫺M4⫹114kN212m2⫽0 M4⫽ ⫹28kNⴢm ⫹c©Fy⫽0: V4⫺40kN⫹14kN⫽0 V4⫽ ⫹26kN
V6⫽ ⫺14kN M6⫽0
V5⫽ ⫺14kN M5⫽ ⫹28kNⴢm
V4⫽ ⫹26kN M4⫽ ⫹28kNⴢm
V3⫽ ⫹26kN M3⫽ ⫺50kNⴢm
⫹g©M2⫽0: 120kN212.5m2⫹M2⫽0 M2⫽ ⫺50kNⴢm ⫹c©Fy⫽0: ⫺20kN⫺V2⫽0 V2⫽ ⫺20kN
⫹g©M1⫽0: 120kN210m2⫹M1⫽0 M1⫽0
⫹c©Fy⫽0: ⫺20kN⫺V1⫽0 V1⫽ ⫺20kN RB⫽40 kNc RD⫽14 kNc
B
2.5 m 3 m 2 m
250 mm
80 mm C
D A
20 kN 40 kN
B
1 2 3 4 5 6
2.5 m 3 m 2 m
C D A
20 kN
20 kN
2.5 m 3 m 2 m
40 kN 14 kN 46 kN M1 V1 20 kN M2 V2 20 kN 46 kN M3 V3 20 kN 46 kN M4 V4
20 kN 40 kN
46 kN M5 V5 V M x x 20 kN 40 kN
46 kN
14 kN
⫺14 kN
⫺20 kN
⫹26 kN
⫹28 kN · m
⫺50 kN · m 40 kN
M6
M'4 V'4
V6
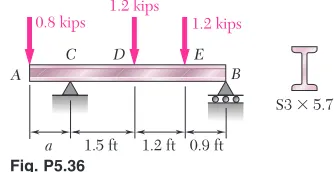
5.36 For the beam and loading shown, determine (a) the distance afor which the maximum absolute value of the bending moment in the beam is as small as possible, (b) the corresponding maximum normal stress due to bend-ing. (See hint of Prob. 5.33).
5.40 A solid steel rod of diameter dis supported as shown. Knowing that for steel determine the smallest diameter dthat can be used if the normal stress due to bending is not to exceed 4 ksi.
g⫽490lb/ft3, Fig. P5.36
Fig. P5.37
Fig.P5.38
Problems
321
B A
a 1.5 ft 1.2 ft 0.9 ft
C D E
1.2 kips
1.2 kips 0.8 kips
S3 ⫻ 5.7
5.37 and 5.38 Draw the shear and bending-moment diagrams for the beam and loading shown and determine the maximum normal stress due to bending.
H A
7 @ 200 mm ⫽ 1400 mm Hinge
30 mm 20 mm
C
B D E F G
300 N 300 N 40 N 300 N
5.39 A solid steel bar has a square cross section of side band is sup-ported as shown. Knowing that for steel determine the di-mension bof the bar for which the maximum normal stress due to bending is (a) 10 MPa, (b) 50 MPa.
r⫽7860kg/m3,
B b
b
A C D
1.2 m 1.2 m 1.2 m
Hinge
8 ft
2 ft
5 ft 5 ft
C B
A E
D
4.8 kips/ft 32 kips
W12 ⫻ 40
B d
A
L⫽ 10 ft
Fig. P5.39 Fig.P5.40
322
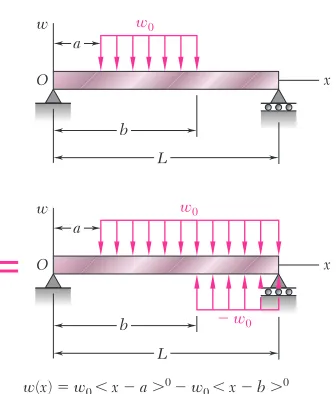
Analysis and Design of Beams for Bending 5.3. RELATIONS AMONG LOAD, SHEAR, AND BENDING MOMENTWhen a beam carries more than two or three concentrated loads, or when it carries distributed loads, the method outlined in Sec. 5.2 for plotting shear and bending moment can prove quite cumbersome. The construction of the shear diagram and, especially, of the bending-moment diagram will be greatly facilitated if certain relations existing among load, shear, and bending moment are taken into consideration. Let us consider a simply supported beam ABcarrying a distributed load wper unit length (Fig. 5.12a), and let Cand be two points of the beam at a distance from each other. The shear and bending mo-ment at C will be denoted by Vand M, respectively, and will be
as-sumed positive; the shear and bending moment at will be denoted
by and
We now detach the portion of beam and draw its free-body
di-agram (Fig. 5.12b). The forces exerted on the free body include a load
of magnitude w and internal forces and couples at Cand Since
shear and bending moment have been assumed positive, the forces and couples will be directed as shown in the figure.
Relations between Load and Shear. Writing that the sum of the ver-tical components of the forces acting on the free body is zero, we have
Dividing both members of the equation by and then letting
ap-proach zero, we obtain
(5.5)
Equation (5.5) indicates that, for a beam loaded as shown in Fig. 5.12a,
the slope of the shear curve is negative; the numerical value of
the slope at any point is equal to the load per unit length at that point. Integrating (5.5) between points Cand D, we write
(5.6)
Note that this result could also have been obtained by considering the equilibrium of the portion of beam CD, since the area under the load curve represents the total load applied between Cand D.
It should be observed that Eq. (5.5) is not valid at a point where a concentrated load is applied; the shear curve is discontinuous at such a point, as seen in Sec. 5.2. Similarly, Eqs. (5.6) and cease to be valid when concentrated loads are applied between Cand D, since they do not take into account the sudden change in shear caused by a
con-centrated load. Equations (5.6) and therefore, should be applied
only between successive concentrated loads.
15.6¿2,
15.6¿2
15.6¿2 VD⫺VC⫽ ⫺1areaunderloadcurvebetween C and D2
VD⫺VC⫽ ⫺
冮
xDxC w dx dVⲐdx
dV dx
⫽ ⫺w
¢x ¢x
¢V⫽ ⫺w¢x V⫺1V⫹ ¢V2⫺w¢x⫽0 ⫹c©F
y⫽0:
CC¿ C¿.
¢x
CC¿ M⫹ ¢M.
V⫹¢V
C¿
¢x C
¿
B A
C w
D
x C'
x
(a)
x
x w x
w
C C'
(b) 1 2
V
M M M
V V
Fig. P5.12
5.3. Relations among Load, Shear,
323
and Bending MomentRelations between Shear and Bending Moment. Returning to the free-body diagram of Fig. 5.12b, and writing now that the sum of the
moments about is zero, we have
Dividing both members of the equation by and then letting
ap-proach zero, we obtain
(5.7)
Equation (5.7) indicates that the slope of the bending-moment
curve is equal to the value of the shear. This is true at any point where the shear has a well-defined value, i.e., at any point where no
concen-trated load is applied. Equation (5.7) also shows that at points
where Mis maximum. This property facilitates the determination of the points where the beam is likely to fail under bending.
Integrating (5.7) between points Cand D, we write
(5.8)
Note that the area under the shear curve should be considered positive where the shear is positive and negative where the shear is negative.
Equations (5.8) and are valid even when concentrated loads are
applied between Cand D, as long as the shear curve has been correctly drawn. The equations cease to be valid, however, if a couple is applied at a point between Cand D, since they do not take into account the sudden change in bending moment caused by a couple (see Sample Prob. 5.6).
15.8¿2
15.8¿2 MD⫺MC⫽areaundershearcurvebetween C and D
MD⫺MC⫽
冮
xDxC V dx
V⫽0 dMⲐdx
dM dx
⫽V
¢x ¢x
¢M⫽V ¢x⫺1
2w1¢x2
2 1M⫹ ¢M2⫺M⫺V ¢x⫹w¢x
¢x
2
⫽0 ⫹g兺M
C¿⫽0: C¿
EXAMPLE 5.03
Draw the shear and bending-moment diagrams for the simply supported beam shown in Fig. 5.13 and determine the maxi-mum value of the bending moment.
From the free-body diagram of the entire beam, we de-termine the magnitude of the reactions at the supports.
Next, we draw the shear diagram. Close to the end Aof the beam, the shear is equal to that is, to as we can check by considering as a free body a very small portion of the beam.
1 2wL, RA,
RA⫽RB⫽
1 2wL
B
w
A
L
B
w
A
R B12wL R
A12wL
Fig. 5.13
324
In most engineering applications, one needs to know the value of the bending moment only at a few specific points. Once the shear dia-gram has been drawn, and after Mhas been determined at one of the ends of the beam, the value of the bending moment can then be ob-tained at any given point by computing the area under the shear curve and using Eq. For instance, since for the beam of Ex-ample 5.03, the maximum value of the bending moment for that beam can be obtained simply by measuring the area of the shaded triangle in the shear diagram of Fig. 5.14a. We have
We note that, in this example, the load curve is a horizontal straight line, the shear curve an oblique straight line, and the bending-moment curve a parabola. If the load curve had been an oblique straight line (first degree), the shear curve would have been a parabola (second de-gree) and the bending-moment curve a cubic (third dede-gree). The shear and bending-moment curves will always be, respectively, one and two degrees higher than the load curve. With this in mind, we should be able to sketch the shear and bending-moment diagrams without actu-ally determining the functions V(x) and M(x), once a few values of the shear and bending moment have been computed. The sketches obtained will be more accurate if we make use of the fact that, at any point where the curves are continuous, the slope of the shear curve is equal to and the slope of the bending-moment curve is equal to V.
⫺w Mmax⫽ 1
2 L
2 wL
2
⫽ wL 2
8 MA⫽0 15.8¿2.
Using Eq. (5.6), we then determine the shear Vat any distance xfrom A; we write
The shear curve is thus an oblique straight line which crosses the xaxis at (Fig. 5.14a). Considering, now, the bend-ing moment, we first observe that The value Mof the bending moment at any distance xfrom Amay then be ob-tained from Eq. (5.8); we have
The bending-moment curve is a parabola. The maximum value of the bending moment occurs when since V(and thus ) is zero for that value of x.Substituting
in the last equation, we obtain Mmax⫽wL2
Ⲑ
8 (Fig. 5.14b). x⫽LⲐ
2 dMⲐ
dxx⫽L
Ⲑ
2, M⫽冮
x
0 w11
2L⫺x2dx⫽ 1
2w1Lx⫺x 2
2 M⫺MA⫽
冮
x
0 Vdx MA⫽0. x⫽L
Ⲑ
2V⫽VA⫺wx⫽ 1
2wL⫺wx⫽w1 1 2L⫺x2 V⫺VA⫽ ⫺
冮
x
0
wdx⫽ ⫺wx
Fig. 5.14
⫺ wL
1 2 wL
1 2
wL2 1 8
L L
1 2 L 1 2
x V
M (a)
(b)
L
325
SAMPLE PROBLEM 5.3
Draw the shear and bending-moment diagrams for the beam and loading shown.
SOLUTION
Reactions. Considering the entire beam as a free body, we write
We also note that at both Aand Ethe bending moment is zero; thus two points (indicated by dots) are obtained on the bending-moment diagram.
Shear Diagram. Since we find that between concentrated
loads and reactions the slope of the shear diagram is zero (i.e., the shear is con-stant). The shear at any point is determined by dividing the beam into two parts and considering either part as a free body. For example, using the portion of beam to the left of section 1, we obtain the shear between Band C:
We also find that the shear is kips just to the right of Dand zero at end E. Since the slope is constant between Dand E, the shear diagram between these two points is a straight line.
Bending-Moment Diagram. We recall that the area under the shear
curve between two points is equal to the change in bending moment between the same two points. For convenience, the area of each portion of the shear di-agram is computed and is indicated in parentheses on the didi-agram. Since the bending moment at the left end is known to be zero, we write
Since is known to be zero, a check of the computations is obtained. Between the concentrated loads and reactions the shear is constant; thus, the slope is constant and the bending-moment diagram is drawn by con-necting the known points with straight lines. Between Dand Ewhere the shear diagram is an oblique straight line, the bending-moment diagram is a parabola.
From the V and M diagrams we note that and 108kipⴢft.
Mmax⫽ Vmax⫽18kips
dM
Ⲑ
dx MEME⫺MD⫽ ⫹48 ME⫽0
MD⫽ ⫺ 48kipⴢft MD⫺MC⫽ ⫺140
MC⫽ ⫹ 92kipⴢft
MC⫺MB⫽ ⫺16
MB⫺MA⫽ ⫹108 MB⫽ ⫹108kipⴢft MA
dV
Ⲑ
dx⫽ ⫺w ⫹12V⫽ ⫺2kips ⫹18kips⫺20kips⫺V⫽0
⫹c 兺F
y⫽0:
dV
Ⲑ
dx⫽ ⫺w,Ax⫽0 Ax⫽0
S⫹
兺Fx⫽0:
Ay⫽18kipsc Ay⫽ ⫹18kips
Ay⫺20kips⫺12kips⫹26kips⫺12kips⫽0
⫹c兺F
y⫽0:
D⫽26kipsc D⫽ ⫹26kips
D124ft2⫺120kips216ft2⫺112kips2114ft2⫺112kips2128ft2⫽0 ⫹g兺M
A⫽0:
E A
B C
6 ft
20 kips 12 kips 1.5 kips/ft
8 ft 10 ft 8 ft
D
E
E A
A Ax
Ay
B C
6 ft
4 ft
20 kips 12 kips
20 kips
20 kips
12 kips
26 kips 18 kips
18 kips
V (kips)
M (kip · ft)
x
x 18
(108)
108
92
48 (48)
(140) 12 (16)
2
14
15 kips/ft 12 kips
8 ft 10 ft 8 ft D
B 1 C D
D
M
V
SAMPLE PROBLEM 5.4
The rolled-steel beam ACis simply supported and carries the uni-formly distributed load shown. Draw the shear and bending-moment diagrams for the beam and determine the location and magnitude of the maximum nor-mal stress due to bending.
W360⫻79 C
B A
20 kN/m
6 m 3 m
C
C B
w
A
V
D B
b a
A
20 kN/m
80 kN
80 kN
(⫹160)
(⫺120) 40 kN
⫺40 kN (⫺40)
6 m
x⫽ 4m
160 kN · m
120 kN · m
x
M
A
x
x
SOLUTION
Reactions. Considering the entire beam as a free body, we find
Shear Diagram. The shear just to the right of Ais Since the change in shear between two points is equal to minusthe area under the load curve between the same two points, we obtain by writing
The slope being constant between Aand B, the shear diagram between these two points is represented by a straight line. Between Band C, the area under the load curve is zero; therefore,
and the shear is constant between Band C.
Bending-Moment Diagram. We note that the bending moment at each end of the beam is zero. In order to determine the maximum bending moment, we locate the section Dof the beam where We write
and, solving for x:
The maximum bending moment occurs at point D, where we have The areas of the various portions of the shear diagram are computed and are given (in parentheses) on the diagram. Since the area of the shear diagram between two points is equal to the change in bending moment between the same two points, we write
The bending-moment diagram consists of an arc of parabola followed by a seg-ment of straight line; the slope of the parabola at Ais equal to the value of V at that point.
Maximum Normal Stress. It occurs at D, where is largest. From Appendix C we find that for a rolled-steel shape,
about a horizontal axis. Substituting this value and into Eq. (5.3), we write
Maximumnormalstressinthebeam⫽125.0MPa 䉳
sm⫽ 0MD0
S ⫽
160⫻103Nⴢm 1280⫻10⫺6m3
⫽125.0⫻106Pa
0MD0 ⫽160⫻103Nⴢm
|M| ⫽
S⫽1280mm3
W360⫻79
0M0
MC⫺MB⫽ ⫺ 120kNⴢm MC⫽0
MB⫺MD⫽ ⫺ 40kNⴢm MB⫽⫹120kNⴢm
MD⫺MA⫽ ⫹ 160kNⴢm MD⫽⫹160kNⴢm
dM
Ⲑdx
⫽V⫽0.x⫽4m 䉳
0⫺80kN⫽ ⫺120kN/m2x VD⫺VA⫽ ⫺wx
V⫽0.
VC⫺VB⫽0 VC⫽VB⫽ ⫺40kN
dVⲐdx⫽ ⫺w
VB⫽ ⫺120⫹VA⫽ ⫺120⫹80⫽ ⫺40kN
VB⫺VA⫽ ⫺120kN/m2 16m2⫽ ⫺120kN
VB
VA⫽ ⫹80kN.
RC⫽40kN c
RA⫽80kN c
326
SAMPLE PROBLEM 5.5
Sketch the shear and bending-moment diagrams for the cantilever beam shown.
SOLUTION
Shear Diagram. At the free end of the beam, we find Between Aand B, the area under the load curve is we find by writing
Between Band C, the beam is not loaded; thus At A, we have and, according to Eq. (5.5), the slope of the shear curve is while at Bthe slope is Between Aand B, the loading decreases linearly, and the shear diagram is parabolic. Between Band C, and the shear diagram is a horizontal line.
Bending-Moment Diagram. The bending moment at the free end of the beam is zero. We compute the area under the shear curve and write
The sketch of the bending-moment diagram is completed by recalling that We find that between Aand Bthe diagram is represented by a cubic curve with zero slope at A, and between Band Cby a straight line. dM
Ⲑdx
⫽V.MC⫽ ⫺ 1
6w0a13L⫺a2
MC⫺MB⫽ ⫺1
2w0a1L⫺a2
MB⫺MA⫽ ⫺1
3w0a2 MB⫽ ⫺ 1 3w0a2
MA
w⫽0,
dVⲐdx⫽0.
dV
Ⲑ
dx⫽ ⫺w0, w⫽w0 VC⫽VB.VB⫺VA⫽ ⫺1
2w0a VB⫽ ⫺ 1 2w0a
VB
1 2w0a;
VA⫽0.
C B
w 0
A
V
M
a
L
⫺ w0a2 1
3 ⫺ w0a(L ⫺ a)
1 2
⫺12w0a
⫺1w0a2 3
⫺16w0a(3L ⫺ a) ⫺ w0a x
x 1 2
SAMPLE PROBLEM 5.6
The simple beam ACis loaded by a couple of moment Tapplied at point B. Draw the shear and bending-moment diagrams of the beam.
SOLUTION
The entire beam is taken as a free body, and we obtain
The shear at any section is constant and equal to Since a couple is ap-plied at B, the bending-moment diagram is discontinuous at B; it is represented by two oblique straight lines and decreases suddenly at Bby an amount equal to T.
TⲐL.
RA⫽ T
Lc RC
⫽T
LT C
B A
V
M
⫺T(1⫺ )
L
x
x
T
a
T L
a L
TLa
PROBLEMS
5.41 Using the method of Sec. 5.3, solve Prob. 5.1.
5.42 Using the method of Sec. 5.3, solve Prob. 5.2.
5.43 Using the method of Sec. 5.3, solve Prob. 5.3.
5.44 Using the method of Sec. 5.3, solve Prob. 5.4.
5.45 Using the method of Sec. 5.3, solve Prob. 5.5.
5.46 Using the method of Sec. 5.3, solve Prob. 5.6.
5.47 Using the method of Sec. 5.3, solve Prob. 5.13.
5.48 Using the method of Sec. 5.3, solve Prob. 5.14.
5.49 Using the method of Sec. 5.3, solve Prob. 5.15.
5.50 Using the method of Sec. 5.3, solve Prob. 5.16.
5.51 and 5.52 Draw the shear and bending-moment diagrams for the beam and loading shown, and determine the maximum absolute value (a) of
the shear, (b) of the bending moment.
5.53 Using the method of Sec. 5.3, solve Prob. 5.21.
5.54 Using the method of Sec. 5.3, solve Prob. 5.22.
5.55 Using the method of Sec. 5.3, solve Prob. 5.23.
5.56 Using the method of Sec. 5.3, solve Prob. 5.24.
328
B
F E
A
D C
240 mm 240 mm 240 mm
60 mm 60 mm
120 N 120 N
300 N 300 N
C
A D
E
F
B
200 mm 75 mm
200 mm 200 mm Fig.P5.52
Fig.P5.51
Problems
329
5.57 and 5.58 Determine (a) the equations of the shear and
bending-moment curves for the given beam and loading, (b) the maximum absolute value of the bending moment in the beam.
B x w
w ⫽ w0
(
l –(
A
L
x L
B x
w w
⫽ w0sin
A
L
x L
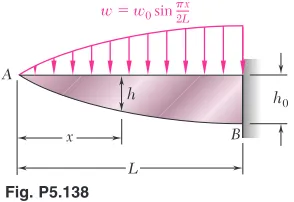
5.59 Determine (a) the equations of the shear and bending-moment curves for the given beam and loading, (b) the maximum absolute value of the bending moment in the beam.
B x w
w ⫽ w0( )1/2
A
L
x / L
x w
w0
– kw0
L
5.60 For the beam and loading shown, determine the equations of the shear and bending-moment curves and the maximum absolute value of the bending moment in the beam, knowing that (a) (b)
5.61 and 5.62 Draw the shear and bending-moment diagrams for the
beam and loading shown and determine the maximum normal stress due to bending.
k⫽0.5. k⫽1,
C
A B
0.9 m 3 m
12 kN/m 9 kN
W200 ⫻ 19.3
A B
16 kN/m
1 m 1.5 m
S150 ⫻ 18.6
Fig. P5.61 Fig. P5.62
Fig. P5.57 Fig. P5.58
Fig.P5.59 Fig.P5.60
5.63 and 5.64 Draw the shear and bending-moment diagrams for the beam and loading shown and determine the maximum normal stress due to bending.
330
Analysis and Design of Beams for Bending5.65and 5.66 Draw the shear and bending-moment diagrams for the beam and loading shown and determine the maximum normal stress due to bending.
C D
A B
6 ft 6 ft
2 ft
2 kips/ft 6 kips
W8 31
5.67 and 5.68 Draw the shear and bending-moment diagrams for the beam and loading shown and determine the maximum normal stress due to bending.
B
C A
8 in. 20 in.
3 in. 800 lb/in.
2 in.12 1 in.14
A
B
4 kN/m
2 kN
C
600 mm 400 mm
S100 11.5
C
A B 10 in.
8 ft 4 ft 3 in.
3 kips/ft
12 kip · ft
Fig. P5.63
C
A B
3 ft 12 ft 8 in.
7 in. 1.2 kips/ft
2.4 kips
Fig.P5.65
B D
C
250 kN 150 kN
A
2 m 2 m 2 m
W410 114
Fig. P5.67
Fig. P5.64
Fig.P5.66
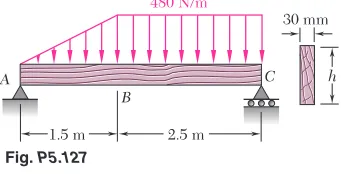
*5.73 Beam AB supports a uniformly distributed load of and two concentrated loads Pand Q. It has been experimentally determined that the normal stress due to bending on the bottom edge of the lower flange of the rolled-steel beam is 100 MPa at D and 70 MPa at E. (a) Draw the shear and bending-moment diagrams for the beam. (b) Determine the max-imum normal stress due to bending that occurs in the beam.
W200⫻52
8kN/m
Problems
331
5.69 Beam AB, of length Land square cross section of side a, is sup-ported by a pivot at Cand loaded as shown. (a) Check that the beam is in equi-librium. (b) Show that the maximum normal stress due to bending occurs at C
and is equal to w
0L 2
/11.5a23.
Fig. P5.69 Fig. P5.70
Fig. P5.72
5.70 Knowing that rod ABis in equilibrium under the loading shown, draw the shear and bending-moment diagrams and determine the maximum normal stress due to bending.
*5.71 Beam AB supports a uniformly distributed load of and two concentrated loads Pand Q. It has been experimentally determined that the normal stress due to bending on the bottom edge of the beam is
at Aand at C. Draw the shear and bending-moment diagrams for the beam and determine the magnitudes of the loads Pand Q.
*5.72 Beam ABsupports a uniformly distributed load of and two concentrated loads Pand Q. It has been experimentally determined that the normal stress due to bending on the bottom edge of the lower flange of the rolled-steel beam is at Dand at E. (a) Draw the shear and bending-moment diagrams for the beam. (b) Determine the max-imum normal stress due to bending that occurs in the beam.
⫹0.776ksi ⫹2.07ksi
W10⫻22
1000lb/ft
⫺29.9MPa
⫺56.9MPa
2kN/m
B a
a A
2 L
3
C
w0
L
3
2 ft 5 ft
3 ft 4 ft
D E A
F B C
1000 lb/ft
W10 22
P Q
B A
1.2 ft 1.2 ft
C
w050 lb/ft
T
w0
3 4in.
Fig. P5.71
C D B A
2 kN/m
P
0.1 m 0.1 m 0.125 m
36 mm 18 mm
Q
Fig.P5.73
B
8 kN/m
A
P Q
C D E F
W200 52
0.3 m 0.3 m
0.45 m 0.45 m 2.4 m
332
Analysis and Design of Beams for Bending *5.74 Beam ABsupports two concentrated loads Pand Q.It has beenexperimentally determined that the normal stress due to bending on the bot-tom edge of the beam is at Cand at E. (a) Draw the shear and bending-moment diagrams for the beam. (b) Determine the maxi-mum normal stress due to bending that occurs in the beam.
⫹22MPa ⫹15MPa
5.4. DESIGN OF PRISMATIC BEAMS FOR BENDING
As indicated in Sec. 5.1, the design of a beam is usually controlled by
the maximum absolute value of the bending moment that will
occur in the beam. The largest normal stress in the beam is found
at the surface of the beam in the critical section where occurs
and can be obtained by substituting for in Eq. (5.1) or Eq.
† We write
A safe design requires that where is the allowable stress
for the material used. Substituting for in and solving for
S yields the minimum allowable value of the section modulus for the
beam being designed:
(5.9)
The design of common types of beams, such as timber beams of rectangular cross section and rolled-steel beams of various cross-sec-tional shapes, will be considered in this section. A proper procedure should lead to the most economical design. This means that, among beams of the same type and the same material, and other things being equal, the beam with the smallest weight per unit length—and, thus, the smallest cross-sectional area—should be selected, since this beam will be the least expensive.
Smin⫽
0M0max
sall
15.3¿2 sm
sall
sall smⱕsall,
15.1¿,5.3¿2
sm⫽
0M0maxc
I sm⫽
0M0max S
15.32.
0M0 0M0max
0M0max sm
0M0max
E C
A B
F D
60 mm
0.3 m 0.4 m 0.5 m 0.5 m
0.2 m
24 mm
P Q
Fig. P5.74
†For beams that are not symmetrical with respect to their neutral surface, the largest of the distances from the neutral surface to the surfaces of the beam should be used for cin Eq. (5.1) and in the computation of the section modulus S ⫽I/c.
The design procedure will include the following steps†:
1. First determine the value of for the material selected from
a table of properties of materials or from design specifications. You can also compute this value by dividing the ultimate
strength of the material by an appropriate factor of safety
(Sec. 1.13). Assuming for the time being that the value of is the same in tension and in compression, proceed as follows.
2. Draw the shear and bending-moment diagrams corresponding
to the specified loading conditions, and determine the
maxi-mum absolute value of the bending moment in the beam.
3. Determine from Eq. (5.9) the minimum allowable value of
the section modulus of the beam.
4. For a timber beam, the depth hof the beam, its width b, or the
ratio characterizing the shape of its cross section will
prob-ably have been specified. The unknown dimensions may then
be selected by recalling from Eq. (4.19) of Sec. 4.4 that band
hmust satisfy the relation
5. For a rolled-steel beam, consult the appropriate table in
Ap-pendix C. Of the available beam sections, consider only those
with a section modulus and select from this group the
section with the smallest weight per unit length. This is the
most economical of the sections for which Note that
this is not necessarily the section with the smallest value of S
(see Example 5.04). In some cases, the selection of a section may be limited by other considerations, such as the allowable depth of the cross section, or the allowable deflection of the beam (cf. Chap. 9).
The foregoing discussion was limited to materials for which is
the same in tension and in compression. If is different in tension
and in compression, you should make sure to select the beam section
in such a way that for both tensile and compressive stresses.
If the cross section is not symmetric about its neutral axis, the largest tensile and the largest compressive stresses will not necessarily occur
in the section where is maximum. One may occur where Mis
max-imum and the other where Mis minimum. Thus, step 2 should include
the determination of both and and step 3 should be
modi-fied to take into account both tensile and compressive stresses. Finally, keep in mind that the design procedure described in this section takes into account only the normal stresses occurring on the sur-face of the beam. Short beams, especially those made of timber, may fail in shear under a transverse loading. The determination of shearing stresses in beams will be discussed in Chap. 6. Also, in the case of rolled-steel beams, normal stresses larger than those considered here may occur at the junction of the web with the flanges. This will be dis-cussed in Chap. 8.
Mmin, Mmax
0M0
sm ⱕsall
sall
sall S ⱖ S
min. S ⱖ S
min 1 6 bh
2⫽ S ⱖ S
min. h
Ⲑ
bSmin
0M0max
sall sU
sall
5.4. Design of Prismatic Beams for Bending
333
†We assume that all beams considered in this chapter are adequately braced to prevent lat-eral buckling, and that bearing plates are provided under concentrated loads applied to rolled-steel beams to prevent local buckling (crippling) of the web.
*Load and Resistance Factor Design. This alternative method of de-sign was briefly described in Sec. 1.13 and applied to members under axial loading. It can readily be applied to the design of beams in bend-ing. Replacing in Eq. (1.26) the loads and respectively, by the bending moments and we write
(5.10)
The coefficients and are referred to as the load factors and the coefficient as the resistance factor. The moments and are the bending moments due, respectively, to the dead and the live loads, while is equal to the product of the ultimate strength of the material and the section modulus Sof the beam:MU⫽SsU.
sU
MU
ML
MD
f
gL
gD
gD MD⫹gLMLⱕfMU
MU,
MD,ML,
PU,
PD,PL, EXAMPLE 5.04
Select a wide-flange beam to support the 15-kip load as shown in Fig. 5.15. The allowable normal stress for the steel used is 24 ksi.
4. Referring to the table of Properties of Rolled-Steel Shapesin Appendix C, we note that the shapes are arranged in groups of the same depth and that in each group they are listed in order of decreasing weight. We choose in each group the lightest beam having a section modulus at least as large as and record the results in the following table.
Shape S, in
81.6 88.9 64.7 62.7 64.7 60.0
The most economical is the shape since it weighs only even though it has a larger section modulus than two of the other shapes. We also note that the total weight of the beam will be This weight is small compared to the 15,000-1b load and can be neglected in our analysis.
18ft2⫻ 140lb2 ⫽320lb. 40lb/ft,
W16⫻40 W10⫻54 W12⫻50 W14⫻43 W16⫻40 W18⫻50 W21⫻44
3
Smin S⫽I
Ⲑ
c15 kips
8 ft
A B
Fig. 5.15
334
1. The allowable normal stress is given:
2. The shear is constant and equal to 15 kips. The bend-ing moment is maximum at B. We have
3. The minimum allowable section modulus is
Smin⫽
0M0max
sall
⫽1440kipⴢin.
24ksi ⫽60.0in 3
335
B A
V
A
Ax Ay
B
C
8 ft 4 ft
3.2 kips
4.5 kips
(⫺18)
(⫹18) 4.50 kips
⫺3.85 kips ⫺0.65
kips
C B
x B
A C h
8 ft 4 ft
3.5 in.
400 lb/ft 4.5 kips
SAMPLE PROBLEM 5.7
A 12-ft-long overhanging timber beam ACwith an 8-ft span ABis
to be designed to support the distributed and concentrated loads shown. Knowing that timber of 4-in. nominal width (3.5-in. actual width) with a 1.75-ksi allowable stress is to be used, determine the
minimum required depth hof the beam.
SOLUTION
Reactions. Considering the entire beam as a free body, we write
Shear Diagram. The shear just to the right of Ais
Since the change in shear between Aand Bis equal to minusthe area under
the load curve between these two points, we obtain by writing
The reaction at Bproduces a sudden increase of 8.35 kips in V, resulting in a
value of the shear equal to 4.50 kips to the right of B. Since no load is applied
between Band C, the shear remains constant between these two points.
Determination of We first observe that the bending moment is
equal to zero at both ends of the beam: Between Aand Bthe
bending moment decreases by an amount equal to the area under the shear
curve, and between Band Cit increases by a corresponding amount. Thus, the
maximum absolute value of the bending moment is
Minimum Allowable Section Modulus. Substituting into Eq. (5.9) the
given value of and the value of that we have found, we write
Minimum Required Depth of Beam. Recalling the formula developed in part 4 of the design procedure described in Sec. 5.4 and substituting the
val-ues of band we have
The minimum required depth of the beam is h⫽14.55in. 䉳
1
6bh2ⱖSmin
1
613.5 in.2h2ⱖ123.43 in3 hⱖ14.546 in.
Smin,
Smin⫽
0M0max
sall ⫽
118 kipⴢft2 112 in./ft2
1.75ksi ⫽123.43in
3
0M0max
s
all
0M0max⫽18.00kipⴢft.
MA⫽MC⫽0.
0M0
max.
VB⫽VA⫺3.20 kips⫽ ⫺0.65 kips⫺3.20 kips⫽ ⫺3.85 kips.
VB⫺VA⫽ ⫺1400 lb/ft2 18 ft2 ⫽ ⫺3200 lb⫽ ⫺3.20 kips VB
VA⫽Ay⫽ ⫺0.65 kips.
A⫽0.65 kips T
Ay⫽ ⫺0.65 kips
⫹c兺Fy⫽0: Ay⫹8.35 kips⫺3.2 kips⫺4.5 kips⫽0
Ax⫽0
⫹S兺Fx⫽0:
B⫽8.35 kips c
B⫽8.35 kips
SAMPLE PROBLEM 5.8
A 5-m-long, simply supported steel beam ADis to carry the distributed and con-centrated loads shown. Knowing that the allowable normal stress for the grade of steel to be used is 160 MPa, select the wide-flange shape that should be used.
SOLUTION
Reactions. Considering the entire beam as a free body, we write
Shear Diagram. The shear just to the right of Ais
Since the change in shear between Aand Bis equal to minusthe area under the load curve between these two points, we have
The shear remains constant between Band C, where it drops to and keeps this value between Cand D. We locate the section Eof the beam where
by writing
Solving for xwe find
Determination of The bending moment is maximum at E, where Since Mis zero at the support A, its maximum value at E is equal to the area under the shear curve between Aand E. We have, therefore,
Minimum Allowable Section Modulus. Substituting into Eq. (5.9) the given value of and the value of that we have found, we write
Selection of Wide-Flange Shape. From Appendix C we compile a list of shapes that have a section modulus larger than and are also the light-est shape in a given depth group.
Shape S,
637 474 549 535 448
We select the lightest shape available, namely W360⫻32.9 䉳 W200⫻46.1
W250⫻44.8 W310⫻38.7 W360⫻32.9 W410⫻38.8
mm3
Smin
Smin⫽ 0M0max
s
all
⫽67.6kNⴢm
160MPa ⫽422.5⫻10
⫺6m3⫽422.5⫻103mm3 0M0max
sall
0M0max⫽ME⫽67.6kNⴢm
V⫽0.
0M0max .
x⫽2.60m.
0⫺52.0kN⫽ ⫺120kN/m2x
VE⫺VA⫽ ⫺wx
V⫽0
⫺58kN,
VB⫽52.0kN⫺60kN⫽ ⫺8kN
⫹52.0kN.
VA⫽Ay⫽
A⫽52.0kNc
Ay⫽52.0kN
⫹c兺F
y⫽0:Ay⫹58.0kN⫺60kN⫺50kN⫽0
Ax⫽0
⫹
S兺Fx⫽0:
D⫽58.0kNc
D⫽58.0kN ⫹g兺M
A⫽0:D15m2 ⫺160kN2 11.5m2 ⫺150kN2 14m2 ⫽0 B
A
C D
3 m
1 m 1 m 20 kN
50 kN
C
B D
1.5 m
52 kN
x 2.6 m
58 kN
8 kN (67.6)
1.5 m
1 m 1 m 50 kN
D A
V
A E B C D x
Ax Ay
60 kN
336
5.75 and 5.76 For the beam and loading shown, design the cross sec-tion of the beam, knowing that the grade of timber used has an allowable nor-mal stress of 12 MPa.
337
PROBLEMS
1.8 kN 3.6 kN
C B
A D h
0.8 m 0.8 m 0.8 m
40 mm
5.77 and 5.78 For the beam and loading shown, design the cross sec-tion of the beam, knowing that the grade of timber used has an allowable nor-mal stress of 1.75 ksi.
1.2 kips/ft 6 ft
a a
B
A
5.79and 5.80 For the beam and loading shown, design the cross
sec-tion of the beam, knowing that the grade of timber used has an allowable nor-mal stress of 12 MPa.
10 kN/m
A B h
5 m
120 mm
Fig. P5.76
A
B 2b b
5 ft 200 lb/ft
Fig. P5.78
C
A B D h
0.6 m 0.6 m
3 m
100 mm 6 kN/m
2.5 kN 2.5 kN
Fig.P5.80
Fig. P5.75
Fig. P5.77
A
B
150 mm
b
3 kN/m
C
2.4 m 1.2 m
Fig.P5.79
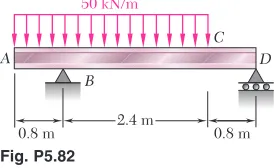
5.81 and 5.82 Knowing that the allowable normal stress for the steel used is 160 MPa, select the most economical metric wide-flange beam to sup-port the loading shown.
338
Analysis and Design of Beams for Bending5.83 and 5.84 Knowing that the allowable normal stress for the steel used is 24 ksi, select the most economical wide-flange beam to support the loading shown.
C D A
B
0.8 m 2.4 m 0.8 m 50 kN/m
Fig. P5.82
5.85 and 5.86 Knowing that the allowable normal stress for the steel used is 160 MPa, select the most economical metric S-shape beam to support the loading shown.
0.5 kip/ft
1.5 kips/ft
18 ft
A
B
Fig. P5.84
5.87and 5.88 Knowing that the allowable normal stress for the steel
used is 24 ksi, select the most economical S-shape beam to support the load-ing shown.
100 kN/m
80 kN
A C
B
0.8 m 1.6 m
Fig. P5.86
48 kips 48 kips 48 kips
A
D E C
B
6 ft
2 ft 2 ft
2 ft
Fig.P5.88
C D
E A
B
0.6 m 0.6 m
0.6 m
1.8 m 90 kN
90 kN 90 kN
Fig. P5.81
2.75 kips/ft 24 kips
B
A C
9 ft 15 ft
Fig. P5.83
40 kN/m 75 kN
A D
C B
0.9 m
3.6 m 1.8 m
Fig. P5.85
3 kips/ft
18 kips
A
D C B
6 ft 6 ft
3 ft
Fig.P5.87
5.89 Two metric rolled-steel channels are to be welded along their edges and used to support the loading shown. Knowing that the allowable normal stress for the steel used is 150 MPa, determine the most economical channels that can be used.
Problems
339
5.90 Two metric rolled-steel channels are to be welded back to back and used to support the loading shown. Knowing that the allowable normal stress for the steel used is 190 MPa, determine the most economical channels that can be used.
5.91 Two rolled-steel angles are bolted together to support the loading shown. Knowing that the allowable normal stress for the steel used is 24 ksi, determine the minimum angle thickness that can be used.
L4⫻3
5.92 A steel pipe of 4-in. diameter is to support the loading shown. Knowing that the stock of pipes available has thicknesses varying from in. to 1 in. in increments, and that the allowable normal stress for the steel used is 24 ksi, determine the minimum wall thickness tthat can be used.
5.93 Assuming the upward reaction of the ground to be uniformly distrib-uted and knowing that the allowable normal stress for the steel used is 170 MPa, select the most economical metric wide-flange beam to support the loading shown.
1 8-in.
1 4
5.94 Assuming the upward reaction of the ground to be uniformly dis-tributed and knowing that the allowable normal stress for the steel used is 24 ksi, select the most economical S-shape beam to support the loading shown.
E B
A
C D
20 kN 20 kN 20 kN
4 @ 0.675 m 2.7 m
B
40 kN/m 75 kN
A
C
D
3.6 m 0.9 m 1.8 m
B
300 lb/ft 2000 lb
A C
3 ft 3 ft
6 in.
4 in.
C A
B
4 ft
4 in.
t
500 lb 500 lb
4 ft
B C
Total load 2 MN
A D D
0.75 m 1 m 0.75 m
B C
240 kips 240 kips
A D D
4 ft
4 ft 4 ft
Fig. P5.89
Fig. P5.90
Fig. P5.91 Fig. P5.92
Fig. P5.93 Fig. P5.94
340
Analysis and Design of Beams for Bending 5.95 and 5.96 Determine the largest permissible value of P for the beam and loading shown, knowing that the allowable normal stress isin tension and ⫺140MPain compression.
⫹80MPa
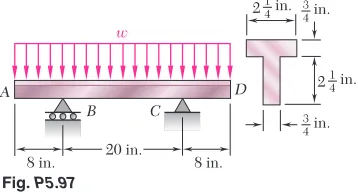
5.97 Determine the largest permissible uniformly distributed load wfor
the beam shown, knowing that the allowable normal stress is in ten-sion and ⫺19.5ksiin compression.
⫹12ksi
5.98 Solve Prob. 5.97, assuming that the cross section of the beam is
reversed, with the flange of the beam resting on the supports at Band C.
5.99 Beams AB,BC, and CDhave the cross section shown and are pin-connected at Band C. Knowing that the allowable normal stress is
in tension and in compression, determine (a) the largest permissi-ble value of wif beam BCis not to be overstressed, (b) the corresponding
max-imum distance afor which the cantilever beams ABand CDare not overstressed.
⫺150MPa
⫹110MPa
5.100 Beams AB, BC,and CDhave the cross section shown and are pin-connected at Band C. Knowing that the allowable normal stress is
in tension and in compression, determine (a) the largest permissi-ble value of Pif beam BCis not to be overstressed, (b) the corresponding max-imum distance afor which the cantilever beams ABand CDare not overstressed.
⫺150MPa
⫹110MPa
B C
A D
0.2 m 0.4 m 0.2 m 96 mm
48 mm 12 mm 12 mm
P P
B
C
A D
0.25 m 0.15 m
0.5 m 12 mm
12 mm 48 mm 96 mm
P P
B C
w
D a 7.2 m
12.5 mm
12.5 mm 150 mm 200 mm
A
a
B C
w
A D
8 in. 20 in. 8 in.
in.
3 4
in.
3 4
in. 214 in. 214
P P
B C D
a
2.4 m 2.4 m 2.4 m
12.5 mm
12.5 mm
150 mm 200 mm
A
a
Fig. P5.95 Fig. P5.96
Fig.P5.97
Fig. P5.99 Fig. P5.100
Problems
341
5.101 Each of the three rolled-steel beams shown (numbered 1, 2, and 3)is to carry a 64-kip load uniformly distributed over the beam. Each of these beams has a 12-ft span and is to be supported by the two 24-ft rolled-steel gird-ers ACand BD. Knowing that the allowable normal stress for the steel used is 24 ksi, select (a) the most economical S shape for the three beams, (b) the most economical W shape for the two girders.
;;;; ;;;;
;;;; ;;;; ;;;; ;;;;
; ; ;
;;;; ;;;; ;;;;
;;;; ;;;; ;;;;
; ; A
C
D
B
4 ft 12 ft
8 ft
8 ft
4 ft 3
1
2
5.102 Solve Prob. 5.101, assuming that the 64-kip distributed loads are replaced by 64-kip concentrated loads applied at the midpoints of the three beams.
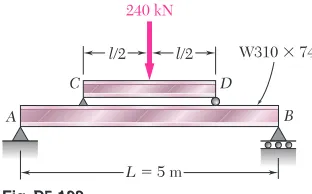
5.103 A 240-kN load is to be supported at the center of the 5-m span shown. Knowing that the allowable normal stress for the steel used is 165 MPa, determine (a) the smallest allowable length lof beam CDif the
beam ABis not to be overstressed, (b) the W shape which should be used for beam CD. Neglect the weight of both beams.
W310⫻74
B A
C D
l/2 l/2
L 5 m
W310 74 240 kN
Fig.P5.103
Fig. P5.101
342
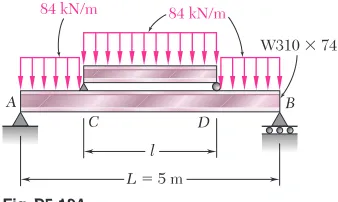
Analysis and Design of Beams for Bending 5.104 A uniformly distributed load of 84 kN/m is to be supported over the 5-m span shown. Knowing that the allowable normal stress for the steel used is 165 MPa, determine (a) the smallest allowable length lof beam CDif the beam AB is not to be overstressed, (b) the W shape which should be used for beam CD. Neglect the weight of both beams.W310⫻74
B A
C D
L 5 m
l
W310 74 84 kN/m 84 kN/m
<