Exurban farmers’ perceptions of land use policy effectiveness:
Implications for the next generation of policy development
Jill K. Clark,a * The Ohio State University
Shoshanah M. Inwood,b University of Vermont
Douglas Jackson-Smith,c Utah State University
Submitted March 6, 2014 / Revised May 20 and May 26, 2014 / Accepted May 27, 2014 / Published online October 16, 2014
Citation: Clark, J. K., Inwood, S. M., & Jackson-Smith, D. (2014). Exurban farmers’ perceptions of land use policy effectiveness: Implications for the next generation of policy development. Journal of Agriculture, Food Systems, and Community Development. Advance online publication.
http://dx.doi.org/10.5304/jafscd.2014.051.001 Copyright © 2014 by New Leaf Associates, Inc.
Abstract
Many local governments have enacted land use policies to address farmland loss and farm viability by protecting large blocks of farmland from residential growth. While the rate of suburban “sprawl” has slowed since the burst of the housing bubble in 2008, these policies remain the dominant approach to agricultural land use policy. Given the importance of exurban agricultural production, the growing diversity of exurban farms, and the
increasing interest in local food systems by the public, it is time to revisit land use policy. Little is known about how farmers perceive land use policy environments, and whether diverse types of farmers have distinctive views on policy
effectiveness. Therefore in this study we document land use policy environments of eight U.S. exurban counties. With farmer survey results we examine factors associated with farmers’ perceptions of policy effectiveness. We find that the overall policy environment and differences in farmer and farm characteristics explain less variation in views of effectiveness than do farmers’ perceptions of local community support, pressure from global markets, intensity of nonfarm development, and overall optimism about the future of agriculture. Farmers who market directly to consumers are particularly pessimistic about land use policies, as these policies were likely not designed with small farms in mind. a * Corresponding author: Jill K. Clark, John Glenn School of
Public Affairs; 1810 College Road; The Ohio State University; Columbus, Ohio 43210 USA; +1-614-688-5984;
b Department of Community Development and Applied
Economics, University of Vermont; [email protected]
cDepartment of Sociology, Social Work and Anthropology,
Results suggest that next-generation policy efforts to encourage the sustainability of exurban farming could be more effective by creating stronger ties between farm and nonfarm populations, adopting flexible policies that recognize the different ways in which farmers adapt to urbanization, and ensuring that the voices of diverse exurban farmers are included in a participatory policy-making process.
Keywords
exurban agriculture, land use policy, farmland preservation, urbanization, farmer perception
Introduction
Exurban areas are critical sites for the development and implementation of land use policy in the United States. Exurbia is often conceptualized as an area of transition between urban and rural, located between suburbs and truly rural areas and within commuting distance of a large, urbanized area (Audirac, 1999). Exurbia is operationalized as being outside of census urbanized areas, but within metropolitan counties (Berube, Singer, Wilson, & Frey, 2006). Research on farmland dynamics has indicated that while reductions in the amount farmland across the United States as a whole only represent only a small portion of total land, rates of land conversion are highest in exurban locations (Heimlich & Anderson, 2001; Oberholtzer, Clancy, & Esseks, 2010). As a result, most attempts to adopt local land use policies to protect agriculture and farmland from development have taken place in exurbia.
Meanwhile, production in metropolitan counties1 contributes disproportionately to overall U.S. mainstream agriculture (nearly 37% of total U.S. farm sales occurred in just 20% of all counties in 2012), and accounts for a major share of the nation’s fruit, vegetable, and horticultural, and dairy sectors (U.S. Department of Agriculture, National Agricultural Statistics Service [USDA, NASS], 2014). This diversity in production reflects farmer
1 The United States Census Bureau defines metropolitan
counties as those with a core urban area population of 50,000 or greater. Counties with high levels of commuting to this core urban area are also considered metropolitan. For more information visit http://www.census.gov/population/metro/
adaptations to the increasing parcelization and cost of land associated with growing competition from urban developers (Bryant & Johnston, 1992). In addition, exurban areas contain large concentra-tions of alternative agricultural activities that take advantage of urban markets. Examples include direct marketing to local consumers and institu-tional food providers, and value-added processing of farm products. The most recent agricultural census data shows that 84% of farms engaged in direct marketing to consumers (and 89% of all such sales) are in metropolitan counties or counties adjacent to a metropolitan area (Martinez et al., 2010). At any point in time in exurban spaces, one can find farms growing historic commodities, farms that are urban-oriented, farms producing higher-value-per-acre products, and any mix of these three in the same farm operation (Inwood & Sharp, 2012).
As a response to exurbanization (commonly referred to as “sprawl”) and the resultant farmland loss, many communities instituted local planning and zoning policies and regulations in the 1990s to manage the impact of urban growth on farmland (Platt, 2004). Important goals of most of these programs were to support and protect existing farm enterprises by preventing nonfarm uses in productive areas, creating a “critical mass” of farmland and thereby favoring large, non–urban oriented farms (Daniels & Bowers, 1997). While the rate of sprawl may be slowing (Nelson, 2013), these policies are still in place. However, little research has been conducted to determine the effectiveness of these policies (Lynch & Musser, 2001). Even less is known about how exurban farmers perceive land use policies, and whether perceptions of local policy effectiveness differ by farm type, such as large, commodity-oriented farms versus smaller, direct sales farms.
the U.S., just prior to the Great Recession of 2008-2012 (Nelson, 2013). Specifically, we examine three research questions: (1) Are farmers’ perceptions of land use policy effectiveness correlated with their objective policy environments? (2) Do farmers’ perceptions of land use policy effectiveness vary by farmer and farm operation characteristics? and, (3) Do farmers’ perceptions of land use policy effectiveness vary given their subjective impres-sions of their broader environment? Effectiveness is measured by indicators of the perceived impacts on farmers’ ability to keep land in farming and be commercially viable, and in general to facilitate entry of new farmers, and to keep residential development out of farming areas. We compare farmers in places with differing local policy con-texts and explore differences in policy perceptions among farmers based on their material situations, the markets with which they are engaged, and their attitudes toward local conditions (other than land use policy).
As we look to develop a next generation of land use policy in exurban areas, having a better understanding of farmer perceptions of policy effectiveness can help shape the development of more responsive land use policy tools and approaches. This is especially true as urban
communities look regionally for food supply as the local food movement increases in popularity.
Evolution of Exurban Land Use Policy In the 1970s, farmland loss to urban uses and concerns about the long-term future of agriculture became a visible and controversial policy topic in the U.S. at both the local and national levels (Furuseth & Pierce, 1982). Aside from growing conflicts with nonfarm neighbors, increasing farmland values associated with urban sprawl made it harder for new farmers to enter into the industry, prevented farmers from expanding their land base, and encouraged farmers to sell land to realize capital gains (Johnston & Smit, 1985). It was during this time that Berry (1978) put forward his thesis on the “impermanence syndrome” suggest-ing that the aforementioned effects of urbanization would lead to a gradual on-farm disinvestment and then an exit from farming overall by farmers in affected areas. In response to these concerns, the
USDA in the early 1980s conducted the National Agriculture Land Study (NALS), which
documented the rapid loss of farmland in urbanizing areas and argued for more restrictive local land use policies as a mechanism to protect farmland and commercial agriculture in the urban shadow (NALS, 1981).
The stated purpose of most farmland
preservation land use policies was to protect farm businesses and local farmland resources by increasing the production value of farming and decreasing the development or consumptive value of farmland, with the goal of eliminating land rent inflation due to speculation (Nelson, 1992). Policies pursued a broad range of goals, including protecting as many acres as possible, preserving the most productive farmland (based on soil quality), protecting a “critical mass” of farmland, and designating areas that would be devoted to farming or food production to protect farmers from conflicts with nonfarm neighbors (Daniels & Bowers, 1997; Furuseth & Pierce, 1982; Lynch & Musser, 2001; Tulloch, Myers, Hasse, Parks, & Lathrop, 2003).
The dominant approach of exurban land use policies in the U.S. has been to rely on the use of planning and zoning restrictions to protect farmland from housing development. Common land use policies included minimum lot size requirements, limitations on commercial businesses in farming zones, urban growth boundaries, delineation of urban service areas, and impact fees on new development (Daniels & Bowers, 1997). Additionally, incentive-based policies were sometimes used to offer incentives to exurban farmers to continue farming. Examples included the establishment of reduced (“use value”) taxation of farmland, designated agricultural districts where farming is protected from nuisance lawsuits, and efforts to raise public funds to purchase
agricultural easements or transfer development rights.
viability of commercial farming operations (Kline & Wichelns, 1996, 1998; Nelson, 1992). Indeed, support for these policies was often pushed more by antidevelopment urbanites than by farmers (Furuseth, 1987).
The focus on protecting open space as a central goal led to policies that were primarily beneficial to larger, land-extensive farms engaged in conventional commodity production. For example, large-lot zoning assumes that farms all require over 40 acres (16 hectares), and agricultural easement program scoring systems often give priority to farms that operate larger acreages and raise conventional crops. Similarly, exclusive agricultural zoning typically excludes value-added processing activities or on-farm sales (Coughlin, 1991). However, recent research on farmers in exurban areas has demonstrated that small and medium-sized operations, and those engaged in direct local marketing of their products, are often more optimistic and successful than larger com-modity farms in exurban areas (Oberholtzer et al., 2010).
More recently, there has been a notable rise in public awareness of how and where food is pro-duced and growing demand for farm products supplied through community, local, and regional food systems (Ives & Kendal, 2013). Growth in the local foods movement has also led to a new form of local policy innovation, particularly the creation of local food policy councils and other organiza-tions designed to stimulate local agricultural and food system activities (Scherb, Palmer, Frattaroli, & Pollack, 2012). These groups have helped organize farmers markets, farm-to-school projects, and the processing and labeling of local farm products.
Many in the planning community suggest that traditional farmland preservation tools can also be used to support these new local food system goals (American Planning Association [APA], 2007). An emerging research literature raises questions about this assumption (Paül & McKenzie, 2013). Recent work by Soma and Wakefield (2011) suggests that focusing on one aspect of food system planning, say farmland preservation, without addressing other aspects of food system planning, such as ensuring adequate farm income or supporting local
markets for farm products, can fail to achieve the desired results. In some cases, traditional land use policy tools can actually create barriers to emerging forms of exurban agriculture. For example, zoning meant to protect farms from nonfarm develop-ment often prevents those same farmers from developing value-added, urban-oriented businesses on their farms to serve new urban markets.
Regardless of the approach, the effectiveness of local land use and food system policies in exur-ban environments hinges on farmers’ awareness and of response to their policy environment (Fischer, 2003). The effectiveness of land use policy can vary depending on how inclusive policy making has been to farmer voices, on the aware-ness and attitudes of farmers toward these policies, and connections between policy perceptions and farmer decisions about making new investments in (or exiting from) the farm sector. Further, Bieirle and Konisky (2000) review literature demonstrating that the perceptions and trust of local governments held by stakeholders contributes to a more success-ful policy process, as well as broader community support. Recent research has demonstrated that well developed local land use policy and the presence of food policy councils is associated with higher levels of social capital between farmers and nonfarmers and more community organizations rallying around these issues (Sharp, Jackson-Smith, & Smith, 2011).
Given the importance of exurban agricultural production to the U.S. agricultural system, the growing diversity of exurban farms, and the increasing interest by the public in local and regional food systems, it is time to revisit the effectiveness of different approaches to exurban land use policy. This research focuses on percep-tions of local land use policy effectiveness among exurban farmers in the U.S.
Methods
Study Site Selection
useful and telling, as 2007 was height of the period when these very policies would be put to the test.
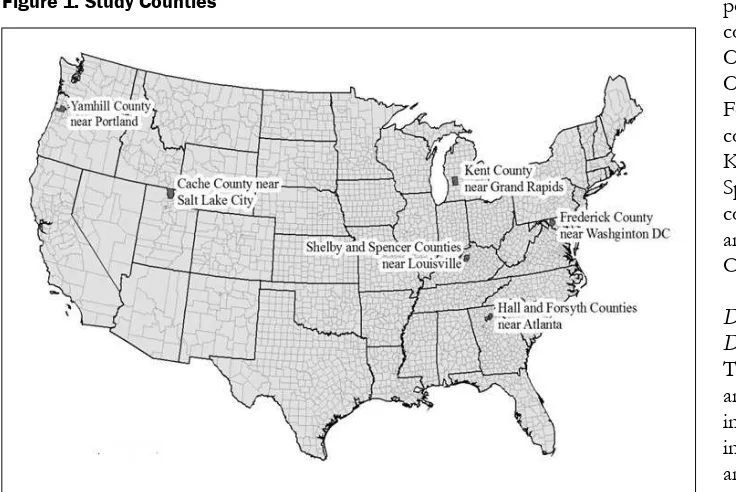
To be considered for our study, each county had to be near a major urban area and experiencing population growth to be deemed exurban. While these counties are not meant to represent all U.S. exurban counties, we did seek to engage in a variety of case study sites by focusing on regional diversity and selecting counties with a variety of historical agricultural commodity mixes (Table 1). In addi-tion, we did not seek to select counties on the basis of having the most advanced land use or farmland preservation policies, but rather a wide variety of
policies. The study counties included Cache County, Utah; Frederick County, Maryland; Forsythe and Hall counties in Georgia; Kent County, Michigan; Spencer and Shelby counties in Kentucky; and Yamhill County, Oregon.
Data Collection and
Description
The data for this analysis were obtained in 2007 from key informant interviews, analyses of local planning and policy documents, and a random-sample mail survey of agricultural landowners in each case-study county. We conducted face-to-face semistructured interviews with purposively sampled key informants in each county during site visits. Informants included local elected officials, city and county planning staff, extension agents, farmers, agribusiness leaders, and local food system organizers.
The mail survey was sent to a random sample of 2,176 owners of agricultural land parcels larger than 10 acres (4 hectares) across the eight study counties. Agricultural landowners were identified
Table 1. Study Counties
County
Population 2010
% Population Growth
2000–2010 Historic Commodity Mix
Farms (2007, year of survey)
Number
Sales (1000s of
$US) Acres
Cache, Utah 113,419 23% Cattle, dairy 1,195 136,064 251,550
Frederick, Maryland 196,563 19% Dairy 676 27,957 98,278
Hall, Georgia 140,993 28% Poultry 799 181,527 57,292
Forsyth, Georgia 115,797 76% Poultry 306 39,972 19,799
Kent, Michigan 576,178 5% Dairy, greenhouse 1,193 194,729 170,117
Shelby, Kentucky 33,574 26% Crop, cattle, tobacco, horses 494 47,412 119,122
Spencer, Kentucky 11,911 44% Cattle, tobacco 596 11,539 73,289
Yamhill, Oregon 85,198 17% Greenhouse, vegetables 2,115 277,561 180,846
Note: 1 acre=0.4 hectare
from county tax assessor rolls. A total of 429 land-owners were disqualified because they returned surveys indicating that they did not own any work-ing agricultural land, leavwork-ing an adjusted sample size of 1,747 landowners. Across the eight study areas we received 856 useable responses for an overall response rate of approximately 49 percent. Survey respondents were asked about basic personal and household demographics and information about their farm operation (if any), including adaptations to urbanization and future business plans. They were asked about their perceptions of their community, such as political and community support for agriculture, land use policy effectiveness, and community cohesion and perceptions of industry pressures. This analysis utilizes only responses from persons indicating that their household was actively engaged in commer-cial farming activities at the time of the survey and for whom we had complete information on all analysis variables (n=448).
Characterizing the Local Policy Environment
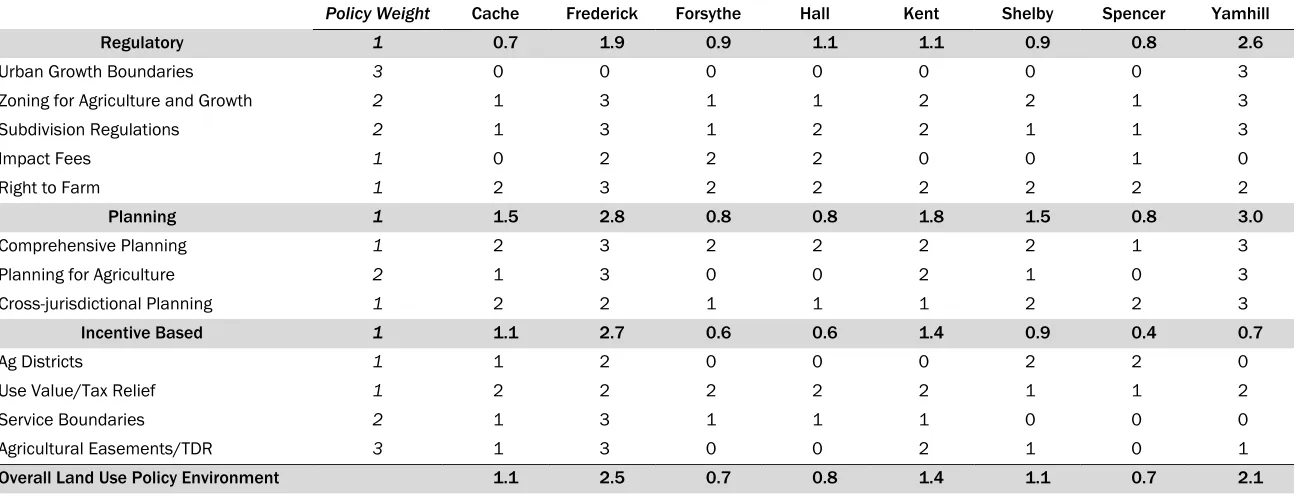
Data from key informant interviews and reviews of written community plans and land use policies were used to characterize the local land use policy environment of each study county. Key compo-nents of a “strong” farmland land use policy environment were derived from the literature (Daniels & Bowers, 1997; Furuseth & Pierce, 1982; Lynch & Musser, 2001). We created measures of the presence and intensity of individual policy types using a 0 to 3 scale in which we assigned a score of 0 if a policy did not exist, and a score of 1 to 3 if the policy was evaluated as relatively weak (1), stronger (2), or strongest (3). Scores reflected the presence of a policy, not indicators for whether the policy was effectively implemented. Policy weights reflecting the relative importance of different, specific policies for effective farmland preservation (again based on the literature) were used to compute three subscales for regulatory, planning, and incentive-based policies (see Table 2). For example, Cache County had weak zoning for agriculture and growth (1 point x 2 weight = 2), weak subdivision regulations (1 point x 2 weight = 2) and stronger right-to-farm legislation (2 pt x 1 weight = 2). The total points for Cache County in
this category are 6. This value is divided by the total weights of the “regulatory” subscale. The resultant value is 6 divided by 9 for a subscale score of 0.7. The same calculation is done for the
“planning” and “incentive-based” subscales. All three subscales are averaged. For Cache County, the average of the subscales of 0.7, 1.5 and 1.1 equals an overall composite land use policy score of 1.1.
Cache County, Utah, is part of the Logan, Utah, Metropolitan area, which is a rapidly growing area located 90 miles (145 km) north of Salt Lake City. It is located in a semi-arid agricultural valley at 4,500 feet (1,372 meter) elevation that is the center of Utah’s dairy industry. In the late 2000s,
community-level land use policies to support agriculture were relatively underdeveloped. While county agricultural zoning placed modest restric-tions on large subdivisions, most agricultural land was zoned for 1-acre lots; up to 5 parcels were allowed to be split off with little formal review. A county comprehensive plan that identified agricul-tural priority areas was passed in 2000, but serves as an advisory document and was not being used actively to guide land use decisions. Utah has a favorable property tax system that provides for reduced “use-value” tax rates on agricultural lands and a strong right-to-farm law, and allows for the designation of agricultural districts where farm uses are protected from nonfarm complaints. There are a few properties protected by agricultural easement in the county, but no local sources of agricultural protection program funding (current easements were paid from state and federal program funds).
Table 2. Policy Environment for Regulatory, Planning, and Incentive-based Policies for the 8 Case-Study Counties
Policy Weight Cache Frederick Forsythe Hall Kent Shelby Spencer Yamhill
Regulatory 1 0.7 1.9 0.9 1.1 1.1 0.9 0.8 2.6
Urban Growth Boundaries 3 0 0 0 0 0 0 0 3
Zoning for Agriculture and Growth 2 1 3 1 1 2 2 1 3
Subdivision Regulations 2 1 3 1 2 2 1 1 3
Impact Fees 1 0 2 2 2 0 0 1 0
Right to Farm 1 2 3 2 2 2 2 2 2
Planning 1 1.5 2.8 0.8 0.8 1.8 1.5 0.8 3.0
Comprehensive Planning 1 2 3 2 2 2 2 1 3
Planning for Agriculture 2 1 3 0 0 2 1 0 3
Cross-jurisdictional Planning 1 2 2 1 1 1 2 2 3
Incentive Based 1 1.1 2.7 0.6 0.6 1.4 0.9 0.4 0.7
Ag Districts 1 1 2 0 0 0 2 2 0
Use Value/Tax Relief 1 2 2 2 2 2 1 1 2
Service Boundaries 2 1 3 1 1 1 0 0 0
Agricultural Easements/TDR 3 1 3 0 0 2 1 0 1
Overall Land Use Policy Environment 1.1 2.5 0.7 0.8 1.4 1.1 0.7 2.1
Note: Non-italicized, non-bold values under each county reflect the presence and intensity score of individual policy types: 0=policy did not exist; 1=relatively weak policy exists; 2=stronger policy exists, 3=strongest policy exists. Italicized “policy weights” rank each policy type within a subscale. Non-italicized bold subscale values are a sum of all individual policy weights*individual county’s presence and intensity score. The “Overall Land Use Policy Environment” = regulatory + planning + incentive-based subscales.
actively funds its own purchase-of-agricultural-easement program designed to bridge the gap between the state easement program and local critical needs, and funds an economic development staff position devoted to agriculturally based economic development projects. In addition to incentive-based programs, Frederick County utilizes several types of agricultural zoning and subdivision regulations designed to manage the division of land. Frederick County’s commitment to land use policy and agricultural economic development initiatives supports a climate of agricultural innovation and persistence. Despite the general pessimism surrounding the dairy sector due to low returns, dairy farmers
are implementing innovative marketing efforts (e.g., taking advantage of new urban clientele) and value-added schemes (e.g., forming co-ops to process under locally grown labels).
categorized as “very low” because Forsyth has weaker subdivision regulations. Neither county identifies farmland as an important component of the future landscape in its planning documents. In the late 1990s and early 2000s, a lively debate took place in Hall County over what impact population growth might have on local agriculture, as a strong anti–population growth coalition took control of county council from 2001 to 2005 and proposed restrictive policies. This group was subsequently voted out of office. The leadership in Forsyth County at the time of this study had no intention of developing or administering policies to protect farmland, and there was no evidence of any group demanding these policies. Until 30 years ago, Forsyth County remained relatively isolated and closed off from adjacent counties. Its rapid popu-lation growth since 1990 has not generated much public debate over farmland preservation.
Kent County in western Michigan surrounds the city of Grand Rapids. Population growth has been relatively slow over the previous decade, in part due to Michigan’s lagging manufacturing economy. Although its dairy sector is in decline, Kent remains one of the top five agricultural counties in the state of Michigan, primarily due to its orchards and nursery/greenhouse sectors. And although the apple market has been depressed by global competition, the “fruit ridge,” a unique microclimate, provides a strong identifier for the region and has served as a key symbol for local farmland protection. Kent County’s policy envir-onment is complex as Michigan counties are sub-divided into townships that have jurisdiction over land use, in addition to individual cities. This sub-division creates over 32 units of government. At the state level, Michigan has modest incentive-based land use policies for farmland protection. At the local level, some townships have pro–farmland protection planning and zoning policies, while others do not. In 2002, the county commissioners passed a purchase-of-agricultural-easement pro-gram; however, at the time of this study it remains unfunded. In the meantime some townships have independently funded their own purchase-of-agricultural-easement programs and have enacted their own transfer-of-development-rights programs (a market-based version of the
purchase-of-agricultural-easement program). Finally, the city of Grand Rapids has an urban service area to guide growth, while a dedicated county Cooperative Extension program has worked to integrate land use policies across rural and urban areas.
Located on the eastern side of the Louisville, Kentucky, metro area, Shelby and Spencer counties have experienced changes in their agricultural sec-tors as their traditional mainstays (tobacco produc-tion and dairy farming) have both declined. Shelby County has become a major player in the Kentucky horse industry and is the recognized world center of Saddlebred horses. Those involved in the horse industry, however, are often viewed as outsiders by traditional commodity farmers. At the state level, Kentucky has some growth management and farmland protection policy frameworks for local governments, but they are not widely utilized. Since the mid-1990s, Kentucky has provided modest support for the purchasing of agricultural ease-ments. Kentucky redistributed tobacco settlement money2 back to farmers through a variety of grant, loan, and investment programs administered at the county level. Shelby County has preserved some farmland through the state program, and at the time of this study was conducting a feasibility analysis for a locally funded easement purchase program. Shelby County government is relatively pro-development, although they do have a plan to protect agriculture and have adopted restrictions on farm subdivisions that have led to the proliferation of large lots with limited access to public sewer services. The Spencer government does not actively plan to protect agricultural land and is skeptical about any regulatory policies that may interfere with private property rights.
Yamhill County is in the southwest corner of the Portland, Oregon, metro area. While experi-encing pressure from relatively rapid population growth, Yamhill agriculture is on a positive growth trajectory, with increases in farm numbers, acres, and sales. The existence of a versatile microclimate
2 In 1998 the four largest tobacco companies in the U.S. made
in the valley has translated into a high incidence of urban- and tourism-oriented farms. Yamhill has among the most robust and intensive land use policy environments among our case study sites. Unlike the focus on incentive-based policies in Frederick County, the growth management and farmland protection policies in Yamhill are prim-arily regulatory. These strong regulatory policies have been developed and imposed by the state of Oregon. Local authorities are involved in their implementation by determining local urban growth boundaries (state policy requires new development to occur only within these areas) and designating other areas as exclusive agricultural zones (where agriculture is the only allowable use of the land). Because of this strong, state-based regulatory approach, incentive-based programs such as purchase of easements are not used to meet farmland preservation goals.
Other Key Variables
For all three of our research questions, our depen-dent variable is an index of farmers’ perceptions of the effectiveness of local land use policies. This index was created by adding together responses to
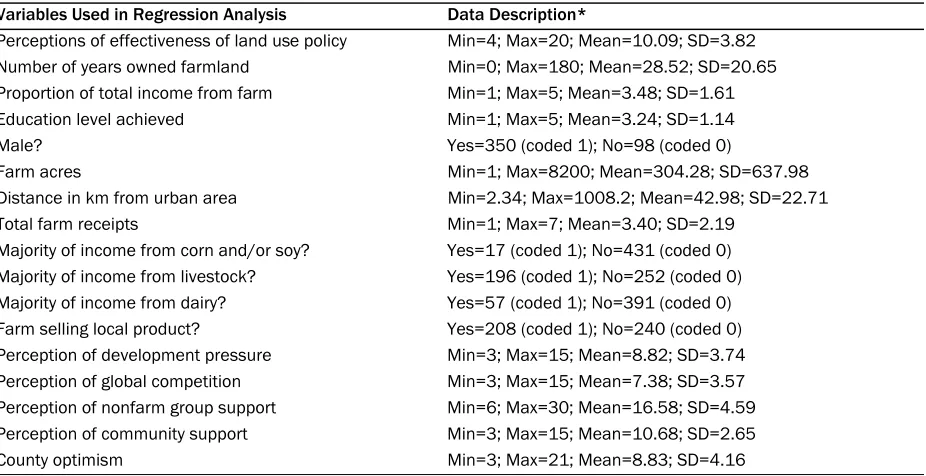
four questions from the farmer survey. The four questions were each measured on a 5-point Likert scale (from “strongly disagree” to “strongly agree”) and asked about the respondent’s agreement with statements about the ability of local land use policy in their area to (a) keep land in the county in farm-ing; (b) maintain the viability of commercial farms in the county; (c) enable new farmers to get started in the county; and (d) keep residential development out of agricultural areas. The four items loaded onto a single factor using exploratory factor anal-ysis and the summed index was internally reliable (Chronbach’s alpha=0.85). To normalize the distribution of responses to this variable we used the cubed root of the summed index. Table 3 includes the descriptive statistics for each of the variables explained below. For dichotomous vari-ables, the table provides the number of survey respondents coded as 1 for “yes” and 0 for “no”; the description of the remainder of variables includes the minimum, maximum, mean and standard deviation.
We captured variation in respondent charac-teristics with indicators of gender, education level, years of farm ownership, and dependence on
Table 3. Descriptive Statistics
Variables Used in Regression Analysis Data Description*
Perceptions of effectiveness of land use policy Min=4; Max=20; Mean=10.09; SD=3.82
Number of years owned farmland Min=0; Max=180; Mean=28.52; SD=20.65
Proportion of total income from farm Min=1; Max=5; Mean=3.48; SD=1.61
Education level achieved Min=1; Max=5; Mean=3.24; SD=1.14
Male? Yes=350 (coded 1); No=98 (coded 0)
Farm acres Min=1; Max=8200; Mean=304.28; SD=637.98
Distance in km from urban area Min=2.34; Max=1008.2; Mean=42.98; SD=22.71
Total farm receipts Min=1; Max=7; Mean=3.40; SD=2.19
Majority of income from corn and/or soy? Yes=17 (coded 1); No=431 (coded 0)
Majority of income from livestock? Yes=196 (coded 1); No=252 (coded 0)
Majority of income from dairy? Yes=57 (coded 1); No=391 (coded 0)
Farm selling local product? Yes=208 (coded 1); No=240 (coded 0)
Perception of development pressure Min=3; Max=15; Mean=8.82; SD=3.74
Perception of global competition Min=3; Max=15; Mean=7.38; SD=3.57
Perception of nonfarm group support Min=6; Max=30; Mean=16.58; SD=4.59
Perception of community support Min=3; Max=15; Mean=10.68; SD=2.65
County optimism Min=3; Max=21; Mean=8.83; SD=4.16
* Dichotomous variables include total number of “Yes” and “No” responses; all other variables include minimum (min), maximum (max), mean, standard deviation (SD).
farming for their household income. Educational attainment was measured using a categorical variable on the survey and was coded 1=some high school; 2=high school diploma or GED; 3=some college; 4=bachelor’s degree; or 5=advanced degree. Dependence on farming was measured using a five point scale: 1=all income is from farm sources; 2=more than half of income is from farm sources; 3=household income is evenly split between farm and off-farm sources; 4=less than half is from the farm, most income is from off-farm sources (wages, salaries, pensions, income from nonfarm businesses, or dividends and interest); 5=very little is from the farm; almost all income is from off-farm sources.
Farm characteristics were measured using indicators of farm size (in acres and sales volume), farm commodity type, distance from urban areas (in kilometers), and the nature of their engagement in local and global markets. For farm receipts, respondents could choose 7 categories: 1=Under US$10,000; 2=US$10,000 to US$24,999;
3=US$25,000 to US$49,999; 4=US$50,000 to US$99,999; 5=US$100,000 to US$249,000; 6=US$250,000 to US$499,999; or 7=US$500,000 and above. Three dummy variables were used to identify whether the majority of the respondent’s farm income was from livestock, dairy, or row crops (coded 0 for “no” and 1 for “yes”). Similarly, respondents were coded “1” if they sold direct to consumers or to local institutions or businesses (e.g., restaurants, schools, grocery stores, hospitals) that marketed the product as “local.” Distance from urban areas was calculated using GIS coverages and geospatial information about the location of the respondent’s agricultural parcel. A logged form of farm size and urban distance is used in the analysis below to adjust for skewness. The extent to which the respondent felt pressure from global competition was measured using an additive index combining answers to three survey questions asking whether the respondent con-sidered the following a problem for her or his farm: increased global competition in the farm sector; mergers among farm input suppliers; and consolidation in the farm processing sector (each question was measured using a five point scale; Cronbach’s alpha=0.92).
Finally, four additive scales were constructed from survey items to capture respondents’
perceptions of the broader farming context in their county. One scale summarized farmers’ percep-tions of development pressure using answers to two items indicating that “cost of farmland” and “new housing development near my farm is a problem.” Lower scores indicated that develop-ment pressures pose less of a problem to the farm business, and higher scores indicated development pressures pose more of a problem to the farm business (Cronbach’s alpha=0.75). An “optimism for the future of agriculture in the county” scale was created using answers to three questions (each measured on a scale of 1 to 7 where 1=very negative/very pessimistic and 7=very positive/very optimistic). The questions asked farmers: (a) Is population growth and development in the county having a positive or negative impact on farming in the county?; (b) Is population growth and develop-ment in the county having a positive or negative impact on the quality of life in the county?; and (c) Are you optimistic or pessimistic about the future of agriculture in the county? Lower scale scores indicate a more pessimistic and negative outlook, and higher scores indicate a more optimistic and positive outlook (Chronbach’s alpha=0.80).
the quality of life in the county; Overall, farmers and nonfarmers in this county get along well, and; In general, the citizens of this county are very sup-portive of farming in the county. Higher scores indicate greater perceived support for farming from the respondent’s community (Chronbach’s alpha=0.80).
Research Approach
We first examine if individual farmers’ perceptions of land use policy effectiveness are correlated with their objective local policy environments across our study communities (Bowler & Ilbery, 1987). Our expectations are that the perception of effective-ness will vary between environments, with percep-tions increasing as the quality of the policy envir-onment increases. We used two methods to address this question. First, we used ANOVA with a post-hoc analysis to examine the relationship between a county’s objective policy environment (Table 2) and the mean value of farmers’ percep-tions of the effectiveness of local land use policy.
Second, to examine this question using behavioral and cultural approaches, we estimated a set of nested regression models to explore the factors associated with individual respondent perceptions of land use policy effectiveness. In the first model, we explore a behavioral approach by adding measures of farm and farmer characteristics that have previously been linked to variation in farmer attitudes and behaviors (Johnston & Bryant, 1987). Specifically, we added independent variables to control for farmer characteristics (number of years farming, how reliant the farm household is on the farm income, gender) and farm character-istics (total farm receipts, what type of production the farm is engaged in, if the farmer is engaged in direct markets, farm acres, distance of farm from nearest urban area).
Research on attitudes toward farmland preser-vation policy often treat farmers as a monolithic stakeholder group (Kerselaers, Rogge, Vanempten, Lauwers, & Van Huylenbroeck, 2013). But given the diversity of farms in exurban areas, we would expect that perceptions of these policies might vary not just between policy environments, but between farmers themselves. In particular, we expect that farmers engaged in sales of local product (direct
sales or intermediated sales) are more urban-oriented, have adapted to development pressure, and thus may not see traditional land use policies as serving their interests. Likewise, those farmers engaged in traditional commodity production and those operating larger acreages are expected to have more positive views toward local land use policy. Finally, we expect “livelihood” farmers (those getting a greater proportion of their income from farming) are more critical of land use policy, as they are concerned more about farm viability than simple open-space or farmland-preservation outcomes.
Finally, building on recent insights in agricul-tural geography (Evans, 2009), we use the second of the nested models to examine the “modified political economic” or cultural model that accounts for the importance of farmers’ worldviews about their community and agriculture (in general). Cultural worldviews can serve as a filter that shape farmers’ positionality in the landscape and percep-tions of policy. Specifically, we add new variables that capture how farmers perceive the importance of global economic forces to their farms’ survival, the level of support for agriculture from their local community, the amount of local housing develop-ment pressure, and their general degree of opti-mism about the future of agriculture. Farms experi-encing greater pressure from global agricultural competition are expected to be more skeptical about the benefits of local land use policies. Those who perceive less community support, more local development pressure, and have a more negative outlook on the future of agriculture are also expected to have lower perceptions of local land use policy effectiveness.
Results and Discussion
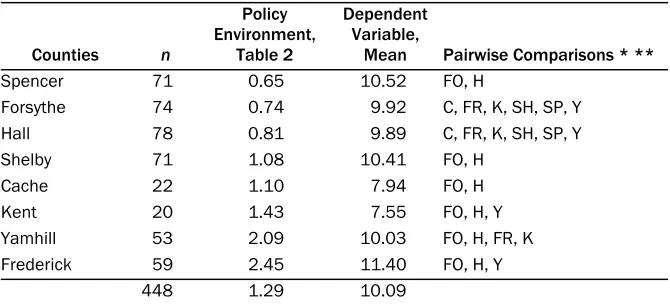
Further, pairwise comparisons conducted using the least significant difference (LSD) test are shown in Table 4. Counties are listed in ascending order according to the strength of their objective land use policy environment. Overall, there is a signifi-cant association between the objective and perceived indicators of land use policy (F-test significant a p<.00). However, the relationships do not appear to have a clear relationship, with
relatively high perceived effectiveness scores found in the lowest, middle, and top-rated land use policy environments. Forsyth and Hall counties were statistically different from all other counties, rank-ing low on both the policy environment rankrank-ing and the mean perceived effectiveness. But per-ceived policy effectiveness scores among the rest of the counties, generally speaking, are not statisti-cally significantly different. The lack of difference with Cache and Kent counties may reflect the impact of smaller sample sizes and a higher degree of variability among respondents within counties compared to differences across counties.
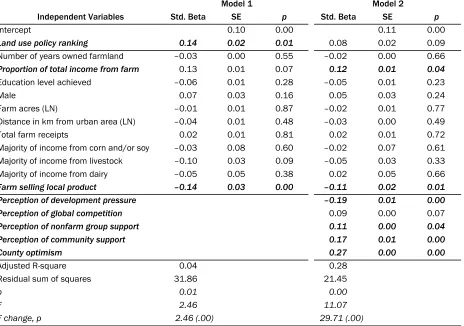
To evaluate whether farmer and farm opera-tion characteristics improve our ability to predict perceptions of land use policy effectiveness, we used ordinary least squares regression to estimate a model including both land use policy scores and measures of respondent characteristics (Model 1 in Table 5). Net of the effects of the other variables in the model, the objective county policy environ-ment variable was positively and significantly related to individual perceived land use policy effectiveness. Most of the socioeconomic and demographic variables were not significant. How-ever, farms that sell products to local markets had a significantly more negative perspective of their local land use policy effectiveness. This finding supports our thesis that farmers who sell to local markets may perceive farmland preservation policies as not geared toward their interests. The
indicator of greater dependence on farm income was weakly and negatively related to perceived effectiveness, meaning that the greater the depen-dence on farm income as a proportion of house-hold income, the lower the perception of land use policy effectiveness. Taken as a whole, this model only explains 4 percent of the variance of the dependent variable. Finally, it is surprising that both size of farm and distance to urban area were not significant in this model.
In Model 2, we introduce variables to capture respondents’ perceptions of global competition, local development pressure, optimism for the future, and support from nonfarm organizations and the broader community. Inclusion of these variables increases the adjusted R2 to 0.28, which is in line with other studies on values and attitudes (Ives & Kendal, 2013; Rauwald & Moore, 2003), meaning that 28 percent of the variation in percep-tions of the effectiveness of land use policy can be explained by Model 2. In addition, Model 2 is a statistically significant improvement over the environmental/behavioral model or Model 1 (F change=29.71; p=0.00). Further, the residual sum of squares is lower for Model 2 than Model 1 (31.9 versus 21.5), suggesting that Model 2 better fits the data. Four of the five perception variables are significant (and the fifth — perception of global competition — is weakly significant) with coeffi-cients that are in the expected direction. Farmers who feel less development pressure, who are Table 4. ANOVA Results (counties listed in ascending order according to objective land use policy environment found in Table 2)
Counties n
Policy Environment,
Table 2
Dependent Variable,
Mean Pairwise Comparisons * **
Spencer 71 0.65 10.52 FO, H
Forsythe 74 0.74 9.92 C, FR, K, SH, SP, Y
Hall 78 0.81 9.89 C, FR, K, SH, SP, Y
Shelby 71 1.08 10.41 FO, H
Cache 22 1.10 7.94 FO, H
Kent 20 1.43 7.55 FO, H, Y
Yamhill 53 2.09 10.03 FO, H, FR, K
Frederick 59 2.45 11.40 FO, H, Y
448 1.29 10.09
F=3.63; p=0.00; * Sign<0.05
optimistic about the future of agriculture in their county, and who perceive higher levels of support from nonfarm groups and the larger community are more likely to think their land use policies are effective. Meanwhile, farms selling local products continue to be significantly more pessimistic about their local land use policies, while farms that rely more on agriculture for their livelihood are more positive. Interestingly, inclusion of the five new perception variables lowers the estimated size and significance of the impact of the objective policy environment. Overall, the modified political econo-mic approach to exploring policy effectiveness explains the most variation in perceived policy differences.
Contrary to our expectations, the distance from a respondent’s farm to the nearest urban area is not significantly related to perceived policy effec-tiveness, but the level of perceived development
pressure is negatively related to policy perceptions. Since development pressure is usually related to urban proximity, this suggests that, overall, percep-tions are more important than absolute location.
The social capital variables of community support and nonfarm group support are both significant and positive, consistent with recent work by Sharp, Jackson-Smith and Smith (2011) demonstrating that places with greater bridging capital between farm and nonfarm groups have richer policy environments and positive farm outcomes.
Finally, general farmer optimism about the future of agriculture in these environments of high urban pressure is the strongest predictor of per-ceived land use policy effectiveness. Oberholtzer et al. (2010) found that exurban farmers who direct marketed were less optimistic compared to those who produced for wholesale markets. Farmers Table 5. Regression Results
Model 1 Model 2
Independent Variables Std. Beta SE p Std. Beta SE p
Intercept 0.10 0.00 0.11 0.00
Land use policy ranking 0.14 0.02 0.01 0.08 0.02 0.09
Number of years owned farmland –0.03 0.00 0.55 –0.02 0.00 0.66
Proportion of total income from farm 0.13 0.01 0.07 0.12 0.01 0.04
Education level achieved –0.06 0.01 0.28 –0.05 0.01 0.23
Male 0.07 0.03 0.16 0.05 0.03 0.24
Farm acres (LN) –0.01 0.01 0.87 –0.02 0.01 0.77
Distance in km from urban area (LN) –0.04 0.01 0.48 –0.03 0.00 0.49
Total farm receipts 0.02 0.01 0.81 0.02 0.01 0.72
Majority of income from corn and/or soy –0.03 0.08 0.60 –0.02 0.07 0.61
Majority of income from livestock –0.10 0.03 0.09 –0.05 0.03 0.33
Majority of income from dairy –0.05 0.05 0.38 0.02 0.05 0.66
Farm selling local product –0.14 0.03 0.00 –0.11 0.02 0.01
Perception of development pressure –0.19 0.01 0.00
Perception of global competition 0.09 0.00 0.07
Perception of nonfarm group support 0.11 0.00 0.04
Perception of community support 0.17 0.01 0.00
County optimism 0.27 0.00 0.00
Adjusted R-square 0.04 0.28
Residual sum of squares 31.86 21.45
p 0.01 0.00
F 2.46 11.07
F change, p 2.46 (.00) 29.71 (.00)
selling through wholesale markets were more satis-fied with access to these markets and slightly more satisfied with the profitability of their markets. In our sample, those not selling local product (n=235) were more positive about local land use policies than farmers who focused on local markets (who are more “adapted” to deal with urban pressure;
n=204).
Conclusion
Recent trends in exurbanization have resulted in a diverse urban agricultural landscape, with a pro-duction combination of commodity, high-value, lifestyle, and local market–oriented, sometimes taking place on the same farm (Inwood & Sharp, 2012). However, housing development in exurban areas has slowed due to the Great Recession, which may translate to slower rates of rural and exurban sprawl in the coming decades. Considering that anti-sprawl–era land use policies generally are still in place, the question becomes, what is the next generation of land use policy?
To inform this question, we addressed a gap in the literature by exploring the factors that are associated with exurban farmers’ perspectives of land use policy effectiveness within six distinct regions of the U.S. We focused on a time period in which land use policy was being tested by exurban-ization, looking for relationships between per-ceived policy effectiveness and the policy environ-ment, farm and farmer characteristics, and farmers’ relationships with their community. While future local land use policy objectives will likely differ from those of the past, our findings translate to policy development conversations of today — namely, that perceptions of effective policy are less about the objective policy environment and char-acteristics of the farmer and more about farmers’ perceptions of community support and general optimism about their businesses’ futures.
We find that indicators of the strength of the local land use policy environment have only a weak relationship to local farmers’ perceptions about policy effectiveness. This is a meaningful finding in that the perception of effectiveness has more to do with the farmers’ relationships with and position in the community and their market orientation than simply the strength of the enacted policy
environ-ment. Some of these differences reflect the fact that urban-oriented farmers who supply local markets have a more negative evaluation of tradi-tional land use policy tools. More important is the finding that farmers’ perceptions of support for agriculture from local nonfarm groups and the broader community are the most consistent drivers of perceived policy effectiveness. These findings imply that the policy instrument itself may not be as important as the policy-making process and how these diverse farmers are engaged in that process, since the effectiveness of local land use policies, in part, hinge on farmers’ awareness and of response to their policy environment (Fischer, 2003).Some of the most pessimistic evaluations of land use policies in these landscapes come from farmers who have already adapted to take advantage of growing urban and local food markets. These farmers are more critical about the impacts or effectiveness of traditional land use policies than conventional commodity farms. In light of the diversity of production in exurban areas, and the awareness of growing interest by the nonfarm public in local food systems, it is clear that conven-tional land use policy tools may be inadequate to serve 21st century exurban communities. The pro-tection of large commodity farms, which require a buffer from nonfarm development, may lead to policies that can make it more difficult for urban-adapted exurban farms to thrive, particularly when they prevent development of on-farm processing and marketing activities. This finding further raises the question about how to better integrate eco-nomic development policies with land use policies, as urban-oriented farms have a different market orientation. We are not suggesting that existing anti-sprawl land use policies should be eliminated. Instead, we are suggesting that we need to recog-nize which farms are not being well served or supported by current policies and should create policy that recognizes the different ways in which farms adapt to urbanization. Moreover, engaging diverse farmers in the policy-development process could result in not only policy instruments that are tailored to the diversity of farmer experiences, but in greater social capital between farmers and their community.
generation” approaches to local land use policies that emphasize development of strong social capi-tal and connect farm and nonfarm communities (such as establishing local food policy councils and new agricultural and food economic development businesses) are critical to improving the outlook and sustainability of exurban farms. It is well with-in the reach of these types of organizations and local governments to create environments within which farmers and farm families feel more sup-ported by nonfarming groups and the community at large, and can see a future for their businesses. In short, it is what has long been called for by Lyson (2000), a more civically engaged agriculture. Local support for farming may lead to greater patronage of locally oriented farm businesses. Given the public’s growing interest in fresh, healthy, local food, future policy development that increases farmer perceptions of local support are likely to boost farmer optimism and confidence in local policy climates. Two possible directions would be to create greater opportunities for rela-tionships between local farms and the broader public or to engage both farm and nonfarm groups in collaborative policy development. In this next-generation approach, it is important to consider the needs of exurban farms that are located on smaller lots, encompass more than just production (such as marketing, processing, etc.), are perhaps more urban-interactive and more tied into urban space, and operate on more expensive land.
But more so, it is critical to consider what voices are included in the process. Integrating farmers into policy discussions is not only about including the generic “farmer” representative, but is an opportunity to include the viewpoints of the diversity of exurban farmers. For example, local farm bureau or commodity groups are typically the first to be involved in local policy deliberations, while farmers who engage in nontraditional local food markets, especially newer farmers from non-farm backgrounds, may not be as well organized and are more difficult to involve in political processes.
Finally, the results presented in the previous section emphasize the need to consider not just supportive land use policies for exurban agriculture, but also economic development and market-based policies
that integrate opportunities for farmers to adapt to urbanization and take advantage of emerging local markets (both direct and wholesale). A recent case study of exurban farmland around Barcelona, Spain, emphasizes the need to couple local food and agricultural market development and land protection to maintain viability (Paül & McKenzie, 2013). So as we debate policy needs of today’s farmers, we need to think more broadly about how we create policies so that they account for com-munity food production goals, the different types of agriculture and farms, and the next types of challenges exurban farms will face. The forum for this deliberation may be in one of the many food policy councils sprouting up in the U.S.
Acknowledgments
Funding for this project was provided by the National Research Initiative of the Cooperative State Research, Education and Extension Service, USDA, grant #2005-35401-15272. The authors thank Jeff Sharp for his expertise and insights regarding this research project. The authors thank the editors and anonymous reviewers for their valuable feedback. Finally, we thank the many farm families, local leaders, and community members who so willingly gave of their time to share their experiences and knowledge.
References
American Planning Association [APA]. (2007, May 11). Policy guide on community and regional food planning. Retrieved from http://www.planning.org/policy/ guides/adopted/food.htm
Audirac, I. (1999). Unsettled views about the fringe: Rural-urban or urban-rural frontiers. In J. F. Owen & M. B. Lapping (Eds.), Contested countryside: The rural urban fringe in North America (pp. 7–32). Brookfield, California: Ashgate.
Beierle, T. C., & Konisky, D. M. (2000). Values, conflict, and trust in participatory environmental planning. Journal of Policy Analysis and Management, 19(4), 587– 602. http://dx.doi.org/10.1002/1520-6688(200023) 19:4<587::AID-PAM4>3.0.CO;2-Q
Berry, D. (1978). Effects of urbanization on agricultural activities. Growth and Change, 9(3), 2–8.
Berube, A., Singer, A., Wilson, J. H., & Frey, W. H. (2006). Finding exurbia: America’s fast-growing communities at the metropolitan fringe. Washington, D.C.: Brookings Institution. Bowler, I. R., & Ilbery, B. W. (1987). Redefining
agricultural geography. Area, 19(4), 327–332. http://www.jstor.org/stable/20002508
Bryant, C. R., & Johnston, T. R. R. (1992). Agriculture in the city’s countryside. Toronto: University of Toronto Press.
Coughlin, R. E. (1991). Formulating and evaluating agricultural zoning programs. Journal of the American Planning Association, 57(2), 183–192.
http://dx.doi.org/10.1080/01944369108975486
Daniels, T., & Bowers, D. (1997). Holding our ground: Protecting America’s farms and farmland. Washington, D.C.: Island Press.
Evans, N. (2009). Adjustment strategies revisited: Agricultural change in the Welsh Marches. Journal of Rural Studies, 25(2), 217–230.
http://dx.doi.org/10.1016/j.jrurstud.2008.10.002 Fischer, F. (2003). Reframing public policy: Discursive politics
and deliberative practices. New York: Oxford University Press.
http://dx.doi.org/10.1093/019924264X.001.0001
Furuseth, O. J. (1987). Public attitudes toward local farmland protection programs. Growth and Change, 18(3), 49–61. http://dx.doi.org/10.1111/j.1468-2257.1987.tb00080.x
Furuseth, O. J., & Pierce, J. T. (1982). A comparative analysis of farmland preservation programmes in North America. The Canadian Geographer, 26(3), 191– 206.
http://dx.doi.org/10.1111/j.1541-0064.1982.tb01448.x
Heimlich, R. E., & Anderson, W. D. (2001). Development at the urban fringe and beyond: Impacts on agriculture and rural land. Washington, D.C.: United States Department of Agriculture, Economic Research Service.
Inwood, S. M., & Sharp, J. S. (2012). Farm persistence and adaptation at the rural-urban interface: Succession and farm adjustment. Journal of Rural Studies, 28(1), 107–117.
http://dx.doi.org/10.1016/j.jrurstud.2011.07.005 Ives, C. D., & Kendal, D. (2013). Values and attitudes of
the urban public towards peri-urban agricultural land. Land Use Policy, 34, 80–90. http://dx.doi.org/ 10.1016/j.landusepol.2013.02.003
Johnston, T. R. R., & Bryant, C. R. (1987). Agricultural adaptation: The prospects for sustaining agriculture near cities. In W. Lockeretz (Ed.), Sustaining agriculture near cities. Ankeny, Iowa: Soil and Water Conservation Society.
Johnston, T., & Smit, B. (1985). An evaluation of the rationale for farmland preservation policy in Ontario. Land Use Policy, 2(3), 225–237.
http://dx.doi.org/10.1016/0264-8377(85)90071-7 Kerselaers, E., Rogge, E., Vanempten, E., Lauwers, L.,
& Van Huylenbroeck, G. (2013). Changing land use in the countryside: Stakeholders’ perception of the ongoing rural planning processes in Flanders. Land Use Policy, 32, 197–206. http://dx.doi.org/10.1016/ j.landusepol.2012.10.016
Kline, J., & Wichelns, D. (1996). Public preferences regarding the goals of farmland preservation programs. Land Economics, 72(4), 538–549. http://dx.doi.org/10.2307/3146914 Kline, J., & Wichelns, D. (1998). Measuring
heterogeneous preferences for preserving farmland and open space. Ecological Economics, 26(2), 211–224. http://dx.doi.org/10.1016/S0921-8009(97)00115-8 Lynch, L., & Musser, W. N. (2001). A relative efficiency
analysis of farmland preservation programs. Land Economics, 77(4), 577–594.
http://dx.doi.org/10.2307/3146942
Lyson, T. A. (2000). Moving toward CIVIC agriculture. Choices: The Magazine of Food, Farm & Resource Issues, 15(3), 42–55.
Martinez, S., Hand, M. S., Da Pra, M., Pollack, S., Ralston, K., Smith, T., . . . Newman, C. (2010). Local Food Systems: Concepts, Impacts, and Issues. Washington, D.C.: United States Department of Agriculture, Economic Research Service. National Agricultural Lands Study [NALS]. (1981).
Executive summary of final report. United States Department of Agriculture and President’s Council on Environmental Quality. Washington, D.C.: U.S. Government Printing Office.
Nelson, A. C. (1992). Preserving prime farmland in the face of urbanization: Lessons from Oregon. Journal of the American Planning Association, 58(4), 467–488.
http://dx.doi.org/10.1080/01944369208975830
Nelson, A. C. (2013). Reshaping metropolitan America: Development trends and opportunities to 2030. Washington, D.C.: Island Press.
Oberholtzer, L., Clancy, K., & Esseks, J. D. (2010). The future of farming on the urban edge: Insights from fifteen U.S. counties about farmland protection and farm viability. Journal of Agriculture, Food Systems and Community Development, 1(2), 59–76.
http://dx.doi.org/10.5304/jafscd.2010.012.003 Paül, V., & McKenzie, F. H. (2013). Peri-urban farm-land conservation and development of alternative food networks: Insights from a case-study area in metropolitan Barcelona (Catalonia, Spain). Land Use Policy, 30(1), 94–105. http://dx.doi.org/10.1016/ j.landusepol.2012.02.009
Platt, R. H. (2004). Land use and society: Geography, law and public policy (Revised Ed.). Washington, D.C.: Island Press.
Rauwald, K. S., & Moore, C. F. (2003). Environmental attitudes as predictors of policy support across three countries. Environment and Behavior, 34(6), 709– 739. http://dx.doi.org/10.1177/001391602237243 Scherb, A., Palmer, A., Frattaroli, S., & Pollack, K.
(2012). Exploring food system policy: A survey of food policy councils in the United States. Journal of Agriculture, Food Systems, and Community Development, 2(4), 3–14.
http://dx.doi.org/10.5304/jafscd.2012.024.007
Sharp, J. S., Jackson-Smith, D., & Smith, L. (2011). Agricultural economic development at the rural-urban interface: Community organization, policy, and agricultural change. Journal of Agriculture, Food Systems, and Community Development, 1(4), 189–204. http://dx.doi.org/10.5304/jafscd.2011.014.002 Soma, T., & Wakefield, S. (2011). The emerging role of
a food system planner: Integrating food
considerations into planning. Journal of Agriculture, Food Systems, and Community Development, 2(1), 53–64. http://dx.doi.org/10.5304/jafscd.2011.021.006 Tulloch, D. L., Myers, J. R., Hasse, J. E., Parks, P. J., &
Lathrop, R. G. (2003). Integrating GIS into farmland preservation policy and decision making. Landscape and Urban Planning, 63(1), 33–48.
http://dx.doi.org/10.1016/S0169-2046(02)00181-0 U.S. Department of Agriculture, National Agricultural