119
FRACTAL MODEL AND CLASSICAL BLOCK MODEL IN ORE
RESERVE ESTIMATION: A COMPARISON
Erik Prasetyo
ABSTRACT The characteristic possessed by many gold deposits is the erratic distribution for gold grade and abnormal distribution (high skewness) which would restrain the application of certain estimation methods especially geostatistics. Another method proposed in order to handle high skewness distribution is fractal model. In this paper one of the models, the number-size model would be compared with block model in estimating ore tonnage and metal (Au-Ag) tonnage for deposit with complex and erratic data distribution. For this purpose, the data obtained from channel sampling program in Ciurug vein, block South 3, level 500 and 600, Pongkor mines would be used as study case. The results show that the number-size fractal model so far could be applied only to the deposits with continuous dimension and grade distribution. For deposits with erratic grade distribution the fractal model has only limited use, which powerful generally to estimate bulk volume or ore tonnage since the dimension i.e. thickness has relatively high continuity.
Keywords: Fractal, number-size model, reserve estimation, Au-Ag, Pongkor
Naskah masuk : 5 Juli 2010
Naskah diterima : 14 Desember 2010
Erik Prasetyo
Indonesian Institue of Sciences – UPT BPML Jl. Ir. Sutami km. 15, Tanjung Bintang, Lampung Selatan
E-Mail: [email protected]
ABSTRAK Karakteristik yang umum dijumpai
pada banyak endapan emas adalah distribusi kadar emas yang eratik dan tidak mengikuti distribusi normal (gaussian) dikarenakan skewness yang tinggi dan pada gilirannya akan membatasi aplikasi beberapa metode estimasi khususnya geostatistik. Salah satu metode yang dapat digunakan untuk menangani populasi data kadar dengan skewness tinggi adalah model fraktal. Di dalam tulisan ini, salah satu model fraktal, number-size model akan diaplikasikan dalam perhitungan cadangan Au-Ag dengan distribusi data kadar yang kompleks dan eratik yang hasilnya akan dibandingkan dengan hasil perhitungan model blok. Dalam tulisan ini, data-datayangdiperolehdariprogram pemercontohan dengan metode alur di Urat Ciurug, Blok Selatan 3, Level 500 dan 600, Tambang Pongkor dipergunakan sebagai studi kasus. Hasilnya menunjukkan bahwa number-size model dari metode fraktal sejauh ini hanya dapat di- aplikasikan untuk deposit dengan distribusi kadar dan dimensi yang kontinu. Untuk endapan dengan distribusi kadar yang eratik model ini terbatas penggunaannya, dan dalam kasus ini terbatas hanya pada estimasi volum ruah atau tonase bijih dikarenakan perhitungannya di- dasarkan pada distribusi data ketebalan yang cenderung kontinu.
Kata kunci: Fraktal, number-size model, estimasi cadangan, Au-Ag, Pongkor.
INTRODUCTION
120
gold deposits is the presence of coarse gold grains which were randomly distributed (Dominy, 2000). This characteristic caused the erratic distribution for gold grade and abnormal distribution (high skewness). The distribution with high skewness would restrain the application of certain estimation methods especially geostatistics since this method is based on normal distribution (Wellmer, 1998). The common method such as log transformation has only limited use and could not cope with extreme skewness of such grade distribution.
The other classic methods in estimation beside geostatistics including inverse distance (ID) use linear interpolation to estimate the grade value in certain coordinate based on surrounding grade data. ID calculates the value using power which varied according to the erraticness of the data distribution. Usually the power used in calculation is two (inverse distance square), and for extremely erratic data, the power become infinite, and the estimation method is then called nearest neighbor point (NNP). In this extreme case, the grade parameter is considered as random variable.
Another method proposed in order to handle high skewness distribution is fractal model. The model so far is said to have been successfully dealing with many geological phenomena including grade and thickness distribution with relatively high continuity (Wang et. al., 2009). However, in this paper, the number-size fractal model as proposed by Mandelbrot (1983) and Wang et. al. (2009) would be compared with block model in estimating ore tonnage and metal (Au-Ag) tonnage for deposit with different geological setting and more complex and erratic data distribution. For this purpose, the data obtained from channel sampling program in Ciurug vein, block South 3, level 500 and 600, Pongkor mines would be used as study case.
Study Location: Pongkor Gold Mine Pongkor Gold Deposit
Mining rights of Pongkor gold deposits with total area ± 4,058 ha was granted to PT Aneka Tambang Tbk. The mining activities in this area were commenced in 1994 using underground method. In December 2007, the total reserve and resource of Pongkor deposits, excluding inferred resource increased 5 % to 3.026 million tones, yielded 743,000 oz gold and 8.2 million oz silver (PT Antam Tbk., 2008).
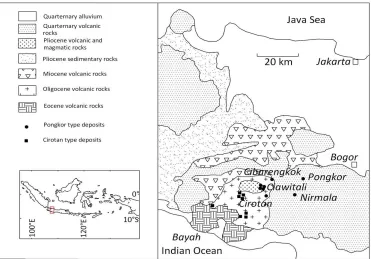
Pongkor gold deposit is situated in north-east flank of Bayah dome (Figure 1). The geology of this area had already been described by several authors. The deposit itself formed the north-west part of circular structure (6 x 8 km) which was interpreted as caldera (tectono - volcanic depression), associated with ignimbrite volcanism (Milési et. al., 1999). Pongkor epithermal deposit was interpreted as low sulphidation epithermal or adularia-sericite (Basuki et. al., 1994 and Milési et. al., 1999) which was formed 2,05 ± 0,05 Ma based on
40
121 Figure 1. Regional geology of West Java, including selected associated epithermal deposits
(Warmada and Lehmann, 2003).
METODOLOGY
Channel Sampling Data
Sampling program in Pongkor Au-Ag epithermal deposit is carried out in exploration and development stages. In exploration stage, the samples were usually obtained by core drilling, while in development stage, the program was executed by channel sampling which intersected the vein. In this paper, the data used were obtained from channel sampling. Each channel consists of several sub-channels which then were assayed for gold and silver separately. Table 1 summarizes the basic statistic for each parameter: thickness, Au content, Ag content, Au grade-thickness and Ag grade-grade-thickness. The total length of sub-channels in a channel is then used as parameter thickness (ti). The Au or Ag content was calculated based on sub-channels composite using length weighting.
122
Table 1. Statistical summary of thickness, metal content, and grade thickness for level 500 and 600, Ciurug, Block South 3.
Parameters Number Min. Max. Mean
Standard deviation
Coefficient
Variation Skewness
Level 500
thickness (m) 132 3.4 15.9 10.1 2.46 0.24 0.49
Au content (g/t) 132 3.13 37.42 12.24 5.77 0.47 1.65 Au
grade-thickness (m*g/t) 132 21.88 381.66 123 60.09 0.49 0.48
Ag content (g/t) 132 61.24 636.92 183.64 95.83 0.52 2.06 Ag
grade-thickness (m*g/t) 132 231.28 7395.44 1892.73 1197.99 0.63 1.00
Level 600
thickness (m) 300 3.2 23.2 14.15 3.81 0.27 0.21
Au content (g/t) 300 1.44 173.22 29.2 24.34 0.83 2.71 Au
grade-thickness (m*g/t) 300 7.5 2355.69 413.25 340.02 0.82 0.52
Ag content (g/t) 300 50.55 1732.98 264.17 191.66 0.73 2.99 Ag grade-
thickness (m*g/t) 300 251.25 23568.5 3758.59 2829.58 0.75 0.68
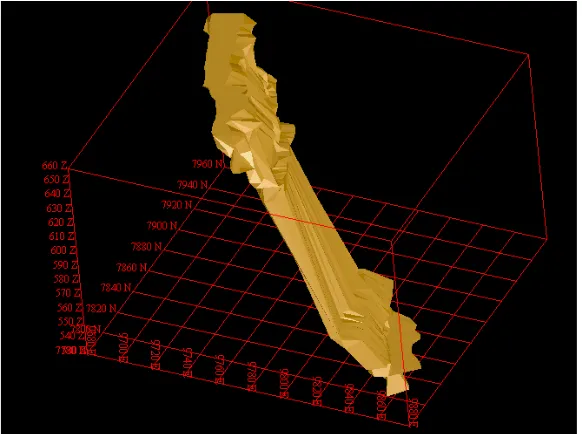
123 Figure 3. Geometry modeling of Ciurug vein, block South 3, level 600 and 500. Red grid in the figure signifies 100 mN x 100 mE x 100 mZ (Prasetyo, et.al., 2009).
Reserve estimation by classical block model
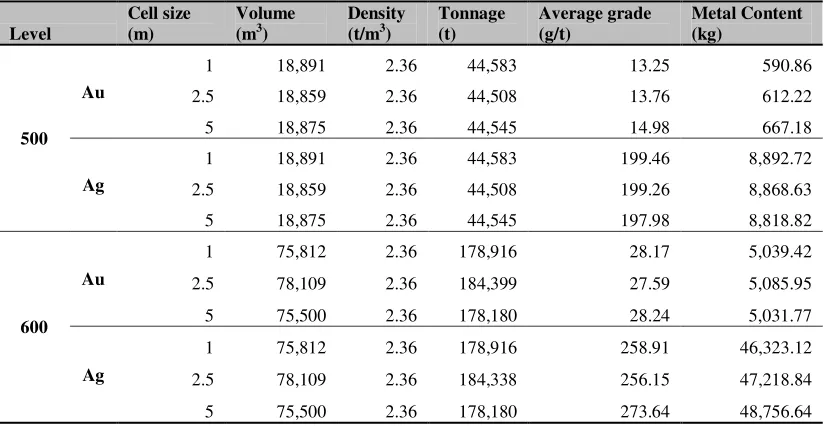
Reserve estimation by classical block model had been carried out by Prasetyo, et. al. (2009) by dividing the deposit bulk volume into smaller units named cells. Modeling and reserve estimation used three method: NNP, IDS, and Kriging to obtain ore tonnage and metal tonnage with three variable cell sizes: 1 m, 2.5 m and 5 m. However in this paper, ore tonnage and metal content figures used as comparator for fractal model calculation were obtained by NNP method with cell size 1 m (Table 2), considering the erratic nature of grade data in the deposit. Number-size fractal modeling
It is assumed before that the exploration data were distributed with constant spacing, both vertically (h) and horizontally (w). So that the mineralized area (A) covered by exploration data or channel sampling could be written as (Wang et. al 2009):
A = whCa (1)
Ca is the total number of channel sampling which intersect the mineralization zone. Please note here that the value of h, w, and A were obtained from the projection of ore body to the vertical plane since the ore body dip exceeds 45° (Figure 4).
The length of each channel could be considered as vein thickness (ti). The data of grade-thickness (li) is obtained by multiplying the length of channel with its grade. For a channel consists of several sub channel, length weighting must be used to obtain the grade-thickness data. The two variables (ti and li) contribute to the ore tonnage (O) and metal content of the deposits (M) as stated by these formulas:
𝑂= 𝑂𝐶𝑎𝑖=1 𝑖= 𝑤ℎ𝑡𝐶𝑎𝑖=1 𝑖= 𝑤ℎ 𝑡𝐶𝑎𝑖=1 𝑖= 𝐶𝐴
𝑎 𝑡𝑖
𝐶𝑎 𝑖=1 (2)
𝑀= 𝑀𝐶𝑎𝑖=1 𝑖= 𝑤ℎ𝑙𝐶𝑎𝑖=1 𝑖= 𝑤ℎ 𝑙𝐶𝑎𝑖=1 𝑖= 𝐴 𝐶𝑎 𝑙𝑖
124
Table2. Reserve estimation in Ciurug vein, block South 3 by NNP (from Prasetyo et. al., 2009).
Level
Cell size (m)
Volume (m3)
Density (t/m3)
Tonnage (t)
Average grade (g/t)
Metal Content (kg)
500 Au
1 18,891 2.36 44,583 13.25 590.86
2.5 18,859 2.36 44,508 13.76 612.22
5 18,875 2.36 44,545 14.98 667.18
Ag
1 18,891 2.36 44,583 199.46 8,892.72
2.5 18,859 2.36 44,508 199.26 8,868.63
5 18,875 2.36 44,545 197.98 8,818.82
600 Au
1 75,812 2.36 178,916 28.17 5,039.42
2.5 78,109 2.36 184,399 27.59 5,085.95
5 75,500 2.36 178,180 28.24 5,031.77
Ag
1 75,812 2.36 178,916 258.91 46,323.12
2.5 78,109 2.36 184,338 256.15 47,218.84
5 75,500 2.36 178,180 273.64 48,756.64
125 If ore body thickness (ti) and grade-thickness (li)
were assumed as continuous variable, they could be formulated in number-size model (Mandelbrot, 1983) as:
𝑁 ≥ 𝑟 =𝐶𝑟−𝐷 (4)
or could be rewritten as
𝑙𝑛𝑁 ≥ 𝑟 =−𝐷𝑙𝑛𝑟+𝑙𝑛𝐶 (5)
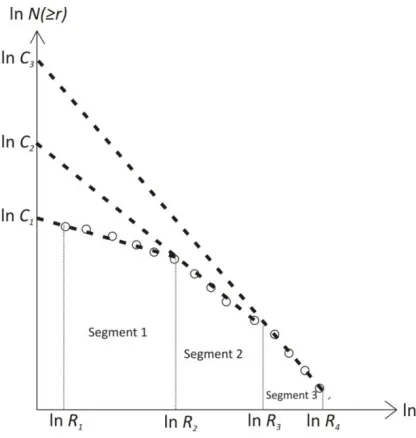
In these equations, r represents the thickness variable (ti) or grade thickness (li), while N(≥r) represents the accumulative number of the data which value is no less than r. D and C are fractal dimension and capacity constant respectively. Plotting between r and N(≥r) in ln-ln scale graphic (Figure 5) produces a straight line with gradient –D. If the ln r– ln N(≥r) plotting could be fitted by single straight line, it is said that the data has simple fractal distribution. In the case that the fitting requires more than one straight line, the data then was said to have bifractal distribution. Each straight line represents one segment (Figure 6) which has different fractal models (C and D value) and bounded by threshold value Ri(i = 1, 2, 3, …, n).
Equation 1 could be used if the channel spacing is constant. For exploration program with irregular spacing could use capacity constant C1 value and fractal dimension D1 value to obtain
wh* value (Equation 6) which required to calculate ore and metal tonnage as written in Equation 2 and 3. The C1 andD1 values could be determined graphically from the first segment along with the rminvalue. Equation 7 and 8 could be expressed as:
𝑂=𝜌 𝑤ℎ∗ 𝐶𝑖𝐷𝑖 constant and fractal dimension in segment i.
126
Reserve Estimation by Number-Size Fractal Model
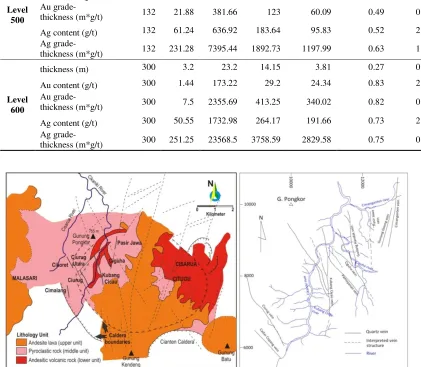
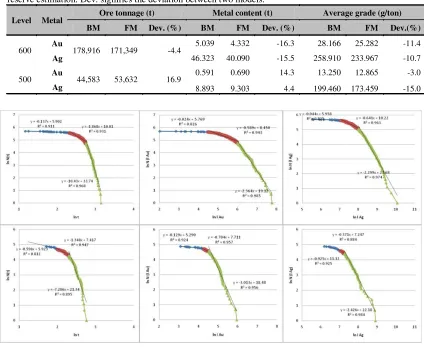
Fractal model in reserve estimation used the same approach as block method: the estimation was carried out separately for each level. Level 600 was confined between 608.175 msl and 654 msl while level 500 was confined between 534 msl and 569 msl (Figure 3). Total mineralized area (A) for each level was determined directly by projecting the ore body to the vertical plane, resulting 4580 sqm and 1981.88 sqm for level 600 and level 500 ore body respectively. Fractal modeling of thickness and grade-thickness of the deposit using number-size model revealed bifractal model, which all of them consisted of three segments (Figure 6). The fitting of each segment using linear equation yielded relatively high coefficient correlation (r2 ≥ 0.812). The lowest one was the first segment in bifractal
model for thickness level 500. The fractal parameters for each segment (Ti or Li, Ci, and Di)
used in reserve estimation including the estimation results was resumed in Table 3 – 5 below. The results were obtained by using Equation 9 and 10.
From Figure 6 for thickness parameters, first segment in ln t axis was bound by lnT1 (minimum) and lnT2 (maximum). D1 was the gradient of first segment while lnC1 was intercept of the first segment with ordinate. T1, T2, and C1 value used in calculation was obtained from the antilog of lnT1, lnT2, and ln C1 respectively. The same rules were applied for second and third segments. The maximum T value in third (final) segment was called as Tmax. For grade thickness parameters, the fractal parameter T was switched to L.
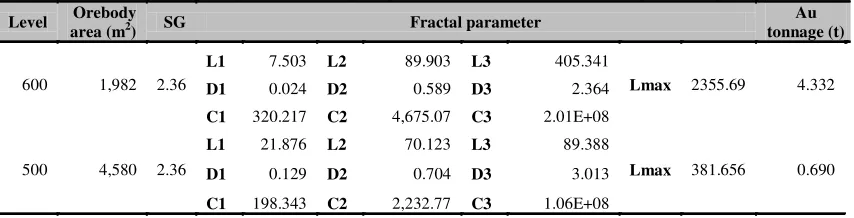
Table 3. Bifractal parameters for thickness (t) and estimated ore tonnage.
Level
Orebody area
(m2)
SG Fractal parameter
Total ore tonnage
(t)
600 1,982 2.36
T1 3.2 T2 10.1 T3 15.65
Tmax 23.2 171,349.08
D1 0.137 D2 1.868 D3 10.43
C1 365.768 C2 22,247.84 C3 4.50E+14
500 4,580 2.36
T1 5.5 T2 7.35 T3 9.95
Tmax 15.9 53,632.29
D1 0.598 D2 1.348 D3 7.286
C1 373.531 C2 1,664.03 C3 1.85E+09
Table 4. Bifractal parameters for gold grade-thickness (l) and estimated gold tonnage.
Level Orebody
area (m2) SG Fractal parameter
Au tonnage (t)
600 1,982 2.36
L1 7.503 L2 89.903 L3 405.341
Lmax 2355.69 4.332
D1 0.024 D2 0.589 D3 2.364
C1 320.217 C2 4,675.07 C3 2.01E+08
500 4,580 2.36
L1 21.876 L2 70.123 L3 89.388
Lmax 381.656 0.690
D1 0.129 D2 0.704 D3 3.013
127
Table 5. Bifractal parameters for silver grade-thickness (l) and estimated silver tonnage.
Level Orebody
area (m2) SG Fractal parameter
Ag tonnage (t)
600 1,982 2.36
L1 251.25 L2 1,119.75 L3 2,976.75
Lmax 23568.5 40.090
D1 0.044 D2 0.641 D3 2.299
C1 386.836 C2 27,446.66 C3 1.92E+10
500 4,580 2.36
L1 485.2 L2 1,107.09 L3 1,403.35
Lmax 7395.44 9.303
D1 0.371 D2 0.925 D3 2.426
C1 1,403.89 C2 67,507.91 C3 4.29E+09
Table 6. Comparation between classic block model (BM, Table 1) and number-size fractal model (FM) in reserve estimation. Dev. signifies the deviation between two models.
Level Metal Ore tonnage (t) Metal content (t) Average grade (g/ton)
BM FM Dev. (%) BM FM Dev. (%) BM FM Dev.(%)
600 Au 178,916 171,349 -4.4 5.039 4.332 -16.3 28.166 25.282 -11.4
Ag 46.323 40.090 -15.5 258.910 233.967 -10.7
500 Au 44,583 53,632 16.9 0.591 0.690 14.3 13.250 12.865 -3.0
Ag 8.893 9.303 4.4 199.460 173.459 -15.0
128
DISCUSSIONS
Thickness and grade-thickness parameters in Ciurug vein, block South 3, level 600 and 500 could be modeled by bifractal models, so that the resource estimation could be carried out with similar characteristic of fractal allows the recurrence of small part in the whole system. In this case, the bifractal modeling of thickness and grade-thickness parameters in both levels which are similar could be possibly occurred in more extended levels in the same vein system.
The number of the data indirectly affects the modeling, especially in fitting process of bifractal segments to obtain capacity constants and fractal dimensions. In fitting, the least coefficient correlation (r2 = 0.812) occurs in first segment of thickness parameter for level 500. Generally the first segments show the least coefficient correlation compared to the other
segments’. This is probably due to the positive
skewness of ln t and ln l distributions (Table 1) which means that the data were centered in low values, so that the plotting of the lowest r values to the next value in ln r – ln N(r) would drastically decrease (Figure 6) and could not be fitted with a straight line. In spite of high value of standard deviation, the thickness and grade-thickness showed low coefficient variation (< 1), which means they posed relatively low variability (Heriawan and Koike, 2008) and seemed insignificantly contribute to the low coefficient of correlation in fitting. To cope with this problem, if the coefficient correlation obtained was very low, the segment could be divided into more segments to obtain higher coefficient correlation value. This also means that skewness still play a role in the number-size fractal modeling although there is no clear correlation between skewness and reserve estimation error (Table 6).
From the third parameters: T or L, C and D, all C
parameters in the third segment had the extreme
values compared to the values of the other segments. These extreme values gave the highest contribution to the final estimation results (tonnage). High capacity constants were directly affected by the fitting process in the third and vice versa for level 600. This is probably due to the different principle in defining ore body multiplying the thickness with area parameter. This result was consistent with the results obtained for metal content which was greater in level 500 and vice versa for level 600, since the metal content calculation was directly affected by bulk volume and tonnage. The least error in average grade for gold level 500 was contributed by the least percentage difference between ore tonnage and metal content.
129 The role could be diminished by better fitting,
which means the fractal model could cope with skewed distributions, something few methods could manage. However, the disadvantage of this method is its futility to estimate local value with certain coordinates (Wang et. al., 2009). In fact, this disadvantage had to be reviewed from self similar point of view as explained before. Other limitation of number-size fractal model is applicable only to continuous variables whereas according to Dominy et. al. (2000), thickness variable and furthermore grade variable are discrete variables. So that the fractal model application in this case has only limited use if thickness and grade were assumed as continuous variables. However in this study case the assumption seems inadequate as stated by significant deviation in calculation results between classic block model and number size fractal model (Table 6). The erraticness of grade distribution could be used as reference on how far the continuity assumption could be applied. Therefore in this discussion the number-size fractal model estimation results were compared with block model results using NNP which is generally used for randomly distributed or erratic data. In this case the continuity is almost non-existent or could be said as discrete. The limitation of continuity assumption was showed in Table 5. The thickness variables had the least error due to high continuity of the thickness variables, roughly showed in Figure 5, where the thickness looked to change gradually. The metal contents in other hand with greater error mean dimension and grade variables. For deposits with erratic grade variable the fractal model has only limited use which powerful generally to estimate bulk volume or ore tonnage since the dimension e.g. thickness has high continuity.
The genetic characteristics should be considered in fractal-model estimation because as stated
before the process overprinting in ore genesis could affect variable continuity. The failure of this model to predict local value should be reviewed further by applying its principle: self similarity. However it must admit that this model is easy to use, and does not require sophisticated software and advance mathematical background.
ACKNOWLEDGEMENT
We gratefully acknowledge UBPE Pongkor, PT Aneka Tambang Tbk, and especially to Mr. Wawan Herawan and Mr. Herian Sudarman.
REFERENCES
Basuki, A., Sumanagara, D. A. and Sinambela, D., 1994, The Gunung-Pongkor Gold-Silver Deposit, West Java, Indonesia. Jour. Geochem. Explor. 50, 371–391. Dominy, S. C., Annels, A. E., Johansen, G. F.,
and Cuffley, B. W., 2000, General considerations of sampling and assaying in coarse gold environment, Trans. Instn Min. Metall.
Griffie, C., Bailly, L. and Milesi, J. P., 2002
Supergene Alteration of Primary Ore Assemblages From Low-Sulfidation Au-Ag Epithermal Deposit at Pongkor, Indonesia, and Nazareno, Peru, Econ. Geol., 97, p.561-571.
Heriawan, M. N. and Koike, K., 2008,
Uncertainty assessment of Coal Tonnage by Spatial Modeling of Seam Distribution and Coal Quality, International Journal of Coal Geology, 76: 217-226.
Mandelbrot, B. B., 1983, The Fractal Geometry of Nature, Freeman, San Francisco. Milési, J.P., Marcoux, E., Sitorus, T.,
130
Prasetyo, E., Syafrizal, Anggayana, K., 2009,
Sample Composite Mechanism to Reduce The Erratic Grade Distribution in Resource Estimation of Au-Ag Epithermal, Ciurug vein, Block 3 South, Level 500 and 600, Pongkor Mine, Proceeding: International Conference Earth Science and Technology Yogyakarta (UGM), Indonesia.
PT Antam Tbk, 2008, Statement of Mineral Resources and Ore Reserves as at 31 December 2007.
Syafrizal, 2006, Genetic Modeling of the Pongkor epithermal Au-Ag Deposit, West Java, Indonesia, Based on Geologic, Mineralogic, and Geochemical Features
of the Ciurug and Cikoret Veins, Dissertation, Department of Earth Resources Engineering, Graduate School of Engineering, Kyushu University. Warmada, I. W, and Lehmann, B, 2003,
Polymetallic Sulfides and Sulfosalts of The Pongkor Epithermal Gold-Silver Deposit, West Java, Indonesia, Canadian Mineralogist, Vol. 41: 185-200.
Wang, Q., Deng, J., Liu, H., Yang, L., Wan, L., Zhang, R., 2009, Fractal Models For Reserve Estimation, Ore Geology Review, 2-14.