PLANT SPECIES DIVERSITY IN RELATION TO CARBON STOCKS
AT JANGKOK WATERSHED, LOMBOK ISLAND
Markum1*), Endang Arisoesilaningsih2), Didik Suprayogo3) and Kurniatun Hairiah3)
1) Faculty of Agriculture University of Mataram Jl. Majapahit 62 Mataram Indonesia 2) Faculty of Sciences University of Brawijaya Jl. Veteran Malang 65145 East Java Indonesia 3) Faculty of Agriculture University of Brawijaya Jl. Veteran Malang 65145 East Java Indonesia
*) Corresponding author Phone:+62-370-621435 E-mail: [email protected]
Received: August 26, 2013 /Accepted: September 23, 2013
ABSTRACT
Jangkok watershed has changed from a degrading forest to become a mosaic of land use systems. This research compared plant species diversity and C-stocks across land use systems. The research analysed the characteristics of six land use systems in a total of 18 plots i.e.Primary Forest (PF), Disturbed Forest (DF), Mahogany-Woodlot (MW), Candlenut-Agroforestry (CA), Multi strata Agroforestry (MA), and Simple-Agroforestry (SA).The species diversity level was measured using Shannon-Wiener index, while C-stocks were assessed according to the RaCSA method. Results showed that forest conversion to agricultural land uses reduced the number and density of tree species, average wood density and basal area. The PF represented the highest biodiversity index (3.46), while the other land uses were categorised as medium to low. The largest C-stock was found in PF and in MW, with the average of 550 Mgha-1, while the lowest was in SA (70 Mgha-1), with other land uses around 219 Mgha-1.The quantity of C-stocks was not related to species diversity, but closely related to wood density (R2=0.84), basal area of all sizes of tree (R2=0.86), and the basal area of trees diameter >30 cm (R2=0.71). Based on the number and species density, MA and CA resembled the characteristics of DF and PF.
Keywords: land use, plant species diversity, carbon stocks, primary forest, agroforestry
INTRODUCTION
Plant species diversity is an integral part of ecosystems (Thomson et al., 2011), and provides ecosystem services valuable for human life (Nasi
et al., 2002). However, the importance of plant
diversity in natural resource management and cultivation has not been closely taken into account by policy makers (Thomson et al., 2011). The Jangkok watershed contains 60% of forest (11.453 ha). This forest area has a higher biodiversity level than other forest areas in the province of West Nusa Tenggara simply because the forest is in a good condition (Prayitno et al., 2001). However, according to Tjakrawarsa et al., (2008), the flora and fauna in the forest areas of Lombok island keeps decreasing due to the land use change practices. Sousson et al (1995) and Chapin et al (2000) asserted the importance of maintaining plant diversity ecologically during this era of climate change is worth-doing in order to maintain the stability of macroclimate by means of the absorption and storage of carbon, maintain the balance in hydrological functions, maintain the soil quality by means of improvement of organic materials and soil nutrient, control erosion, and function as habitat for flora and fauna. Deforestation and forest degradation have caused the change in the composition, structure and function of plant diversity, which leads to the disruption in the ecosystem (Palmer et al., 2004; Hector et al., 2007; Spanos et al., 2007). As suggested by Loresu et al., 2001; Aerts et al., 2011, the challenge that may be faced in the near future is to maintain the environmental balance in order to keep up with the ever-changing dynamic of species diversity by not only relying on programmes aiming to protect but also being involved on those aiming to restore and rehabilitate.
As indicators of decreasing of species diversity level, a diversity index was used (Chapin
et al., 2000; Sharman et al., 2012). Kessler et al
(2005) reported a very high level of tree diversity
Accredited SK No.: 81/DIKTI/Kep/2011
in primary forest of Lore Lindu (Central Sulawesi), where 150 species of trees with the tree diameter >10 cm, and the highest basal area of 140 m2 ha -1 were found. The abundance of tree species kept decreasing since the degradation due to land use change into agroforestry took place. Based on the research conducted in three villages in TN Lore Lindu, Kehlenbeck et al (2004) found 149 useful plant species from the following categories: fruits, vegetables, medicines and spices. The composition and plants density from those three villages were also found different from one another depending on the social and economic background of the owners and soil fertility.
The loss of plant diversity due to land use change varies depending on the form, the structure and the change of vegetation composition. The degradation of plant species diversity due to the forest land use change into other functions is associated with decrease of biomass and carbon stock (Chapin et al., 2000; Hairiah et al., 2006). However, the decrease of biodiversity index of species is not always followed by the decrease of carbon stock (Rahayu et al., 2012; Kendom et al., 2013), depending on the number of trees with high wood density. In general, trees with slow growth have high wood density and tend to store carbon longer (Hairiah et al., 2011). According to Michelsen (2008), the change in land use, biodiversity, and carbon stock tend to occur simultaneously. This research aimed to establish the degree of correlation between plant species diversity and carbon stocks in several land use systems in the forests at Jangkok watershed. The result of this research is expected to be useful for determining a suitable strategy for forest resource management.
MATERIALS AND METHODS
Research Plots and Sites
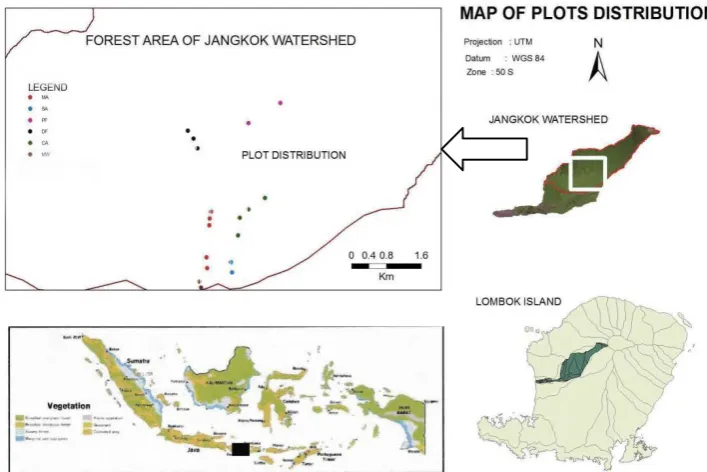
This research was conducted in Jangkok watershed, Lombok island, in a study area defined by its geographical position of 116o20’- 116o31’E and 8o43’ - 8o49’S, which comprises several villages such as Sesaot, Ranget and Buwun Sejati. The climate at the headwater of Jangkok watershed consists of four-month dry and eight-month wet climate. Based on the Schmidth Ferguson classification, such climatic
characteristics are categorised in type C climate (Kurniawan et al., 2012). The annual average rainfall from 2005-2010 was 1392-1752 mm, or 1634 mm/year. According to Chave et al (2005), this area is categorised as a humid zone with its average rainfall of 1500-4000 mm/year. The soil texture in the area of the research is sandy with the average soil content of 63% in 0-30 cm in depth
The observation was conducted in 6 land use systems: (a) primary forest (PF), (b) disturbed forest (DF), (c) mahogany woodlot (MW), (d) candlenut agroforestry (CA), (e) multi strata agroforestry (MA), (f) simple agroforestry (SA).
Eighteen plots were selected to be involved in the measurement process with the following details: PF=2 plots, DF=3 plots, MW=2 plots, CA=4 plots, MA=5 plots, and SA=2 plots (Figure 1). Observations of tree species diversity and C stock used a plot size of 5 x 40 m2, but were extended to 20 x 100 m2 when trees with diameter (DBH) exceeding 30 cm were found (Hairiah et al., 2011).
Analysis on Plant Species Diversity
Tree species diversity observed in this research focused on trees with DBH ≥ 5 cm, measured at 1.3 m above the ground (DBH= Diameter at Breast Height). The observation of plant species diversity relevant to carbon stock consisted of (Ludwiq et al., 1988; Prayitno et al.,
Figure 1. Site of plot distribution at Jangkok Watershed
The basal area describes the width of vegetation cover in an area where samples were taken in the following formula: BA (m2) = Σπ (D)2/4, where D is DBH. Importance Value Index represents the amount of Relative Density (RD) and Relative Dominance (RDs), so that the Importance Value Index is 0-200 %. Species Richness Index (SRI) represents the comparison of individual number of species in one community, where the smaller the SRI value, or the closer the value to 0, the lower value of species richness would be. Biodiversity index involves the following formula by Shannon-Wiener (H’)
H′= − ∑(𝑛𝑖
𝑁 𝑛
𝑖=0
)𝐿𝑛(𝑛𝑖𝑁)
Where :
ni = number of species
N = the total number of individuals of species When H’ < 1, the species diversity was low (unstable). When H’1–3, the diversity was average (fairly stable). When H’ > 3, the species diversity was high (stable). Species Similarity Index (SI) describes the level of species abundance. When all species had the same level of species abundance, the SI would be at
maximum level. However, species with different level would cause the SI to plummet to 0.
SI =𝐿𝑛 (𝑆)𝐻′
Where:
H’ = Shannon-Wiener Index S = Species Richness.
Species similarity would be high when the value of SI ≥ 0.9; the species similarity would be average when 0.5<SI<0.9; and the species similarity would be low when SI ≤ 0.5.
Carbon Stock Analysis
Cluster Analysis
Cluster Analysis was employed in order to group the land use based on the similar characteristics of all variables (Tryfos, 1997; Rambamoorthi, 2013). The grouping was done by using similarity analysis according to Bray-Curtis Index on the analysis of seven variables: species and plant number, wood density (WD), basal area (BA), Shannon-Wiener Diversity Index, and Rate of Endemism (ROE) and carbon stock. Bray-Curtis index value ranged from 0-1. The closer it was to 1, the more obvious the similarity between object and variable. The analysis was followed by Biplot which was employed in order to find out the correlation clusters among the land use based on the seven variables. PAST Software was used in this analysis.
RESULTS AND DISCUSSION
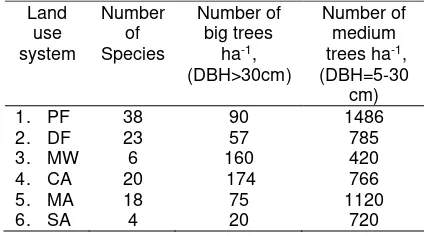
Species Density, Wood Density and Basal Area In eighteen plots observed, 68 tree species were found across the different land uses. Most of the species (87%) found were identified as native, while the rest was exotic (Barthlort, et al., 1999). The highest number of tree species (38 species) was found in PF, and the smallest number was in simple agroforestry SA (Table 1).
Table 1. Number of species, species density and number of trees
Land use system
Number of Species
Number of big trees
ha-1, (DBH>30cm)
Number of medium trees ha-1, (DBH=5-30
cm)
1. PF 38 90 1486
2. DF 23 57 785
3. MW 6 160 420
4. CA 20 174 766
5. MA 18 75 1120
6. SA 4 20 720
Remarks: PF= Primary Forest, DF= Disturbed Forest, MW= Mahogany Woodlot, CA= Candlenut Agroforestry, MA= Multi strata Agroforestry System, SA = Simple Agroforestry System
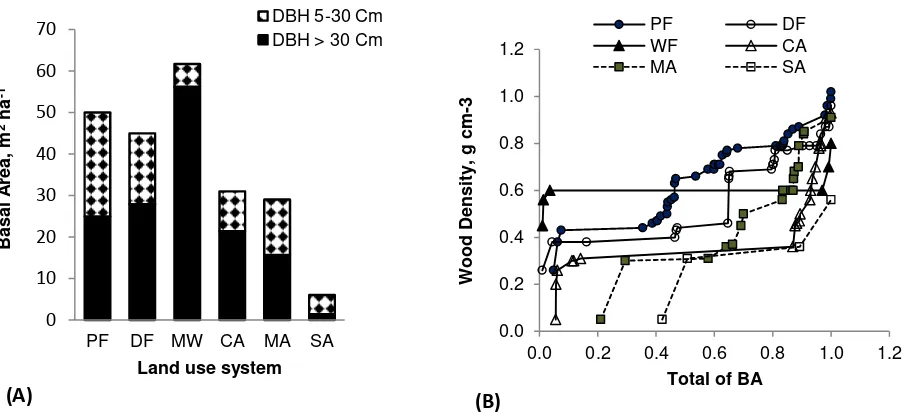
Wood Density (WD) in various land uses ranged from 0.2 to 1.02 g cm-3. The lowest density was found in Jatropha (Jatropha curcas), and the highest density was in Kusum trees
(Schleichera oleosa). Based on the WD
distribution, most of land use had been categorised as light (WD < 0.6 g cm-3), and only the minority had very heavy wood (WD > 0.9 g cm-3), while species of heavy density were not found in MW and SA (Figure 2).
The values of basal areas (BA) of a land represent the density level and DBH of available trees. The results of the analysis show that the highest value of BA was found in MW cover (62 m2 ha-1), followed by primary forest (50 m2 ha-1), and simple agroforestry system (6 m2 ha-1) for the lowest (Figure 3A).
In order to evaluate the composition of types and density of the trees, further analysis was carried out on relative and cumulative BA to BA maximum (BAcumul./BAmax), where it was revealed that PF and MA had more trees of various size for the BA and of several categories for the WD (Figure 3B).
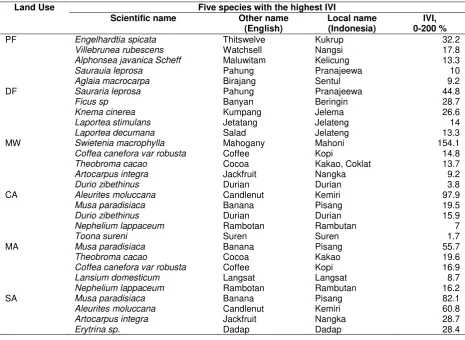
Important Value Index (IVI) and Diversity Index (DI)
Every land use had species with the highest IVI different from each other. In PF, the highest IVI was found in bangsal (Enghelhartia spicata), followed by DF in Pahung (Sauraria
leprosa), MW in mahogany (Swietenia
macrophylla), CA in candlenuts (Aleurites
moluccana) and MA and SA in banana (Musa paradisiaca) (Table 2).
Figure 2. The number of species based on characteristic of their wood density (WD, gcm-3). (PF: Primary Forest, DF: Disturbed Forest , MW: Mahogany Woodlot, CA: Candlenut Agroforestry, MA: Multistrata Agroforestry, SA: Simple Agroforestry)
Figure 3. Basal Area (BA) based on DBH (A) and the correlation between WD and cumulative BA (B) (PF=Primary Forest, DF=Disturbed Forest, CA=Candlenut Agroforestry, MW=Mahogany Woodlot, MA=Multi strata Agroforestry System)
0 5 10 15 20 25 30 35 40 45
PF DF MW CA MA SA
Num
be
r
of
s
pe
c
ie
s
Land use system
WD > 0.9
WD= 0.75-0.9
WD= 0.6-0.75
WD < 0.6
0.0 0.2 0.4 0.6 0.8 1.0 1.2
0.0 0.2 0.4 0.6 0.8 1.0 1.2
Wo
od
Den
s
ity
,
g
c
m
-3
Total of BA
PF DF
WF CA
MA SA
(B)
0 10 20 30 40 50 60 70
PF DF MW CA MA SA
Bas
a
l
A
rea
,
m
2ha
-1
Land use system
DBH 5-30 Cm DBH > 30 Cm
Table 2. Five species listed from the highest IVI
Land Use Five species with the highest IVI Scientific name Other name
(English)
Local name (Indonesia)
IVI, 0-200 % PF Engelhardtia spicata
Villebrunea rubescens DF Sauraria leprosa
Ficus sp MW Swietenia macrophylla
Coffea canefora var robusta Theobroma cacao CA Aleurites moluccana
Musa paradisiaca MA Musa paradisiaca
Theobroma cacao
Coffea canefora var robusta Lansium domesticum
Remarks: PM= Primary Forest, DF= Disturbed Forest, MW=Mahogany Woodlot, CA= Candlenut Agroforestry, MA=Multistrata Agroforestry System, SA=Simple Agroforestry System
Table 3. Analysis on species diversity index in several land uses
Land Use
Richness Index Diversity Index Similarity Index Value Criterion Value Criterion Value Criterion
PF 1.06 High 3.46 High 0.93 High
Remarks: PF=Primary Forest, DF=Disturbed Forest, MW=Mahogany Woodlot, CA=Candlenut Agroforestry, MA=Multistrata Agroforestry System, SA=Simple Agroforestry System
The diversity index analysed consisted of richness index, diversity and similarity index. PF had met the criteria of high values in those three categories (Table 3). The research by Prayitno et al. (2001) in forest areas of Mount Rinjani on dense forest cover showed the similar results,
The Change of Species Diversity
The diversity measurement does not mainly measure the number of species, but more importantly, it looks at the species distribution in one landscape in a particular period of time (Swift
et al., 2004). However, the change in the number of species is an important indicator used to value the dynamic and quality of environment integrally (Hector et al., 2007). The land use change in Jangkok watershed gradually reduced species diversity, their density, and the average of wood density (WD) (Figure 4).
Figure 4. The average of wood density (WD) of various land use systems (PF=Primary Forest, DF= Disturbed Forest, MW= Ma-hogany Woodlot, CA=Candlenut Agro-forestry, MA=Multi strata Agroforestry System, SA=Simple Agroforestry System
There were 24 species in PF which were not found any more in DF, and 70% of the lost species had the WD > 0.6 g cm-3. This could be caused by the following factors: (1) the illegal logging on high quality woods in PF and DF, (2) cultivating and
enrichment programme in plant such as in mahogany and candlenut which cause the growth of other species to decrease, (3) the development of agroforestry system causing farmers to put the plants that give them more profit in priority over others (Muktar, 2011).
Carbon Stock
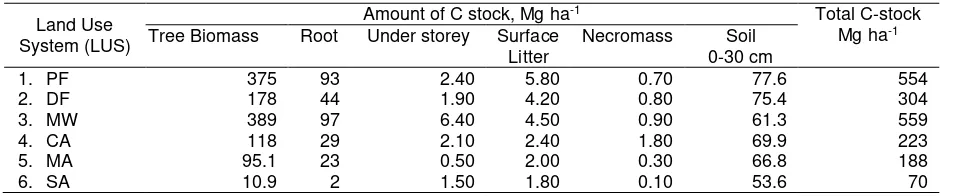
Tree biomass is the main component (approximately 63%) of carbon stock, followed by soil organic matter, root biomass, understorey, surface litter and necromass (Table 4). . For PF and MW, the proportion of carbon stock in tree biomass and soil organic matters was 83% and 15%, respectively. Conversely, for SA, the proportion of carbon stock in soil organic matter and biomass was 78% and 17%, respectively. The other components of carbon stock such as understorey, litter and necromass only contributed 3-4% of the total carbon stock. The research conducted in Nunukan regency, East Kalimantan (Lusiana et al., 2005) and Sumberjaya, Lampung (van Noordwijk et al., 2002) revealed that there was a similar result where the carbon of tree biomass contributed as much as 90% of total carbon stock, and 8-10% came from necromass, understorey and litter.
The carbon stock above ground in PF in DAS Jangkok was larger than the average carbon stock in natural forests in Indonesia ranging from 161-300 Mg ha-1 (Murdiyarso et al., 2008) while in natural forest in Nunukan(Central Kalimantan) was 230 Mg ha-1 (Lusiana et al., 2005). This number, however, was lower than that of East Casteel watershed, Papua in the average of 400 Mg ha-1 (Kendom et
al., 2013). The amount of carbon in DF was also higher than that of the natural forests in East Java which was about 253 Mg ha-1 (Sari et al., 2013).
Table 4. Amount of carbon stocks from five components
Land Use System (LUS)
Amount of C stock, Mg ha-1 Total C-stock Mg ha-1 Tree Biomass Root Under storey Surface
Litter
Necromass Soil 0-30 cm
1. PF 375 93 2.40 5.80 0.70 77.6 554
2. DF 178 44 1.90 4.20 0.80 75.4 304
3. MW 389 97 6.40 4.50 0.90 61.3 559
4. CA 118 29 2.10 2.40 1.80 69.9 223
5. MA 95.1 23 0.50 2.00 0.30 66.8 188
6. SA 10.9 2 1.50 1.80 0.10 53.6 70
Remarks: PF=Primary Forest, DF=Disturbed Forest, MW=Mahogany Woodlot, CA=Candlenut Agroforestry, MA=Multistrata Agroforestry System, SA=Simple Agroforestry System
0 0.1 0.2 0.3 0.4 0.5 0.6 0.7 0.8
PF DF MW MA CA SA
A
v
e
ra
ge
of
W
D
,
g
c
m
-3
Correlation of Wood Density and Basal Area to Carbon Stock
Wood density, basal area of all trees (DBH=5-30 cm), and basal area of big trees (DBH>30cm) are the main factors affecting the carbon stock (Figure 5A, 5B, 5C), while the tree density did not affect the level of carbon stock (Figure 5D).
This fact caused uncertainty in estimating the carbon stock based on analysis of satellite imagery which relies only on canopy cover of vegetation (Leaf Area Index). Therefore, carbon calculation at landscape level based on spacial analysis must be accompanied by an measurement of the basal area and identification wood density of trees.
Figure 5. Correlation between plot characteristics and carbon stock (A), correlation between basal area and carbon stock (B), correlation of basal area and DBH> 30 cm to carbon stock (C), and correlation between number of trees and carbon stock (D) in several kinds of land use of 18 measured plots.
y = 7.1913x - 3.5743 R² = 0.8656
0 100 200 300 400 500 600
0 20 40 60 80 100
C
sto
cks,
M
g
h
a
-1
BA, m2ha-1
(B)
0 100 200 300 400 500 600
0
1000
2000
3000
C
S
to
cks,
M
g
h
a
-1
Number of trees per ha
(D)
y = 18.652e4.9x
R² = 0.8371
0 100 200 300 400 500 600
0 0.2 0.4 0.6 0.8
C
Stock
s,
M
g
ha
-1
The average of WD, g cm-3
(A)
y = 7.2968x + 88.644 R² = 0.7058
0 100 200 300 400 500 600
0 20 40 60 80
C
sto
cks,
M
g
h
a
-1
BA DBH>30 cm, m2ha-1
Cluster Analysis
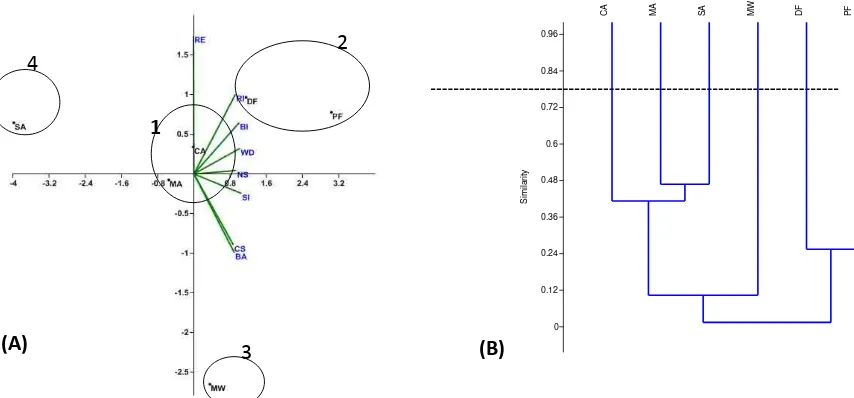
The result obtained from cluster analysis on species diversity by Bray-Curtis was ≥ 0.8, where the land uses in Jangkok watershed were divided into 4 clusters: 1=CA, MA, 2=PF and DF, 3=MW and 4=SA. PF and DF were in the same cluster as they were characterised by similar value of richness index, Shannon-Wiener Index, Rate of Endemism (ROE), and wood density, where they showed high value. Meanwhile, with their medium values, MA and CA had similarity in almost all variables. MW was in separated cluster which was characterised by high values of basal area and carbon stock, while SA was characterised with low value in all variables, especially in ROE (Figure 6A).
Biplot analysis underlines that carbon stock value is not closely correlated to species diversity. High carbon stock does not always provide high diversity index, as shown in MW. The cultivation of either MA or CA was close to that of DF and PF, which indicates that MA, CA were possibly similar to DF and PF especially in the number of species, diversity index and richness index. Different result was shown in cluster analysis according to plant community structure (Figure 6B), where there seemed to be no grouping in several kinds of land use, which indicates that species and species structure of each land use had undergone some significant changes, so that different land use brought different characters.
CONCLUSION
Land use change has led to changes in plant species diversity, the number and density of the species, the average of wood density and basal area of trees. Number of species in the PF (38 species) decreased to 42-84% due to the land use conversion. Mostly (70%), the decrease was triggered by the decreasing tree species whose wood density was > 0.6 g cm-3. The highest diversity index was found in PF (3.46), and the lowest in SA (0.49), while in other land uses in a range of 1.41 to 2.51. Land use changes also led to the change in carbon stocks. The highest carbon stock was found in MW and PF (around 550 Mg ha-1), followed by the average amount of carbon stock in DF (304 Mg ha-1), CA (223 Mg ha-1), MA (188 Mg ha-1), while the lowest carbon stock was in SA (70 Mg ha-1). Plant density was not closely correlated to carbon stock. In fact, basal area of trees and wood density were the two factors that affect the level of carbon stock, in which the increase of the basal area and wood density was followed by the increase of carbon stock. The diversity index and species richness of MA and CA were slightly similar to those of DF and PF which indicates the success of agroforestry practices.
Figure 6. Cluster and Biplot analysis according to species diversity. (A) cluster analysis according to species structure (B) (RI=Richness Index, BI= Biodiversity Index, SI=Similarity Index, WD=Wood Density, NS=Number of Species, ROE=Rate of Endemism, BA=Basal Area, CS=Carbon Stocks
(A)
1
3
2
4
(B)
0 0.12 0.24 0.36 0.48 0.6 0.72 0.84 0.96
S
im
ila
ri
ty
ACKNOWLEDGMENTS
This manuscript is a part of the first author’s dissertation for Doctoral Program, Faculty of Agriculture, University of Brawijaya. Gratitude is addressed to the community for its help in the measurements of plot level, the Laboratory of Soil Science, Faculty of Agriculture the University of Mataram (Mr. Untung and Mr. Made), who helped in soil organic matter analysis, and Mrs. Mastari, the Laboratory of Mining Office of West Nusa Tenggara Province who helped in drying process of plant samples.
REFERENCES
Aerts, R. and O. Honnay, 2011. Forest restoration, biodiversity and ecosystem functioning. BMC ecology.11:29:1-10
Barthlort, W., J. Mutke and G. Kier, 1999. BIOMAPS.Biodiversity mapping for pro-tecttion and sustainable use of natural resources.www.botanik.uni-bonn.de. Ac-cessed 13 May 2013.
Brearly, F.Q., S.Prajadinata, P.S.Kidd, J. Proctor and Suriantata, 2004. Structure and floristics of an old secondary forest in Central Kalimantan, Indonesia and a comparison with adjacent primary forest. Elsevier 195:385-397
Chapin, F Stuart., Zavaleta, ES., Eviner VT., Naylor RL., Vitousek, PM., Reynolda, HL., Hooper DU., Lavorel S., Sala OE., Hobbie SE., Mack MS., Diaz S., 2000. Consequences of changing biodiversity. Nature. 405:234-242.
Chave, J., C. Andalo, S. Brown, M.A. Cairns, J.Q.Chambers, D.Eamus, H. Folster, F.Fromard, N.Higuchi, T.Kira, J.P.Lescure, B.W.Nelson, H.Ogawa, H.Pulg, B.Riera, T.Yamakura, 2005. Tree allometry and improved estimation of carbon stocks and balance in tropical forest. Oecologia 145:87-99.
Hairiah, K., S. Rahayu and Berlian, 2006. Coffee-based Agroforestry Community Service: Carbon Stock in Tree Biomass and Soil Organic Matter (case study conducted in Sumberjaya, West Lampung) (in Indonesian). J. Agrivita. Vol. 28 (3) : 298-309.
Hairiah, K., A. Ekadinata, R.R. Sari and S. Rahayu. 2011. Carbon Stock
Measurement: fromland use system to landscape (in Indonesian). Word Agrofo-restry centre. 88 p.
Hector, A. and R. Bagchi, 2007. Biodiversity and ecosystem multi functionality. Nature. 448:188-191.
Indriyanto. 2008. Forest Ecology (in Indonesian). Bumi Aksara. 210 p.
Kehlenbeck, K. and B.L. Maass. 2004. Crop diversity and classification of homegardens in Central Sulawesi, Indonesia. Agroforestry systems 63:53-62 Kendom, M., K. Hairiah and Sudarto, 2013. Carbon Emission Estimate at East Casteel Watershed based on the change of natural forest cover in Asmat Regency, Papua (in Indonesian) Universitas Brawijaya. Thesis. 161p
Kessler, M., P.J.A. Kessler, S.R. Gradstein, K. Bach, Schmull and R. Pitopang, 2005. Tree diversity in primary forest and different land use systems in Central Sulawesi, Indonesia. Biodiversity and conservation 14: 547–560.
Ketterings, Q.M., R. Coe, M. van Noordwijk, Y. Ambagau and C.A.Palm. 2001.Reducing uncertainty in the use of allometric biomass equations for predicting above-ground tree biomass in mixed secondary forests.Elsevier. 146:199-209
Krisnawati, H., W.C. Adinugroho and R. Imanudin, 2012. (allometric monograph for tree biomass estimation in all types of forest ecosystem in Indonesia.) (in Indonesian ). Indonesian Forest Research and Development Centre. Indonesian Forestry Ministry.119 p.
Kurniawan, W., Muktar and Markum, 2012. Upda-ted Jangkok watershed of Lombok Island (in Indonesian).Research report.123 p. Lusiana, B., M. van Noordwijk and S. Rahayu,
2005. Amount of Carbon Stock in Nunukan Regency, East Kalimantan: Spatial Monitoring and Modelling. (in Indonesian ). ICRAF.p 22-36
Ludwiq, J.A, and J.F. Reynolds, 1988.Statistical ecology a primer on methods and computing.John Wiley & sons, New York.p. 109-202.
Michelsen, O. 2008. Assessment of land use impact on biodiversity.Int J LCA. 13(1):22-31
Muktar, 2011. Community based forest management: Case study of protected forests in Sesaot. ( in Indonesian ). Thesis. Environment and Natural Resource Management Program. University of Brawijaya, Malang.169p.
Murdiyarso D., S. Margaret, G. Manuel, K. Markku, L. Cecilia, V. Pita and S. Osvaldo, 2008. Measuring and monitoring forest degradation for REDD. CIFOR. 6p Nasi, R., S. Wunder and A. J.J. Campos., 2002.
Forest ecosystem services : can they pay our way out of deforestation ? A discussion paper prepared for the GEF for the forestry roundtable to be held in conjunction with the UNFF II. Costa Rica. Palmer M.E., E. Bernhardt and S. Chonersky, 2004.Ecology for a crowded planet. Sciences. 304:1251-1252.
Prayitno, W. and Wasmat, 2001.Flora and Fauna in Rinjani. Research Report. WWF of West Nusa Tenggara.119 p.
Rahayu S. and D. Harja, 2012. Dynamic of Plant Biodiversity and Carbon Stock in Landscape and Land Cover Scale (in Indonesian) Word Agroforestry Centre, ICRAF Southeast Asia Regional Office. 14 p.
Rambamoorthi, N. 2013. Hirarchical cluster analysis. Some basic and algorithms. CRM portals Inc. 11 Bartram Road, Englishtown, NJ07726. 10 p
Sari, R.S., K. Hairiah and Suyanto, 2013. Estimates of Carbon Emission for Setting up Historical Emission Baseline in East Java (in Indonesian). Thesis. Faculty of
Agriculture, University of Brawijaya, Malang. 145p.
Sharman, M. and M.C. Mlambo, 2012.Wicked : The problem of biodiversity loss. GAIA. 21(4):274-277
Sousson, J., B Shestra. and L. Uprety., 1995. The social dynamic of deforestation : A case study from Nepal. Caterton Hill : Parthenon.
Spanos, K.A. and A. Feest., 2007. A review of the assessment of biodiversity in forest ecosystems. Management of environmental quality : An international journal. 18(4):475-486
Swift, M.J., A.M.N. Izac and M. van Noordwijk, 2004. Biodiversity and ecosystem services in agricultural landscapes- are we asking the right question? Elsevier.Agricultur, ecosystem and environment.104 :113-134. Thomson, I.D., K. Okabe., M. Jason, Tylianakis, P. Kumar, E.G. Brockerhoff, N.A. Schellhorn, J.A. Parotta, and R. Nasi, 2011.Forest biodiversity and the delivery of ecosystem goods and services translating science int policy.Bioscience. 61(12):972-981. Tjakrawarsa, G., G. Suardika, A.C. Dining,
Syafrudin, S. Fajar, W. Basuki, A. Jaswadi and Markum, 2008. Hydrological Analysis and land cover change around Mount Rinjani, Lombok (in Indonesian) .WWF Indonesia.87 pp.
Tryfos P., 1997. Cluster Analysis. http://www. yorku.ca/ptryfos/f1500.pdf. Chapter 15. 23 p. Accessed, 13 May 2013.