52
A. Result of the Researc 1. Result of Pre-test
The researcher conducte
the treatment. The score
test can be seen in figure
Graph of t
(Graph of the students’ voc
Based on figure 1, the m
= 9.583, N = 24, medi
maximum= 56. It showe
they got treatments.
52
CHAPTER IV
RESULT AND DISCUSSION arch
onducted pre-test in order to see students’ vocabulary m
ore of the students’ vocabulary mastery that were
ure 1 and 2.
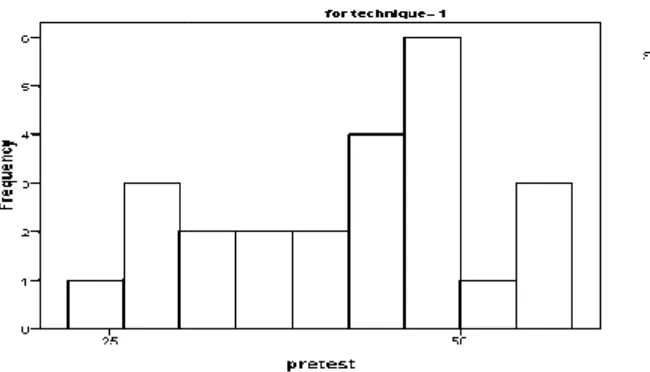
Figure 1
aph of the Result of the Pre-test in Experimental Class
vocabulary mastery of the pre-test in experimental clas
mean of pre-test in experimental class is 42, standa
edian = 44.00, variance = 91.826, minimum
howed students’ vocabulary mastery in experimenta
52
y mastery before
were tested in pre
ass
lass)
andard deviation
um score = 24,
53
Graph o
(Graph of students’s vocab
Based on figure 2, the m
= 7.824, N = 24, medi
maximum= 56. It showe
got treatments.
According to the data o
experimental class was
indicated that the student
almost same before they
53
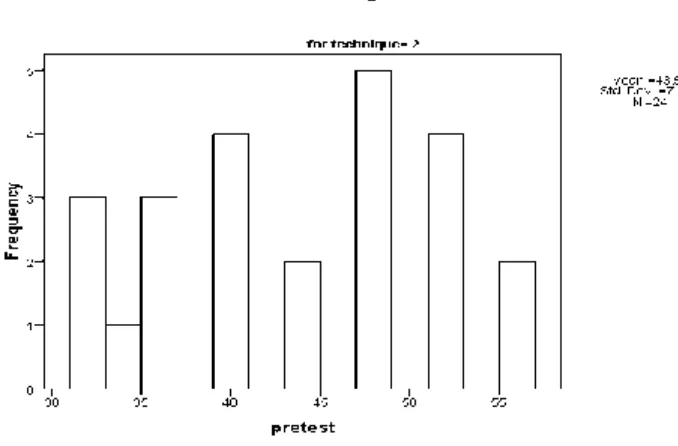
Figure 2
aph of the Result of the Pre-test in Control Class
ocabulary mastery on the pre-test in control class)
mean of pre-test in control class was 43.58, standa
edian = 44.00, variance = 61.210, minimum
howed students’ vocabulary mastery in control clas
a of pretest above, it can be seen that the mean
was 42.00 and the mean in control class was 43.
udents’ vocabulary scores in experimental ans cont
hey got treatments.
53
andard deviation
um score = 32,
lass before they
an of pretest in
s 43.58. It was
54
2. Result of Post-test
The post-test was admi
mastery after the treatme
vocabulary mastery in the
Graph of t
(Graph of the students’ voc
Based on figure 3, the
deviation = 6.347, N = 2
maximum= 84. It showed s
54
t
dministrated in order to know students’ students
ments given. It can be seen from the post-test scor
n the control class and experimental class in figure 3
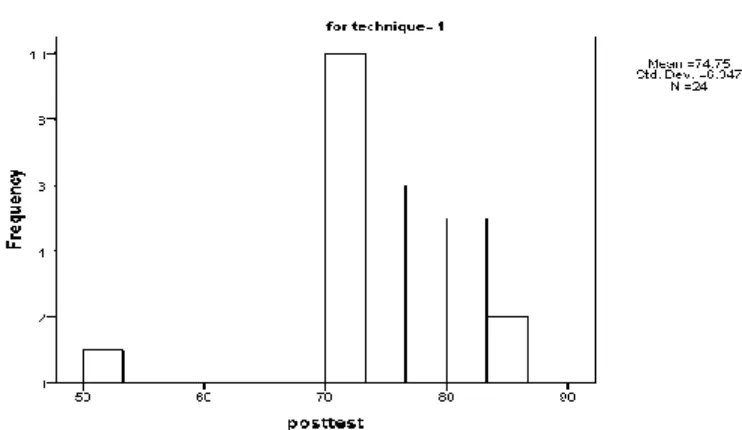
Figure 3
aph of the Result of the Post-test in Experimental Class
vocabulary mastery of the post-test in experimental clas
he mean of post-test in experimental class is 74.7
= 24, median = 76.00, variance = 40.283, minimum
howed students’ vocabulary mastery after they got tre
54
nts’ vocabulary
core of students’
re 3 and 4.
ass
class)
74.75, standard
um score = 52,
55
Graph o
(Graph of the students’ voc
Based on figure 4 abov
deviation = 13.380, N =
48, maximum= 84. It sh
in control class.
According to the data of
experimental class was 74.75
experimental class was
vocabulary mastery have
stray technique.
55
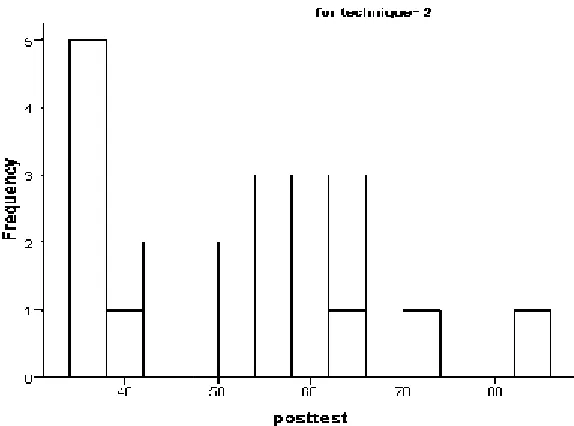
Figure 4
aph of the Result of the Post-test in Control Class
vocabulary mastery of the post-test in control class)
bove, the mean of post-test in control class is 53.3
N = 24, median = 53.00, variance = 179.014, mini
showed students’ vocabulary mastery after they g
of post-test above, it can be seen that the mean o
s 74.75 and the mean in control class was 53.33.
s higher then control class, it was indicated that
ave increased after they got treatments by using
55
53.33, standard
inimum score =
y got treatments
n of post-test in
53.33. The mean in
hat the students’
56
3. Gain Score
The researcher got gain score from post-test score reduced by pretest score.Gain score
was used to analyze normality, homogeneity and hypothetical independent t-test. If
gain score in this manner positive, it indicated that post-test score was higher than
pretest. A negative gain score indicated that the post-test score was lower than pretest.
The gain score of the students in this research can be seen in appendix.
B. Result of Data Analysis 1. Result of Normality
The researcher did this normality test to know whether the data have normal
distribution or not. In this case, the researcher used SPSS version 16 to calculate the
data.
a. The hypotheses
The hypotheses are:
H0: The data have normal distribution.
Ha: The data do not have normal distribution.
b. The test criteria
The test criteria are:
57
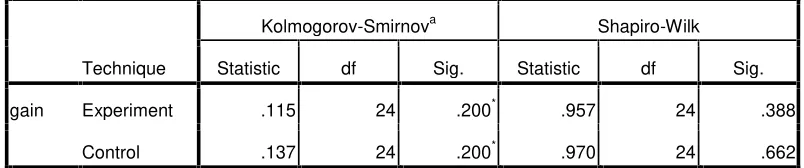
Table 6
The normality Test of Experimental and Control Class
Technique
Kolmogorov-Smirnova Shapiro-Wilk
Statistic df Sig. Statistic df Sig.
gain Experiment .115 24 .200* .957 24 .388
Control .137 24 .200* .970 24 .662
a. Lilliefors Significance Correction
Based on Table 4.1, it can be seen that Pvalue (Sig.) for experimental class was 0.388
and Pvalue (Sig.) for control class was 0.662. Because Sig. (Pvalue) of experimental
class > α 0.05. So, Ho is accepted and Sig. (Pvalue) for the control class > α 0.05. So,
Ha is rejected. The conclusion is that the data in the experimental class and control
class had normal distribution.
2. Result of Homogeneity
The researcher tested homogeneity test after he got score of students’ vocabulary
mastery in control class and experimental class (pretest and posttest of students’
vocabulary mastery)
a. The hypotheses are:
Ha= The variance of the data are not homogeneous
Ho= The variance of the data are homogeneous
b. The criteria of the test are follows:
58
Hais accepted if sig < α = 0.05
Table 7
The Result of Homogeneity Test
Levene Statistic df1 df2 Sig. Gain
Based on Mean .471 1 46 .496
Based on the results obtained in the test of homogeneity of variances in the column, it
could be seen thatSig. (Pvalue) based on mean was 0.496> α = 0.05. It demonstrated
that Howas accepted because Sig. (Pvalue) > α = 0.05. It means that the variance of
the data were homogenous.
3. Result of Hypothetical Test
Based on the previous explanation, the normality and homogeneity test were
satisfied. Therefore, the researcher used the hypothetical test using SPSS (Statistical
Program for Social Science),independent sample t-test.
The hypothesis formulas are:
Ha : There is no influence of using two stay two stray technique towards students’ vocabulary mastery at the first semester of the eighth grade
of SMP N 3 Kotabumilampung Utara in the academic year of
2017/2018.
Ho : There is influence of using two stay two stray technique towards
students’ vocabulary mastery at the first semester of the eighth grade
59
2017/2018
The criteria of acceptance or rejection of the hypothesis for hypothetical test
were:
Hois accepted ifSig.(Pvalue) > α = 0.05
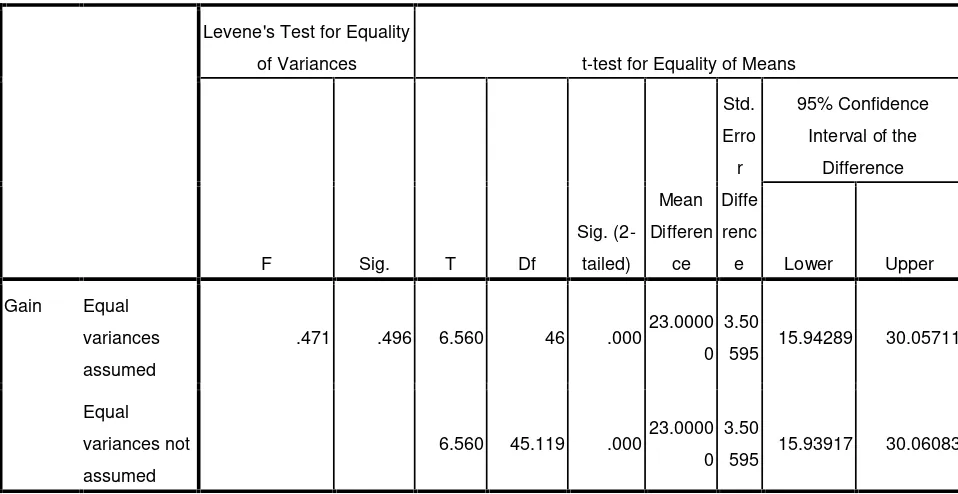
Hais accepted if Sig. (Pvalue) < α = 0.05 Table 8
The Result of Hypothetical Test
Levene's Test for Equality
of Variances t-test for Equality of Means
F Sig. T Df
Sig. (2-tailed) Mean Differen ce Std. Erro r Diffe renc e 95% Confidence
Interval of the
Difference
Lower Upper
Gain Equal
variances
assumed
.471 .496 6.560 46 .00023.0000 0
3.50
595 15.94289 30.05711
Equal
variances not
assumed
6.560 45.119 .00023.0000 0
3.50
595 15.93917 30.06083
Based on the results obtained in the independent sample t-test in Table 4.3 above, the
value of significant generated Sig. (Pvalue) = 0.000< α = 0.05. So, Ha is accepted and
Ho is rejected. Based on the computation, it can be concluded that there was a
significant influence of two stay two stray technique towards students’ vocabulary
mastery in the first semester of the eighth grade of SMP N 3 Kotabumilampung Utara
60
C. Discussion
The students’ vocabulary mastery at SMP N 3 Kotabumi Lampung Utara have
difficulty in learning vocabulary, it is proven by the score of the students in
preliminary research. There were 70% of the students who got the score under 65 as
the KKM. It means that the students’ vocabulary mastery is still low and need to be
increased. To solve the problem, the researcher applied two stay two stray technique
in teaching vocabulary. Thus, the objective of this research is to know whether there
is influence of using two stay two stray technique toward students’ vocabulary
mastery at the first semester of the eighth grade of SMP N 3 Kotabumi lampung
Utara in the academic year of 2017/2018. This research had been carried through six
steps. They involved try out test, pre-test, three times of treatments, and post-test.
The research had been conducted since November, 20th 2017 at 08:40 to 10.00, it
begun by giving tryout test to the students in VIII B as try out class. The researcher
prepared 50 test items as the instrument of the test items for pre-test and post-test.
From 50 test items of tryout, some items were chosen as the instrument of the test.
The choosing of the instrument had been done by considering two categories, validity
and reliability. After being tryout the researcher used 25 questions for pre-test and
post-test.
Before conducting treatments, the researcher conducted the pre-test for experimental
class on November, 21st 2017 at 09:40 to 11:00 am, and control class on November,
61
multiple choice test with four options (a, b, c, and d). the result of pre-test was shown
that the mean in control class was 43.58 and in experimental class was 42. (see
appendix 13).
After conducted the pre-test, the researcher conducted three times treatments. The
first treatment was administered on November 22nd 2017 at 07:15 to 08:35 am. The
lesson has begun by greeting the students, introducing the researcher and checking
their attendance. The next step was teaching learning process. Before applying the
technique, the researcher gave material about nouns. The topic in the first treatment
was learning noun in daily activities. Thus, the teaching and learning process was
attended by 24 students. As the material fully delivered, the researcher implemented
two stay two stray technique. The researcher explained the role of the technique to the
students. The researcher divided students become six groups, each groups consist of
four students. Then the researcher gave text about daily activities. Three groups was
got the same text and three groups was got the same text. After they understanding
the material, two students of each group moved to another group that got the different
text from their groups. Then they changed the information of the text. Finally they
came back to their first group to matching their information. In the last activity, the
researcher together with the students made conclusion of what they have learned.
After that the researcher evaluated by giving the questions based on the text. And
62
The second treatment was administered on November, 25th 2017 at 07:15 to 08:35 am. The researcher did almost the same activity to begin the class as what the
researcher did in the first treatment. But the learning material in the second meeting
was about verbs and adjectives. In the second treatment, it was better than the first
treatment, because the students knew the technique and material before the lesson
began. The procedure of two stay two stray technique was done better than previous
treatment, therefore the students more active and motivate in learning process with
the second treatment.
The third treatment was administered on November, 28th 2017 at 07:15 to 08:35 am. The researcher held the activity as usual from beginning until closing. The activities
in the third meeting still same as the first and second meeting. The learning material
in the third meeting was about nouns verbs and adjectives in daily activities.
After finishing all treatments, the researcher conducted post-test for experimental and
control class. Both control and experimental classes were tested with the same test
items, the post test was conducted on December 2nd2017 at 07:15 to 08.35 am. In the
post-test, the test items consist of 25 items of multiple choice test with four options
(a, b, c, and d). The result of the post test was shown that mean in control class was
53.55, and mean in experimental class was 74.75. (see appendix 13).
Based on the result of pre-test and post-test score above, it showed that the mean in
63
the mean in the pre-test score of control class was 43.58 and in post-test was 53.33.
According to the result of the students’ pre-test and post-test score, it showed that the
students’ post-test score was higher than pre-test score. After the researcher got the
pre-test and pos-test score, the researcher used the data to find out the gain score.
Gain score was used to analyze the normality of data and it showed that the data were
normal. After the data was normal, the researcher analyzed the homogeneity of the
data based on the gain score and it showed that the data were homogeneous.
Based on the analysis of the data and testing of the hypothesis, the result of the
calculating by using SPSS version 16 found that sig. (2-tailed) of the equal variance
assumed in the independent sample test table was 0.000. it was lower than 0.005 as
the criteria. It means that the hypothesis null (Ho) was rejected and the hypothesis
alternative (Ha) was accepted. From the analysis above, it can be concluded that the
use of two stay two stray technique in teaching vocabulary could improve the
students’ vocabulary mastery.
The result of the data analysis showed that the use of two stay two stray technique in
teaching vocabulary seemed to be applicable for the eighth grade of SMP N 3
Kotabumilampung Utara. The technique made the studentseasier to memorize the
vocabulary. It means that this research enriches the previous research that was
conducted by Dina Nur entitled Influence of two stray two stray towards students’
reading ability. In the end of the thesis she said that the students’ reading ability have
64
From the explanation above, it can be concluded that there is influence of using two
stay two stray technique towards students vocabulary mastery at the first semesterof
the eighth grade of SMP N 3 Kotabumi Lampung Utara in academic year of