Byron Ellis
Techniques to Analyze and
John Wiley & Sons, Inc. 10475 Crosspoint Boulevard Indianapolis, IN 46256 www.wiley.com
Copyright © 2014 by John Wiley & Sons, Inc., Indianapolis, Indiana Published simultaneously in Canada
ISBN: 978-1-118-83791-7 ISBN: 978-1-118-83793-1 (ebk) ISBN: 978-1-118-83802-0 (ebk)
Manufactured in the United States of America
10 9 8 7 6 5 4 3 2 1
No part of this publication may be reproduced, stored in a retrieval system or transmitted in any form or by any means, electronic, mechanical, photocopying, recording, scanning or otherwise, except as permitted under Sections 107 or 108 of the 1976 United States Copyright Act, without either the prior written permis-sion of the Publisher, or authorization through payment of the appropriate per-copy fee to the Copyright Clearance Center, 222 Rosewood Drive, Danvers, MA 01923, (978) 750-8400, fax (978) 646-8600. Requests to the Publisher for permission should be addressed to the Permissions Department, John Wiley & Sons, Inc., 111 River Street, Hoboken, NJ 07030, (201) 748-6011, fax (201) 748-6008, or online at http://www.wiley. com/go/permissions.
Limit of Liability/Disclaimer of Warranty: The publisher and the author make no representations or war-ranties with respect to the accuracy or completeness of the contents of this work and specifi cally disclaim all warranties, including without limitation warranties of fi tness for a particular purpose. No warranty may be created or extended by sales or promotional materials. The advice and strategies contained herein may not be suitable for every situation. This work is sold with the understanding that the publisher is not engaged in rendering legal, accounting, or other professional services. If professional assistance is required, the services of a competent professional person should be sought. Neither the publisher nor the author shall be liable for damages arising herefrom. The fact that an organization or Web site is referred to in this work as a citation and/or a potential source of further information does not mean that the author or the publisher endorses the information the organization or website may provide or recommendations it may make. Further, readers should be aware that Internet websites listed in this work may have changed or disappeared between when this work was written and when it is read.
For general information on our other products and services please contact our Customer Care Department within the United States at (877) 762-2974, outside the United States at (317) 572-3993 or fax (317) 572-4002.
Wiley publishes in a variety of print and electronic formats and by print-on-demand. Some material included with standard print versions of this book may not be included in e-books or in print-on-demand. If this book refers to media such as a CD or DVD that is not included in the version you purchased, you may download this material at http://booksupport.wiley.com. For more information about Wiley products, visit www.wiley.com.
Library of Congress Control Number: 2014935749
Executive Editor Robert Elliott
Project Editor Kelly Talbot
Technical Editors Luke Hornof Ben Peirce Jose Quinteiro
Production Editors Christine Mugnolo Daniel Scribner
Copy Editor Charlotte Kugen
Manager of Content Development and Assembly
Mary Beth Wakefi eld
Director of Community Marketing David Mayhew
Marketing Manager Carrie Sherrill
Business Manager Amy Knies
Vice President and Executive Group Publisher
Richard Swadley
Associate Publisher Jim Minatel
Project Coordinator, Cover Todd Klemme
Proofreader Nancy Carrasco
Indexer John Sleeva
Byron Ellis is the CTO of Spongecell, an advertising technology fi rm based in New York, with offi ces in San Francisco, Chicago, and London. He is responsible for research and development as well as the maintenance of Spongecell’s com-puting infrastructure. Prior to joining Spongecell, he was Chief Data Scientist for Liveperson, a leading provider of online engagement technology. He also held a variety of positions at adBrite, Inc, one of the world’s largest advertising exchanges at the time. Additionally, he has a PhD in Statistics from Harvard where he studied methods for learning the structure of networks from experi-mental data obtained from high throughput biology experiments.
About the Technical Editors
With 20 years of technology experience, Jose Quinteiro has been an integral part of the design and development of a signifi cant number of end-user, enter-prise, and Web software systems and applications. He has extensive experience with the full stack of Web technologies, including both front-end and back-end design and implementation. Jose earned a B.S. in Chemistry from The College of William & Mary.
Before writing a book, whenever I would see “there are too many people to thank” in the acknowledgements section it would seem cliché. It turns out that it is not so much cliché as a simple statement of fact. There really are more people to thank than could reasonably be put into print. If nothing else, including them all would make the book really hard to hold.
However, there are a few people I would like to specifi cally thank for their contributions, knowing and unknowing, to the book. The fi rst, of course, is Robert Elliot at Wiley who seemed to think that a presentation that he had liked could possibly be a book of nearly 400 pages. Without him, this book simply wouldn’t exist. I would also like to thank Justin Langseth, who was not able to join me in writing this book but was my co-presenter at the talk that started the ball rolling. Hopefully, we will get a chance to reprise that experience. I would also like to thank my editors Charlotte, Rick, Jose, Luke, and Ben, led by Kelly Talbot, who helped fi nd and correct my many mistakes and kept the project on the straight and narrow. Any mistakes that may be left, you can be assured, are my fault.
For less obvious contributions, I would like to thank all of the DDG regulars. At least half, probably more like 80%, of the software in this book is here as a direct result of a conversation I had with someone over a beer. Not too shabby for an informal, loose-knit gathering. Thanks to Mike for fi rst inviting me along and to Matt and Zack for hosting so many events over the years.
Introduction xv
Chapter 1 Introduction to Streaming Data 1
Sources of Streaming Data 2
Operational Monitoring 3
Web Analytics 3
Online Advertising 4
Social Media 5
Mobile Data and the Internet of Things 5
Why Streaming Data Is Different 7
Always On, Always Flowing 7
Loosely Structured 8
High-Cardinality Storage 9
Infrastructures and Algorithms 10
Conclusion 10
Part I Streaming Analytics Architecture 13
Chapter 2 Designing Real-Time Streaming Architectures 15
Real-Time Architecture Components 16
Collection 16
Data Flow 17
Processing 19 Storage 20 Delivery 22
Features of a Real-Time Architecture 24
High Availability 24
Low Latency 25
Languages for Real-Time Programming 27
Java 27
Scala and Clojure 28
JavaScript 29
The Go Language 30
A Real-Time Architecture Checklist 30
Collection 31
Data Flow 31
Processing 32 Storage 32 Delivery 33
Conclusion 34
Chapter 3 Service Confi guration and Coordination 35 Motivation for Confi guration and Coordination Systems 36
Maintaining Distributed State 36
Unreliable Network Connections 36
Clock Synchronization 37
Consensus in an Unreliable World 38
Apache ZooKeeper 39
The znode 39
Watches and Notifi cations 41
Maintaining Consistency 41
Creating a ZooKeeper Cluster 42 ZooKeeper’s Native Java Client 47
The Curator Client 56
Curator Recipes 63
Conclusion 70
Chapter 4 Data-Flow Management in Streaming Analysis 71
Distributed Data Flows 72
At Least Once Delivery 72
The “n+1” Problem 73
Apache Kafka: High-Throughput Distributed Messaging 74
Design and Implementation 74
Confi guring a Kafka Environment 80 Interacting with Kafka Brokers 89
Apache Flume: Distributed Log Collection 92
The Flume Agent 92
Confi guring the Agent 94
The Flume Data Model 95
Channel Selectors 95
Flume Sources 98
Flume Sinks 107
Sink Processors 110
Flume Interceptors 112 Integrating Custom Flume Components 114
Running Flume Agents 114
Conclusion 115
Chapter 5 Processing Streaming Data 117
Distributed Streaming Data Processing 118
Coordination 118
Partitions and Merges 119
Transactions 119
Processing Data with Storm 119
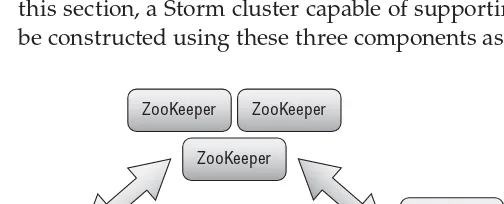
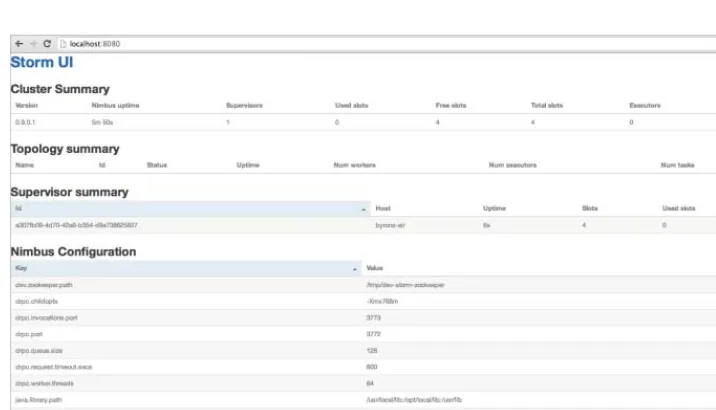
Components of a Storm Cluster 120 Confi guring a Storm Cluster 122
Distributed Clusters 123
Local Clusters 126
Storm Topologies 127
Implementing Bolts 130
Implementing and Using Spouts 136 Distributed Remote Procedure Calls 142
Trident: The Storm DSL 144
Processing Data with Samza 151
Apache YARN 151
Getting Started with YARN and Samza 153 Integrating Samza into the Data Flow 157
Samza Jobs 157
Conclusion 166
Chapter 6 Storing Streaming Data 167
Consistent Hashing 168
“NoSQL” Storage Systems 169
Redis 170 MongoDB 180 Cassandra 203
Other Storage Technologies 215
Relational Databases 215
Distributed In-Memory Data Grids 215
Choosing a Technology 215
Key-Value Stores 216
Document Stores 216
Distributed Hash Table Stores 216
In-Memory Grids 217
Relational Databases 217
Warehousing 217
Hadoop as ETL and Warehouse 218
Lambda Architectures 223
Part II Analysis and Visualization 225
Chapter 7 Delivering Streaming Metrics 227
Streaming Web Applications 228
Working with Node 229
Managing a Node Project with NPM 231 Developing Node Web Applications 235 A Basic Streaming Dashboard 238 Adding Streaming to Web Applications 242
Visualizing Data 254
HTML5 Canvas and Inline SVG 254 Data-Driven Documents: D3.js 262
High-Level Tools 272
Mobile Streaming Applications 277
Conclusion 279
Chapter 8 Exact Aggregation and Delivery 281
Timed Counting and Summation 285
Counting in Bolts 286
Counting with Trident 288
Counting in Samza 289
Multi-Resolution Time-Series Aggregation 290
Quantization Framework 290
Stochastic Optimization 296
Delivering Time-Series Data 297
Strip Charts with D3.js 298
High-Speed Canvas Charts 299
Horizon Charts 301
Conclusion 303
Chapter 9 Statistical Approximation of Streaming Data 305
Numerical Libraries 306
Probabilities and Distributions 307
Expectation and Variance 309
Statistical Distributions 310
Discrete Distributions 310
Continuous Distributions 312
Joint Distributions 315
Working with Distributions 316
Inferring Parameters 316
The Delta Method 317
Distribution Inequalities 319
Random Number Generation 319
Sampling Procedures 324
Sampling from a Fixed Population 325 Sampling from a Streaming Population 326 Biased Streaming Sampling 327
Conclusion 329
Chapter 10 Approximating Streaming Data with Sketching 331
Registers and Hash Functions 332
Registers 332
Hash Functions 332
Working with Sets 336
The Bloom Filter 338
The Algorithm 338
Choosing a Filter Size 340
Unions and Intersections 341
Cardinality Estimation 342
Interesting Variations 344
Distinct Value Sketches 347
The Min-Count Algorithm 348
The HyperLogLog Algorithm 351
The Count-Min Sketch 356
Point Queries 356
Count-Min Sketch Implementation 357 Top-K and “Heavy Hitters” 358 Range and Quantile Queries 360
Other Applications 364
Conclusion 364
Chapter 11 Beyond Aggregation 367
Models for Real-Time Data 368
Simple Time-Series Models 369
Linear Models 373
Logistic Regression 378
Neural Network Models 380
Forecasting with Models 389
Exponential Smoothing Methods 390
Regression Methods 393
Neural Network Methods 394
Monitoring 396
Outlier Detection 397
Change Detection 399
Real-Time Optimization 400
Conclusion 402
Overview and Organization of This Book
Dealing with streaming data involves a lot of moving parts and drawing from many different aspects of software development and engineering. On the one hand, streaming data requires a resilient infrastructure that can move data quickly and easily. On the other, the need to have processing “keep up” with data collection and scale to accommodate larger and larger data streams imposes some restrictions that favor the use of certain types of exotic data structures. Finally, once the data has been collected and processed, what do you do with it? There are several immediate applications that most organizations have and more are being considered all the time.This book tries to bring together all of these aspects of streaming data in a way that can serve as an introduction to a broad audience while still providing some use to more advanced readers. The hope is that the reader of this book would feel confi dent taking a proof-of-concept streaming data project in their organization from start to fi nish with the intent to release it into a production environment. Since that requires the implementation of both infrastructure and algorithms, this book is divided into two distinct parts.
To begin, the concepts and features underlying a streaming framework are introduced. This includes the various components of the system. Although not all projects will use all components at fi rst, they are eventually present in all mature streaming infrastructures. These components are then discussed in the context of the key features of a streaming architecture: availability, scalability, and latency.
The remainder of Part I focuses on the nuts and bolts of implementing or confi guring each component. The widespread availability of frameworks for each component has mostly removed the need to write code to implement each component. Instead, it is a matter of installation, confi guration, and, possibly, customization.
Chapters 3 and 4 introduce the tool needed to construct and coordinate a data motion system. Depending on the environment, software might be developed to integrate directly with this system or existing software adapted to the system. Both are discussed with their relevant pros and cons.
Once the data is moving, the data must be processed and, eventually stored. This is covered in Chapters 5 and Chapter 6. These two chapters introduce popular streaming processing software and options for storing the data.
Part II of the book focuses on on the application of this infrastructure to various problems. The dashboard and alerting system formed the original application of streaming data collection and are the fi rst application covered in Part II.
Chapter 7 covers the delivery of data from the streaming environment to the end user. This is the core mechanism used in the construction of dashboards and other monitoring applications. Once delivered, the data must be presented to the user, and this chapter also includes a section on building dashboard visualizations in a web-based setting.
Of course, the data to be delivered must often be aggregated by the processing system. Chapter 8 covers the aggregation of data for the streaming environment. In particular, it covers the aggregation of multi-resolution time-series data for the eventual delivery to the dashboards discussed in Chapter 7.
After aggregating the data, questions begin to arise about patterns in the data. Is there a trend over time? Is this behavior truly different than previously observed behavior? To answer these questions, you need some knowledge of statistics and the behavior of random processes (which generally includes any-thing with large scale data collection). Chapter 9 provides a brief introduction to the basics of statistics and probability. Along with this introduction comes the concept of statistical sampling, which can be used to compute more complicated metrics than simple aggregates.
Chapter 10, making heavy use of the introduction to probability in Chapter 9. These data structures also generally have fast updates and low memory foot-prints, making them especially useful in streaming settings.
Finally, Chapter 11 discusses some further topics beyond aggregation that can be applied to streaming data. A number of topics are covered in this chapter, providing an introduction to topics that often fi ll entire books on their own. The fi rst topic is models for streaming data taken from both the statistics and machine learning community. These models provide the basis for a number of applications, such as forecasting. In forecasting, the model is used to provide an estimate of future values. Since the data is streaming, these predictions can be compared to the reality and used to further refi ne the models. Forecasting has a number of uses, such as anomaly detection, which are also discussed in Chapter 11.
Chapter 11 also briefl y touches on the topic of optimization and A/B testing. If you can forecast the expected response of, for example, two different website designs, it makes sense to use that information to show the design with the bet-ter response. Of course, forecasts aren’t perfect and could provide bad estimates for the performance of each design. The only way to improve a forecast for a particular design is to gather more data. Then you need to determine how often each design should be shown such that the forecast can be improved without sacrifi cing performance due to showing a less popular design. Chapter 11 provides a simple mechanism called the multi-armed bandit that is often used to solve exactly these problems. This offers a jumping off point for further explorations of the optimization problem.
Who Should Read This Book
Similarly, people more focused on the operational and infrastructural pieces likely already know quite a bit about the topics discussed in Chapters 1 through 6. They may not have dealt with the specifi c software, but they have certainly tackled many of the same problems. The second part of the book, Chapters 7 through 11, is likely to be more interesting to them. Systems monitoring was one of the fi rst applications of streaming data, and tools like anamoly detection can, for example, be put to good use in developing robust fault detection mechanisms.
Tools You Will Need
Like it or not, large swaths of the data infrastructure world are built on the Java Virtual Machine. There are a variety of reasons for this, but ultimately it is a required tool for this book. The software and examples used in this book were developed against Java 7, though it should generally work against Java 6 or Java 8. Readers should ensure that an appropriate Java Development Kit is installed on their systems.
Since Java is used, it is useful to have an editor installed. The software in this book was written using Eclipse, and the projects are also structured using the Maven build system. Installing both of these will help to build the examples included in this book.
Other packages are also used throughout the book, and their installation is covered in their appropriate chapters.
This book uses some basic mathematic terms and formulas. If your math skills are rusty and you fi nd these concepts a little challenging, a helpful resource is
A First Course in Probability by Sheldon Ross.
What’s on the Website
The website includes code packages for all of the examples included in each chapter. The code for each chapter is divided into separate modules.
Some code is used in multiple chapters. In this case, the code is copied to each module so that they are self-contained.
Time to Dive In
It’s now time to dive into the actual building of a streaming data system. This is not the only way of doing it, but it’s the one I have arrived at after several different attempts over more years than I really care to think about it. I think it works pretty well, but there are always new things on the horizon. It’s an exciting time. I hope this book will help you avoid at least some of the mistakes I have made along the way.
It seems like the world moves at a faster pace every day. People and places become more connected, and people and organizations try to react at an ever-increasing pace. Reaching the limits of a human’s ability to respond, tools are built to process the vast amounts of data available to decision makers, analyze it, present it, and, in some cases, respond to events as they happen.
The collection and processing of this data has a number of application areas, some of which are discussed in the next section. These applications, which are discussed later in this chapter, require an infrastructure and method of analysis specifi c to streaming data. Fortunately, like batch processing before it, the state of the art of streaming infrastructure is focused on using commodity hardware and software to build its systems rather than the specialized systems required for real-time analysis prior to the Internet era. This, combined with fl exible cloud-based environment, puts the implementation of a real-time system within the reach of nearly any organization. These commodity systems allow organizations to analyze their data in real time and scale that infrastructure to meet future needs as the organization grows and changes over time.
The goal of this book is to allow a fairly broad range of potential users and implementers in an organization to gain comfort with the complete stack of applications. When real-time projects reach a certain point, they should be agile and adaptable systems that can be easily modifi ed, which requires that the users have a fair understanding of the stack as a whole in addition to their
1
own areas of focus. “Real time” applies as much to the development of new analyses as it does to the data itself. Any number of well-meaning projects have failed because they took so long to implement that the people who requested the project have either moved on to other things or simply forgotten why they wanted the data in the fi rst place. By making the projects agile and incremental, this can be avoided as much as possible.
This chapter is divided into sections that cover three topics. The fi rst section, “Sources of Streaming Data,” is some of the common sources and applications of streaming data. They are arranged more or less chronologically and provide some background on the origin of streaming data infrastructures. Although this is historically interesting, many of the tools and frameworks presented were developed to solve problems in these spaces, and their design refl ects some of the challenges unique to the space in which they were born. Kafka, a data motion tool covered in Chapter 4, “Flow Management for Streaming Analysis,” for example, was developed as a web applications tool, whereas Storm, a processing framework covered in Chapter 5, “Processing Streaming Data,” was developed primarily at Twitter for handling social media data.
The second section, “Why Streaming Data is Different,” covers three of the important aspects of streaming data: continuous data delivery, loosely struc-tured data, and high-cardinality datasets. The fi rst, of course, defi nes a system to be a real-time streaming data environment in the fi rst place. The other two, though not entirely unique, present a unique challenge to the designer of a streaming data application. All three combine to form the essential streaming data environment.
The third section, “Infrastructures and Algorithms,” briefl y touches on the signifi cance of how infrastructures and algorithms are used with streaming data.
Sources of Streaming Data
There are a variety of sources of streaming data. This section introduces some of the major categories of data. Although there are always more and more data sources being made available, as well as many proprietary data sources, the categories discussed in this section are some of the application areas that have made streaming data interesting. The ordering of the application areas is pri-marily chronological, and much of the software discussed in this book derives from solving problems in each of these specifi c application areas.
in Chapter 11. Google seems to be especially interested in a technique called deep learning, which makes use of very large-scale neural networks to learn complicated patterns.
These systems are even enabling entirely new areas of data collection and analysis by making the Internet of Things and other highly distributed data collection efforts economically feasible. It is hoped that outlining some of the previous application areas provides some inspiration for as-of-yet-unforeseen applications of these technologies.
Operational Monitoring
Operational monitoring of physical systems was the original application of streaming data. Originally, this would have been implemented using special-ized hardware and software (or even analog and mechanical systems in the pre-computer era). The most common use case today of operational monitoring is tracking the performance of the physical systems that power the Internet.
These datacenters house thousands—possibly even tens of thousands—of discrete computer systems. All of these systems continuously record data about their physical state from the temperature of the processor, to the speed of the fan and the voltage draw of their power supplies. They also record information about the state of their disk drives and fundamental metrics of their operation, such as processor load, network activity, and storage access times.
To make the monitoring of all of these systems possible and to identify prob-lems, this data is collected and aggregated in real time through a variety of mechanisms. The fi rst systems tended to be specialized ad hoc mechanisms, but when these sorts of techniques started applying to other areas, they started using the same collection systems as other data collection mechanisms.
Web Analytics
The introduction of the commercial web, through e-commerce and online advertising, led to the need to track activity on a website. Like the circulation numbers of a newspaper, the number of unique visitors who see a website in a day is important information. For e-commerce sites, the data is less about the number of visitors as it is the various products they browse and the correlations between them.
best prescription—two choices are pitted against each other to determine which is best. These tests were mostly conducted sequentially, but this has a number of problems, not the least of which is the amount of time needed to conduct the study.
As more and more organizations mined their website data, the need to reduce the time in the feedback loop and to collect data on a more continual basis became more important. Using the tools of the system-monitoring community, it became possible to also collect this data in real time and perform things like A/B tests in parallel rather than in sequence. As the number of dimensions being measured and the need for appropriate auditing (due to the metrics being used for billing) increased, the analytics community developed much of the streaming infrastructure found in this book to safely move data from their web servers spread around the world to processing and billing systems.
This sort of data still accounts for a vast source of information from a variety of sources, although it is usually contained within an organization rather than made publicly available. Applications range from simple aggregation for billing to the real-time optimization of product recommendations based on current browsing history (or viewing history, in the case of a company like Netfl ix).
Online Advertising
A major user and generator of real-time data is online advertising. The original forms of online advertising were similar to their print counterparts with “buys” set up months in advance. With the rise of the advertising exchange and real-time bidding infrastructure, the advertising market has become much more fl uid for a large and growing portion of traffi c.
For these applications, the money being spent in different environments and on different sites is being managed on a per-minute basis in much the same way as the stock market. In addition, these buys are often being managed to some sort of metric, such as the number of purchases (called a conversion) or even the simpler metric of the number of clicks on an ad. When a visitor arrives at a website via a modern advertising exchange, a call is made to a number of bidding agencies (perhaps 30 or 40 at a time), who place bids on the page view in real time. An auction is run, and the advertisement from the winning party is displayed. This usually happens while the rest of the page is loading; the elapsed time is less than about 100 milliseconds. If the page contains several advertisements, as many of them do, an auction is often being run for all of them, sometimes on several different exchanges.
other risk management activities, such as throttling the access to impressions to various parties.
Advertisers, publishers, and bidding agents on both sides of the exchange are also collecting the data in real time. Their goal is the management and optimi-zation of the campaigns they are currently running. From selecting the bid (in the case of the advertiser) or the “reserve” price (in the case of the publisher), to deciding which exchange offers the best prices for a particular type of traffi c, the data is all being managed on a moment-to-moment basis.
A good-sized advertising campaign or a large website could easily see page views in the tens or hundreds of millions. Including other events such as clicks and conversions could easily double that. A bidding agent is usually acting on the part of many different advertisers or publishers at once and will often be collecting on the order of hundreds of millions to billions of events per day. Even a medium-sized exchange, sitting as a central party, can have billions of events per day. All of this data is being collected, moved, analyzed, and stored as it happens.
Social Media
Another newer source of massive collections of data are social media sources, especially public ones such as Twitter. As of the middle of 2013, Twitter reported that it collected around 500 million tweets per day with spikes up to around 150,000 tweets per second. That number has surely grown since then.
This data is collected and disseminated in real time, making it an important source of information for news outlets and other consumers around the world. In 2011, Twitter users in New York City received information about an earth-quake outside of Washington, D.C. about 30 seconds before the tremors struck New York itself.
Combined with other sources like Facebook, Foursquare, and upcoming communications platforms, this data is extremely large and varied. The data from applications like web analytics and online advertising, although highly dimensional, are usually fairly well structured. The dimensions, such as money spent or physical location, are fairly well understood quantitative values.
In social media, however, the data is usually highly unstructured, at least as data analysts understand the term. It is usually some form of “natural language” data that must be parsed, processed, and somehow understood by automated systems. This makes social media data incredibly rich, but incredibly challeng-ing for the real-time data sources to process.
Mobile Data and the Internet of Things
available for at least a decade, and devices like Blackberries had put data in the hands of business users, but these devices were still essentially specialist tools and were managed as such.
The iPhone, Android phones, and other smartphones that followed made cellular data a consumer technology with the accompanying economies of scale that goes hand in hand with a massive increase in user base. It also put a general-purpose computer in the pocket of a large population. Smartphones have the ability not only to report back to an online service, but also to communicate with other nearby objects using technologies like Bluetooth LE.
Technologies like so-called “wearables,” which make it possible to measure the physical world the same way the virtual world has been measured for the last two decades, have taken advantage of this new infrastructure. The applica-tions range from the silly to the useful to the creepy. For example, a wristband that measures sleep activity could trigger an automated coffee maker when the user gets a poor night’s sleep and needs to be alert the next day. The smell of coffee brewing could even be used as an alarm. The communication between these systems no longer needs to be direct or specialized, as envisioned in the various “smart home” demonstration projects during the past 50 years. These tools are possible today using tools like If This Then That (IFTTT) and other publicly available systems built on infrastructure similar to those in this book. On a more serious note, important biometric data can be measured in real time by remote facilities in a way that has previously been available only when using highly specialized and expensive equipment, which has limited its appli-cation to high-stress environments like space exploration. Now this data can be collected for an individual over a long period of time (this is known in statis-tics as longitudinal data) and pooled with other users’ data to provide a more complete picture of human biometric norms. Instead of taking a blood pressure test once a year in a cold room wearing a paper dress, a person’s blood pressure might be tracked over time with the goal of “heading off problems at the pass.” Outside of health, there has long been the idea of “smart dust”—large collec-tions of inexpensive sensors that can be distributed into an area of the world and remotely queried to collect interesting data. The limitation of these devices has largely been the expense required to manufacture relatively specialized pieces of equipment. This has been solved by the commodifi cation of data collection hardware and software (such as the smartphone) and is now known as the Internet of Things. Not only will people continually monitor themselves, objects will continually monitor themselves as well. This has a variety of potential applications, such as traffi c management within cities to making agriculture more effi cient through better monitoring of soil conditions.
the data is already available. All that remains to be developed are the novel applications for collecting the data.
Why Streaming Data Is Diff erent
There are a number of aspects to streaming data that set it apart from other kinds of data. The three most important, covered in this section, are the “always-on” nature of the data, the loose and changing data structure, and the challenges presented by high-cardinality dimensions. All three play a major role in decisions made in the design and implementation of the various streaming frameworks presented in this book. These features of streaming data particularly infl uence the data processing frameworks presented in Chapter 5. They are also refl ected in the design decisions of the data motion tools, which consciously choose not to impose a data format on information passing through their system to allow maximum fl exibility. The remainder of this section covers each of these in more depth to provide some context before diving into Chapter 2, which covers the components and requirements of a streaming architecture.
Always On, Always Flowing
This fi rst is somewhat obvious: streaming data streams. The data is always available and new data is always being generated. This has a few effects on the design of any collection and analysis system. First, the collection itself needs to be very robust. Downtime for the primary collection system means that data is permanently lost. This is an important thing to remember when designing an edge collector, and it is discussed in more detail in Chapter 2.
Second, the fact that the data is always fl owing means that the system needs to be able to keep up with the data. If 2 minutes are required to process 1 minute of data, the system will not be real time for very long. Eventually, the problem will be so bad that some data will have to be dropped to allow the system to catch up. In practice it is not enough to have a system that can merely “keep up” with data in real time. It needs to be able to process data far more quickly than real time. For reasons that are either intentional, such as a planned downtime, or due to catastrophic failures, such as network outages, the system either whole or in part will go down.
implement auto-scaling. In this setting, as the delay increases, more process-ing power is temporarily added to brprocess-ing the delay back into acceptable limits. On the algorithmic side, this always-fl owing feature of streaming data is a bit of a double-edged sword. On the positive side, there is rarely a situation where there is not enough data. If more data is required for an analysis, simply wait for enough data to become available. It may require a long wait, but other analyses can be conducted in the meantime that can provide early indicators of how the later analysis might proceed.
On the downside, much of the statistical tooling that has been developed over the last 80 or so years is focused on the discrete experiment. Many of the standard approaches to analysis are not necessarily well suited to the data when it is streaming. For example, the concept of “statistical signifi cance” becomes an odd sort of concept when used in a streaming context. Many see it as some sort of “stopping rule” for collecting data, but it does not actually work like that. The p-value statistic used to make the signifi cance call is itself a random value and may dip below the critical value (usually 0.05) even though, when the next value is observed, it would result in a p-value above 0.05.
This does not mean that statistical techniques cannot and should not be used—quite the opposite. They still represent the best tools available for the analysis of noisy data. It is simply that care should be taken when performing the analysis as the prevailing dogma is mostly focused on discrete experiments.
Loosely Structured
Streaming data is often loosely structured compared to many other datasets. There are several reasons this happens, and although this loose structure is not unique to streaming data, it seems to be more common in the streaming settings than in other situations.
Part of the reason seems to be the type of data that is interesting in the stream-ing settstream-ing. Streamstream-ing data comes from a variety of sources. Although some of these sources are rigidly structured, many of them are carrying an arbitrary data payload. Social media streams, in particular, will be carrying data about everything from world events to the best slice of pizza to be found in Brooklyn on a Sunday night. To make things more diffi cult, the data is encoded as human language.
The general paradigm is to collect as much data as possible in the event that it is actually interesting.
Finally, the real-time nature of the data collection also means that various dimensions may or may not be available at any given time. For example, a ser-vice that converts IP addresses to a geographical location may be temporarily unavailable. For a batch system this does not present a problem; the analysis can always be redone later when the service is once more available. The streaming system, on the other hand, must be able to deal with changes in the available dimensions and do the best it can.
High-Cardinality Storage
Cardinality refers to the number of unique values a piece of data can take on. Formally, cardinality refers to the size of a set and can be applied to the various dimensions of a dataset as well as the entire dataset itself. This high cardinality often manifests itself in a “long tail” feature of the data. For a given dimension (or combination of dimensions) there is a small set of different states that are quite common, usually accounting for the majority of the observed data, and then a “long tail” of other data states that comprise a fairly small fraction.
This feature is common to both streaming and batch systems, but it is much harder to deal with high cardinality in the streaming setting. In the batch set-ting it is usually possible to perform multiple passes over the dataset. A fi rst pass over the data is often used to identify dimensions with high cardinality and compute the states that make up most of the data. These common states can be treated individually, and the remaining state is combined into a single “other” state that can usually be ignored.
In the streaming setting, the data can usually be processed a single time. If the common cases are known ahead of time, this can be included in the pro-cessing step. The long tail can also be combined into the “other” state, and the analysis can proceed as it does in the batch case. If a batch study has already been performed on an earlier dataset, it can be used to inform the streaming analysis. However, it is often not known if the common states for the current data will be the common states for future data. In fact, changes in the mix of states might actually be the metric of interest. More commonly, there is no previous data to perform an analysis upon. In this case, the streaming system must attempt to deal with the data at its natural cardinality.
space is much more restricted than in the batch setting because it must generally use very fast main memory storage instead of the much slower tertiary storage of hard drives. This has been relaxed somewhat with the introduction of high-performance Solid State Drives (SSDs), but they are still orders of magnitude slower than memory access.
As a result, a major topic of research in streaming data is how to deal with high-cardinality data. This book discusses some of the approaches to dealing with the problem. As an active area of research, more solutions are being devel-oped and improved every day.
Infrastructures and Algorithms
The intent of this book is to provide the reader with the ability to implement a streaming data project from start to fi nish. An algorithm without an infra-structure is, perhaps, an interesting research paper, but not a fi nished system. An infrastructure without an application is mostly just a waste of resources.
The approach of “build it and they will come” really isn’t going to work if you focus solely on an algorithm or an infrastructure. Instead, a tangible system must be built implementing both the algorithm and the infrastructure required to support it. With an example in place, other people will be able to see how the pieces fi t together and add their own areas of interest to the infrastructure. One important thing to remember when building the infrastructure (and it bears repeating) is that the goal is to make the infrastructure and algorithms accessible to a variety of users in an organization (or the world). A successful project is one that people use, enhance, and extend.
Conclusion
Ultimately, the rise of web-scale data collection has been about connecting “sensor platforms” for a real-time processing framework. Initially, these sensor platforms were entirely virtual things such as system monitoring agents or the connections between websites and a processing framework for the purposes of advertising. With the rise of ubiquitous Internet connectivity, this has trans-ferred to the physical world to allow collection of data across a wide range of industries at massive scale.
I
Streaming Analytics Architecture
In This Part
Chapter 2: Designing Real-Time Streaming Architectures Chapter 3: Service Confi guration and Coordination Chapter 4: Data Flow Management in Streaming Analysis Chapter 5: Processing Streaming Data
By their nature, real-time architectures are layer ed systems that rely on several loosely coupled systems to achieve their goals. There are a variety of reasons for this structure, from maintaining the high availability of the system in an unreliable world to service requirements and managing the cost structure of the architecture itself.
The remainder of the fi rst section of this book introduces software, frameworks and methods for dealing with the various elements of these architectures. This chapter serves as the blueprint and foundation for the architecture. First, the various components of the architecture are introduced. These usually, but not always, correspond to separate machine instances (physical or virtual). After these components have been introduced, they can be discussed in the context of the primary features of a real-time architecture: high availability, low latency, and horizontal scalability.
This chapter also spends some time discussing the languages used to build real-time architectures. It is assumed that the reader will have some familiarity with the languages used for the examples in this book: Java and JavaScript. Many of the software packages in this book are implemented using the Java Virtual Machine, though not necessarily Java itself. JavaScript, of course, is the lingua franca of the web and is used extensively in the later sections of this book to implement the interfaces to the data.
2
Finally, this chapter offers some advice to someone planning a streaming architecture pilot project. Many of the software packages in this book can be considered interchangeable in the sense that they can all be made to function in any environment, but they all have their strengths and weaknesses. Based on real-world experience, this naturally means that some packages are easier to use in some environments than others. The fi nal section of this chapter pro-vides some insight into solutions that have worked in the past and can serve as a starting point for the future.
Real-Time Architecture Components
This section describes the components often found in a modern real-time archi-tecture. Not every system will have every component, especially at fi rst. The goal should be to build a system appropriate to an initial application, with the ability to expand to incorporate any missing components in the future.
After the fi rst application is established, other applications of the infrastruc-ture will inevitably follow with their own requirements. In fact, it is quite likely that some components will have multiple implementations. It happens most often in the storage component, where there is a wide range of performance characteristics among the different products available.
This section covers each of the components and some aspects of their devel-opment and future path. In general, the specifi cs of each component will be covered in more depth in their relevant chapters in the remainder of Part I.
Collection
The most common environment for real-time applications discussed in this book is handled over TCP/IP-based networks. As a result, the collection of data happens through connections over a TCP/IP network, probably using a common protocol such as HTTP. The most obvious example of this form of collection is a large latency-sensitive website that geo-distributes its servers (known as edge servers) to improve end-user latency.
With websites being one of the original use cases for large-scale data collec-tion, it is not surprising that the log formats used by web servers dominated the formatting of log fi les. Unfortunately, most web servers adhered to the National Center for Supercomputing Applications (NCSA) Common Log Format and the later World Wide Web Consortium (W3C) Extended Log File Format, which was never intended to support the rich data payloads (and does so poorly).
It is also relatively easy to parse, and libraries for it are widely available. It is used to transfer data between client-side web applications and the server side. JSON’s fl exibility also leads to a signifi cant downside: processing-time vali-dation. The lack of defi ned schemas and the tendency of different packages to produce structurally different, but semantically identical structures means that processing applications must often include large amounts of validation code to ensure that their inputs are reasonable. The fact that JSON essentially sends its schema along with every message also leads to data streams that require relatively large bandwidth. Compression of the data stream helps, often achieving compression rates well more than 80 percent, but this suggests that something could be done to improve things further.
If the data is well structured and the problem fairly well understood, one of the structured wire formats is a possibility. The two most popular are Thrift and Protocol Buffers (usually called Protobuf). Both formats, the former developed at Facebook and the latter at Google, are very similar in their design (not sur-prising given that they also share developers). They use an Interface Defi nition Language (IDL) to describe a data structure that is translated into code that is usable in a variety of output languages. This code is used to encode and decode messages coming over the wire. Both formats provide a mechanism to extend the original message so that new information can be added.
Another, less popular option is the Apache Avro format. In concept it is quite similar to Protocol Buffers or Thrift. Schemas are defi ned using an IDL, which happens to be JSON, much like Thrift or Protobuf. Rather than using code generation, Avro tends to use dynamic encoders and decoders, but the binary format is quite similar to Thrift. The big difference is that, in addition to the binary format, Avro can also read and write to a JSON representation of its schema. This allows for a transition path between an existing JSON represen-tation, whose informal schema can often be stated as an explicit Avro schema, and the more compact and well-defi ned binary representation.
For the bulk of applications, the collection process is directly integrated into the edge servers themselves. For new servers, this integrated collection mecha-nism likely communicates directly with the data-fl ow mechamecha-nisms described in the next section. Older servers may or may not integrate directly with the data-fl ow mechanism, with options available for both. These servers are usually application specifi c, so this book does not spend much time on this part of the environment except to describe the mechanisms for writing directly to the data-fl ow component.
Data Flow
remains stable, but depth of analysis grows, then the analysis infrastructure needs more resources despite the fact that the amount of data collected stays the same. To allow for this, the infrastructure is separated into tiers of collection, processing, and so on. Many times, the communication between these tiers is conducted on an ad hoc basis, with each application in the environment using its own communication method to integrate with its other tiers.
One of the aims of a real-time architecture is to unify the environment, at least to some extent, to allow for the more modular construction of applications and their analysis. A key part of this is the data-fl ow system (also called a data motion system in this book).
These systems replace the ad hoc, application-specifi c, communication frame-work with a single, unifi ed software system. The replacement software systems are usually distributed systems, allowing them to expand and handle complicated situations such as multi-datacenter deployment, but they expose a common interface to both producers and consumers of the data.
The systems discussed in this book are primarily what might be considered third-generation systems. The “zero-th generation” systems are the closely coupled ad hoc communication systems used to separate applications into application-specifi c tiers.
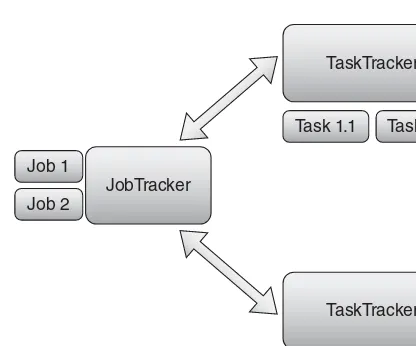
The fi rst generation systems break this coupling, usually using some sort of log-fi le system to collect application-specifi c data into fi les. These fi les are then generically collected to a central processing location. Custom processors then consume these fi les to implement the other tiers. This has been, by far, the most popular system because it can be made reliable by implementing “at least once” delivery semantics and because it’s fast enough for batch processing applications. The original Hadoop environments were essentially optimized for this use case.
The primary drawback of the log-based systems is that they are fairly slow. Data must be collected in a batch form when a log fi le is “rolled” and processed en masse. Second-generation data-fl ow systems recognized that reliable trans-port was not always a priority and began to implement remote procedure call (RPC) systems for moving data between systems. Although they may have some buffering to improve reliability, the second-generation systems, such as Scribe and Avro, generally accept that speed is acquired at the expense of reli-ability. For many applications this tradeoff is wholly acceptable and has been made for decades in systems-monitoring software such as Syslog, which uses a similar model.
However, these environments also implement an intermediate storage layer that allows them to make the same “at least once” delivery guarantees of log-based delivery systems. To maintain the requisite performance, this storage layer is horizontally scaled across several different physical systems with coordina-tion handled by the client software on both the producer and consumer sides of the system.
The fi rst of these systems were queuing systems designed to handle large data loads; ActiveMQ is an example. By providing a queuing paradigm, the queuing systems allow for the development of message “busses” that loosely coupled different components of the architecture and free developers from the communication task. The drawback of queuing systems has been the desire to maintain queue semantics where the order of delivery to consumers is matched to the order of submission. Generally, this behavior is unnecessary in distributed systems and, if needed, usually better handled by the client software.
Recognition of the fact that queuing semantics are mostly unneeded has led the latest entrants in the third-generation of data-fl ow systems, Kafka and Flume, to largely abandon the ordering semantics while still maintaining the distributed system and reliability guarantees. This has allowed them to boost performance for nearly all applications. Kafka is also notable in that it was explicitly designed to handle data fl ow in a large multi-datacenter installation.
Processing
Map-Reduce processing (Hadoop being the most popular open source version) became popular not because it was a game-changing paradigm. After all, the Hollerith tabulation machines used for the 1890 census used a tabulating mecha-nism very similar to the map-reduce procedure implemented by Hadoop and others.
N O T E Hollerith later founded the corporations that would eventually become IBM.
Map-reduce processing also did not introduce the idea of distributed com-putation and the importance of the comcom-putation being local to the data for performance. The high-performance and large-scale computing communities have long known that it is often more effi cient to move software close to the data, and there is no shortage of software available from that community for distributed computing.
units and move it around. The fi rst generation log collection systems made it possible to collect large amounts of data in a generic way. Map-reduce, Hadoop in particular, made it easy to distribute that processing so that it did not require application-specifi c code or expensive hardware and software solutions.
The same thing happened in the real-time space with the introduction of the second generation of data-fl ow frameworks. Data that had formerly been locked in log fi les became available in a low-latency setting. Like the original batch systems, the fi rst systems tended to have task-specifi c implementations. For example, Twitter’s Rainbird project implements a hierarchical streaming counting system using a database called Cassandra.
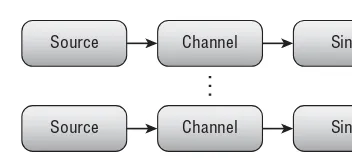
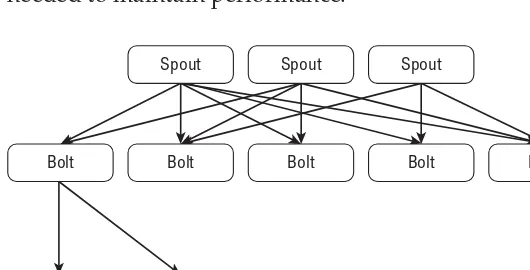
The current second-generation systems have moved beyond task-specifi c implementations into providing a general service for arranging streaming computation. These systems, such as Storm (also a Twitter project, but originally developed by a company called BackType) typically provide a directed acyclic graph (DAG) mechanism for arranging the computation and moving messages between different parts of the computation.
These frameworks, which are relatively young as software projects, are still often under heavy development. They also lack the guidance of well-understood computational paradigms, which means that they have to learn what works well and what does not as they go along. As their development progresses, there will probably be an erosion in the difference between batch-based systems and streaming systems. The map-reduce model is already gaining the ability to implement more complicated computation to support the demand for interac-tive querying as parts of projects like Cloudera’s Impala and the Stinger project being led by Hortonworks.
Storage
Storage options for real-time processing and analysis are plentiful—almost to the point of being overwhelming. Whereas traditional relational databases can and are used in streaming systems, the preference is generally for so-called “NoSQL” databases. This preference has a number of different drivers, but the largest has generally been the need to prioritize performance over the ACID (Atomicity, Consistency, Isolation, Durability) requirements met by the tradi-tional relatradi-tional database. Although these requirements are often met to some degree, a common feature of these databases is that they rarely support all the requirements.
The most common styles of NoSQL databases are the various forms of per-sistent key-value stores. They range from single-machine master-slave data stores, such as Redis, to fully distributed, eventually consistent, stores, such as Cassandra. Their fundamental data structure is the key with an arbitrary byte array value, but most have built some level of abstraction on the core entity. Some, such as Cassandra, even extend the abstraction to offering a SQL-like language that includes schemas and familiar-looking statements, although they don’t support many features of the language.
The NoSQL database world also includes a variety of hybrid data stores, such as MongoDB. Rather than being a key-value store, MongoDB is a form of indexed document store. In many ways it is closer to a search engine like Google than it is to a relational database. Like the key-value stores, it has a very limited query language. It does not have a schema; instead it uses an optimized JSON representation for documents that allow for rich structure. Unlike most of the key-value stores, it also offers abstractions for reference between documents.
Along with the simplifi cation of the query languages and maintenance of schemas comes a relaxation of the aforementioned ACID requirements. Atomicity and consistency, in particular, are often sacrifi ced in these data stores. By relax-ing the consistency constraint to one of “eventual consistency,” these stores gain some performance through reduced bookkeeping and a much simpler model for distributing themselves across a large number of machines that may be quite distant physically. In practice, for streaming applications, it is generally not necessary that each client have the same view of the data at the same time. The principal problem is when two physically separate copies of the database attempt to modify the same piece of state. Resolving this problem is tricky, but it is possible and is discussed in detail in Chapter 3, “Service Confi guration and Coordination.”
Relaxing the atomicity requirement also usually results in a performance gain for the data store, and maximum performance is the ultimate goal of all of these data stores. Most of them maintain atomicity in some lightweight way, usually the special case of counter types. Maintaining atomic counters, as it happens, is not too diffi cult and also happens to be a common use case, leading most data stores to implement some form of counter.
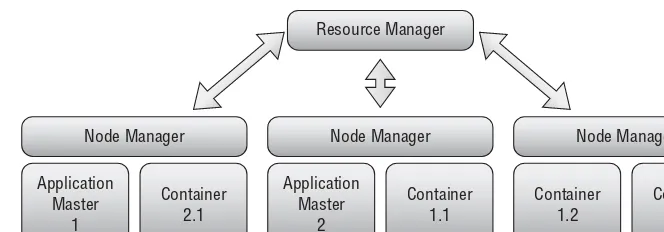
The acceptance that practical realities require that data be stored in different stores extends to integration with batch processing. Streaming architectures are well suited to tasks that can accept some error in their results. Depending on the calculations required, this error might even be intentional as discussed in Chapter 9, “Statistical Approximation of Streaming Data,” and Chapter 10, “Approximating Streaming Data with Sketching.” However, it is often the case that the data calculated must eventually be resolved and audited, which is a task much better suited to batch computation. Ideally, the streaming architecture makes the data available quickly and then is replaced by data from the batch system as it becomes available. Nathan Marz, the primary creator of Storm, coined the term for this: Lambda Architecture. In the Lambda Architecture system, the user interface or another piece of middleware is responsible for retrieving the appropriate data from the appropriate store. As the convergence of the batch and real-time systems continues, through infrastructure improvements like the Apache YARN project, this should become the common case.
Delivery
The delivery mechanism for most real-time applications is some sort of web-based interface. They have a lot of advantages. They are relatively easy to implement and are lightweight to deploy in situ. There are dozens of frameworks available to aid the process.
Originally, these dashboards were websites with a refresh META tag that would reload a static representation of the process every few minutes. Many of the systems-monitoring tools, such as Graphite, still work that way. This works well enough for applications whose data is usually fairly slow to change. It also works well when a variety of environments need to be supported, as the technology is nearly as old as the web itself.
Web Communication Methods
Modern applications have a number of other options for delivering data to a web browser for display. A slightly faster version of the refreshing web page is to use the XMLHttpRequest (XHR) feature of most web browsers to load the data into the browser rather than an image of the data. This collection of technologies is also known by the name AJAX, which stands for “Asynchronous JavaScript and XML.” It offers some improvements over the old model by separating the data layer and the presentational layer. This allows the application to tailor rendering of the data to the environment as well as usually reducing the size of the data transferred.
which limits how quickly new information can be delivered to the front end. If events are relatively rare, such as with a notifi cation system, a large number of calls are also wasted to ensure that “no news is good news.” As the need for more real-time communication has grown, a number of “hacks” have been developed to make interactions between the browser and the server seem more immediate, by using techniques such as long polling. Collectively known as Comet, these methods now include true streaming to the browser, allowing for the implementation of truly real-time interfaces.
There are two standards currently in use: Server Sent Events (SSE) and Web Sockets. SSE implements an HTTP-compatible protocol for unidirectional stream-ing data from the server to the client. This is ideal for applications, such as a dashboard, which mostly take in data. Communication in the other direction is handled by normal AJAX calls. Web Sockets, on the other hand, implements a more complex protocol designed by bidirectional interaction between the client and the server. This protocol is not HTTP compatible, but it does have support from the three major desktop browsers (Internet Explorer, Chrome, and Firefox) as well as most of the mobile browsers. SSE are not available in Internet Explorer, but its HTTP compatibility means that it can fall back to polling for browsers that do not support the interface natively without extra server-side code.
Web-Rendering Methods
By sending the data to the client side, applications can also take advantage of the rendering components built into modern web browsers: Scalable Vector Graphics (SVG) and Canvas drawing. Other drawing technologies—such as Microsoft’s Vector Markup Language (VML), which was only supported by Internet Explorer, and the WebGL standard supported by Google’s Chrome browser—have also been available over the years. These technologies attempt to bring a standard for 3D rendering to the web browser.
Originally introduced as part of Apple’s Safari browser and subsequently included in the WHAT-WG proposal that serves as the basis for the HTML5 standard, the Canvas element also enjoys widespread support across browsers. The Canvas element provides a drawing surface rather than a Document Object Model for rendering an image. The drawing model itself is very similar to SVG because it also draws its inspiration from PostScript and PDF. However, it only maintains the actual pixels drawn rather than the objects used to render the pixels. This allows the canvas element to act more like the traditional HTML image element as well as conferring performance benefi ts relative to SVG in certain situations. In graphics circles, Canvas would be known as an “immedi-ate mode” implementation while SVG is a “retained mode” implementation.
Features of a Real-Time Architecture
All of the components of real-time systems discussed in the last section share three key features that allow them to operate in a real-time streaming environ-ment: high availability, low latency, and horizontal scalability. Without these features, the real-time system encounters fundamental limitations that prevent it from scaling properly. This section discusses what each of these features means in the context of real-time applications.
High Availability
The high-availability requirement for the entire system is probably the key difference between the real-time streaming application and the more common batch-processing or business-intelligence application. If these systems become unavailable for minutes or even hours, it is unlikely to affect operations. (Often, users of the system do not even notice.) Real-time systems, on the other hand, are sensitive to these sorts of outages and may even be sensitive to scheduled maintenance windows.
This may not extend to all parts of the stack, such as the delivery mechanism, but it is usually important for the collection, fl ow, and processing systems. To ensure high availability, most of the systems in this stack resort to two things: distribution and replication. Distribution means the use of multiple physical servers to distribute the load to multiple end points. If one of the machines in, say, the collection system, is lost, then the others can pick up the slack until it can be restored or replaced.
cause some subset of the data itself to become unavailable. To overcome this problem, most systems employ some form of replication.
The basic idea behind replication is that, rather than writing a piece of data to single-machine, a system writes to several machines in the hopes that at least one of them survives. Relational databases, for example, often implement replication that allows edits made to a master machine to be replicated to a number of slave machines with various guarantees about how many slaves, if any, must have the data before it is made available to clients reading from the database. If the master machine becomes unavailable for some reason, some databases can fail over to one of the slaves automatically, allowing it to become the master. This failover is usually permanent, promoting the new master on a permanent basis because the previous master will be missing interim edits when and if it is restored.
This same approach is also used in some of the software stacks presented in this book. The Kafka data motion system uses a master-slave style of replication to ensure that data written to its queues remains available even in the event of a failure. MongoDB, a data store, also uses a similar system for its replication implementation. In both cases, automatic failover is offered, although a client may need to disconnect and reconnect to successfully identify the new master. It is also the client’s responsibility to handle any in-fl ight edits that had not yet been acknowledged by the master.
The other approach, often found in NoSQL data stores, is to attempt a masterless form high availability. Like the master-slave confi guration, any edits are writ-ten to multiple servers in a distributed pool of machines. Typically, a machine is chosen as the “primary” write machine according to some feature of the data, such as the value of the primary key being written. The primary then writes the same value to a number of other machines in a manner that can be determined from the key value. In this way, the primary is always tried fi rst and, if unavailable, the other machines are tried in order for both writing and reading. This basic procedure is implemented by the Cassandra data store dis-cussed in this book. It is also common to have the client software implement this multiple writing mechanism, a technique commonly used in distributed hash tables to ensure high availability. The drawback of this approach is that, unlike the master-slave architecture, recovery of a server that has been out of service can be complicated.
Low Latency
For the real-time streaming application, low latency means something a bit different. Rather than referring to the return time for a single request, it refers to the amount of time between an event occurring somewhere at the “edge” of the system and it being made available to the processing and delivery frame-works. Although not explicitly stated, it also implies that the variation between the latency of various events is fairly stable.
For example, in a batch system operating on the order of minutes the latency of some events is very low, specifi cally, those events that entered the batch to be processed right before the processing started. Events that entered the batch just after the start of a processing cycle will have a very high latency because they need to wait for the next batch to be processed. For practical reasons, many streaming systems also work with what are effectively batches, but the batches are so small that the time difference between the fi rst and last element of the mini-batch is small, usually on the order of milliseconds, relative to the time scale of the phenomena being monitored or processed.
The collection components of the system are usually most concerned with the fi rst defi nition of low latency. The more connections that can be handled by a single server, the fewer servers are required to handle the load. More than one is usually required to