Technical Note
Novel Genetic Algorithm-Based Evolutionary Support
Vector Machine for Optimizing High-Performance
Concrete Mixture
Min-Yuan Cheng
1; Doddy Prayogo
2; and Yu-Wei Wu
3Abstract:An effective method for optimizing high-performance concrete mixtures can significantly benefit the construction industry. How-ever, traditional proportioning methods are not sufficient because of their expensive costs, limitations of use, and inability to address nonlinear relationships among components and concrete properties. Consequently, this research introduces a novel genetic algorithm (GA)–based evolutionary support vector machine (GA-ESIM), which combines the K-means and chaos genetic algorithm (KCGA) with the evolutionary support vector machine inference model (ESIM). This model benefits from both complex input-output mapping in ESIM and global solutions with faster convergence characteristics in KCGA. In total, 1,030 data points from concrete strength experiments are provided to demonstrate the application of GA-ESIM. According to the results, the newly developed model successfully produces the optimal mixture with minimal prediction errors. Furthermore, a graphical user interface is utilized to assist users in performing optimization tasks.DOI:10.1061/(ASCE) CP.1943-5487.0000347.© 2014 American Society of Civil Engineers.
Author keywords:High-performance concrete; Genetic algorithm; Evolutionary support vector machine; Graphic user interface.
Introduction
High-performance concrete (HPC) has gained popularity over the last decade, replacing the well-known high-strength concrete in the concrete construction industry (Yeh and Lien 2009). Unlike con-ventional concrete, HPC employs additional supplementary cemen-titious materials such as fly ash and blast furnace slag, and chemical admixtures such as superplasticizer (Yeh 1999). Therefore, mixture proportioning of HPC is more complicated because more materials are included. Traditional proportioning is not sufficient in HPC mix designs for several reasons: (1) it is a waste of cost, laborers, and time (Ji et al. 2006); (2) it is only applicable to a narrow range of locally available materials (Domone and Soutsos 1994); and (3) it is often unable to handle nonlinear relationships among components and concrete properties (Chou 2011). Researchers still need to find suitable methods for optimizing HPC mixtures.
Several studies have demonstrated that HPC mixtures can be optimized by using hybrid optimization and prediction techniques instead of implementing expensive and time-consuming experi-ments (Yeh 1999,2007,2009;Lim et al. 2004). First, because the relationship between the components and the strength of concrete is too complicated to be expressed by using mathematical equations, a prediction tool is employed to generate the relationship model. One
of the primary advantages of employing a prediction tool, such as artificial neural network (ANN) or support vector machine (SVM), is its ability to handle complex input-output mapping relationships. However, improper setting of parameters can reduce the prediction accuracy of these tools (Ko et al. 2007;Cheng and Wu 2009a).
An optimization technique searches for the optimum mixture solution based on the established model. Nevertheless, not all optimi-zation techniques are sufficiently robust to address optimioptimi-zation prob-lems. For example, traditional mathematical programming does not always guarantee a global solution. Metaheuristics, including the well-known genetic algorithm (GA) and particle swarm optimization (PSO), are long proven to produce reliable results for various prob-lems. Although the risk of capturing local optimum traps is lower than with traditional methods (Kaya 2011), some researchers have noticed that GA and PSO can converge prematurely when most of the indi-viduals in a population contain similar structures. This reduces the search capability and may end up in local optima (Liang et al. 2006;Na-Na et al. 2006;Shieh et al. 2011;Pattnaik et al. 2013).
In GA, once the population has converged, the ability of the GA to continue to search for better solutions is effectively eliminated because the crossover of almost identical chromosomes produces little that is new. Only mutation remains for exploring entirely new domains, and this simply performs a slow random search (Beasley et al. 1993). Thus, shortcomings in current GAs have encouraged researchers to improve the performance of GA by modifying the selection procedure (Patel et al. 2009,2011), crossover operator (Andre et al. 2001;Kaya 2011), or mutation operator (Tang and Tseng 2013), or even by hybridizing GA with other algorithms (Chen and Flann 1994;Kao and Zahara 2008;Mahmoodabadi et al. 2013). To this end, more advanced prediction and optimization algorithms are still needed to optimize HPC mixtures.
The K-means and chaos genetic algorithm (KCGA) (Cheng and Huang 2010) and the evolutionary support vector machine inference model (ESIM) (Cheng and Wu 2009b) are two artificial intelligence (AI) approaches that have been successfully applied in many construction industry problems. KCGA is a powerful hybrid optimization algorithm that eliminates some of the shortcomings 1
Professor, Dept. of Construction Engineering, National Taiwan Univ. of Science and Technology, #43, Sec.4, Keelung Rd., Taipei, 106, Taiwan, Republic of China.
2
Dept. of Construction Engineering, National Taiwan Univ. of Science and Technology, #43, Sec.4, Keelung Rd., Taipei, 106, Taiwan, Republic of China (corresponding author). E-mail: [email protected]
3
Postdoctoral Researcher, Dept. of Construction Engineering, National Taiwan Univ. of Science and Technology, #43, Sec.4, Keelung Rd., Taipei, 106, Taiwan, Republic of China.
Note. This manuscript was submitted on July 7, 2012; approved on July 18, 2013; published online on July 20, 2013. Discussion period open until July 26, 2014; separate discussions must be submitted for individual papers. This technical note is part of theJournal of Computing in Civil Engineering, © ASCE, ISSN 0887-3801/06014003(7)/$25.00.
of traditional GA, whereas ESIM can map complex input-output relationships by automatically self-adjusting its parameters. The success of KCGA and ESIM in improving the performance of GA and SVM has opened the possibilities of establishing more advanced hybrid algorithms. Integrating KCGA and ESIM offers strong potential to generate a robust method for finding optimum HPC mixtures.
The primary objective of this research work is to develop a novel genetic algorithm–based evolutionary support vector machine (GA-ESIM) for finding the optimum HPC mixture. To achieve the goal, this research fuses KCGA with ESIM. ESIM is employed to build an accurate HPC strength model and KCGA is performed to obtain the optimum HPC mixture components based on the established strength model. The remaining sections of this paper include a review of past studies of HPC mixture proportioning in the next section. The third section introduces ESIM and KCGA and describes the proposed architecture of GA-ESIM. The fourth section elaborates on the proposed model in application following HPC historical cases and introduces the incorporation of GA-ESIM and the graphical user interface (GUI). Conclusions and research findings are given in the last section.
Literature Review
K-Means and Chaos Genetic Algorithm
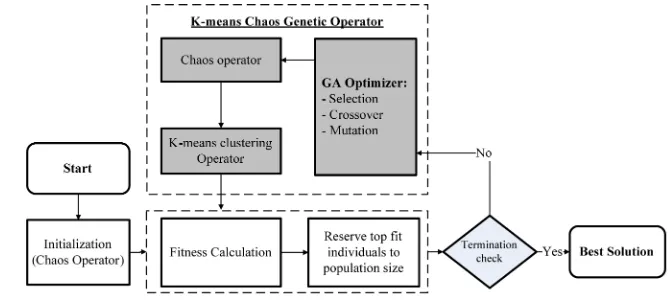
KCGA is a powerful hybrid algorithm proposed by Cheng and Huang (2009), which integrates K-means and chaos attributes based on GA. KCGA has been applied in several construction prob-lems, such as site layout and time–cost tradeoff problems (Cheng and Huang 2009;Cheng et al. 2011a). K-means plays a critical role in the convergence of GA, whereas chaos algorithms can maintain GA population diversity and avoid premature convergence. Thus, KCGA not only enhances the diversity of GA to obtain greater ac-curacy, but also extracts clustering rules to achieve the potential trend of evolution. In addition, it can effectively erase some draw-backs of traditional GA, such as long running time and becoming trapped in local optima. The whole procedure of KCGA is de-scribed in Fig.1.
Evolutionary Support Vector Machine Inference Model
Recently, SVM has been extensively applied in various fields of science and engineering. However, SVM presents users the prob-lem of tuning optimal kernel parameters. To address this situation, Cheng and Wu (2009b) developed ESIM by fusing SVM with fast,
messy genetic algorithm (fmGA). The structure of the ESIM is illustrated in Fig. 2. As a powerful prediction tool, ESIM can address complex input-output mapping relationships, as verified in many construction-related topics, such as cost estimation (Cheng and Wu 2009b;Chou et al. 2011), project success assessment (Cheng et al. 2010a), estimate at completion (Cheng et al. 2010b), construc-tion insurance (Cheng et al. 2011b), risk management (Cheng and Wu 2009b), and building assessment (Chen et al. 2012).
Genetic Algorithm–Based Evolutionary Support
Vector Machine
A novel, powerful algorithm is proposed called GA-ESIM. The proposed model employs ESIM for handling nonlinear input-output mapping relationships when establishing the prediction model and KCGA for optimizing the HPC mixture based on the established model. The hybridization of these AI methods is ex-pected to yield a robust model for optimizing mixture properties. The operation of GA-ESIM begins with a population of individ-uals. The individuals represent solution vectors of mixture compo-nents. The next step is to obtain the fitness value by evaluating each individual in the population. This can be done by substituting
Fig. 1.Flowchart of KCGA (adapted fromCheng et al. 2011b)
Fig. 2.Structure of ESIM (reprinted from Automation in Construction, Vol. 18, No. 5, Min-Yuan Cheng and Yu-Wei Wu,“Evolutionary sup-port vector machine inference system for construction management”, pp. 597-604, Copyright 2009, with permission from Elsevier)
each individual in the objective function and conducting the calcu-lation process. However, many complex objective functions cannot be expressed in a mathematical equation. In this situation, ESIM plays a critical role in mapping the complex and nonlinear relation-ship between each individual and its fitness value.
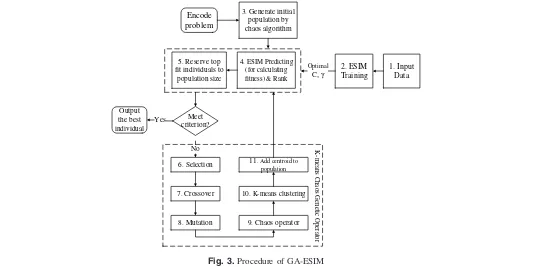
After the evaluation is finished, the population is operated by five primary operators adopted from KCGA: selection, crossover, mutation, chaos operator, and K-means operator. The operation is repeated until the optimal solution is found or the stopping criterion is achieved. The complete GA-ESIM algorithm flowchart is shown in Fig.3and the whole procedure of GA-ESIM is described in the following.
1. Phase 1 is the initialization phase.
• Step 1: Input data are prepared for building the predic-tion model.
• Step 2: Conduct ESIM training to establish the prediction model, including the optimized C and γ parameters of
SVM (C is a soft margin parameter which controls the trade-off between margin maximization and error minimiza-tion.γis a kernel parameter which defines how far the
in-fluence of a single training example reaches). To minimize the bias in ESIM training, cross-validation can be applied. • Step 3: Generate initial population randomly by chaos algorithm. Each individual represents a potential solution to a problem.
2. Phase 2 is repeated until the stopping criterion is satisfied. • Step 4: Conduct ESIM predicting (for calculating fitness)
and ranking. The population is evaluated to obtain the fit-ness value of each individual. ESIM maps each individual and its fitness value by using the optimalCandγ.
• Step 5: Reserve top fit individuals to population size. The fitness value of each individual is ranked and top fit indi-viduals are reserved to population size.
• Step 6: Select parent individuals for genetic operation by using tournament selection principle.
• Step 7: Perform crossover operation, which mates parents to produce the next generation based on crossover rate. A uniform crossover is adopted.
• Step 8: Perform mutation operation, which produces spon-taneous random changes in various individuals based on mutation rate.
• Step 9: The chaos operator diversifies individuals after mutation by using chaos mapping operator.
• Step 10: Conduct K-means clustering, which groups and locates the centroid of each cluster.
• Step 11: Add centroids to the population. Location infor-mation for each centroid of the cluster is treated as candi-date individuals for the next generation.
3. Phase 3: output the best fitness value and its corresponding solution.
Case Study
This section demonstrates the performance of the novel GA-ESIM. The proposed algorithm has been developed using the MATLAB platform version 7.10.0 (MATLAB version 7.10.0 (R2010a)). A case study to find an optimum HPC mixture is provided to perform the application potential of the proposed model. The rest of this section is dedicated to describe the model in detail.
Input Data
Data used in this paper were originally generated by Yeh (1998) and were collected from a repository of data at the University of California, Irvine (UCI). The database includes a total of 1,030 con-crete sample records from 17 concon-crete strength test laboratories and cover nine attributes, eight of which are input factors and one of which is an output factor (Table1). Input and output variables were normalized between 0 and 1 to avoid numerical difficulties or con-ditions in which attributes with greater ranges dominate those with smaller ranges (Hsu et al. 2003). The function used to normalize data is shown in Eq. (1):
4. ESIM Predicting (for calculating
8. Mutation 9. Chaos operator 10. K-means clustering
Fig. 3.Procedure of GA-ESIM
wherexnorm
n =normalized data of attributen;xn =initial data of attributen;xmax
n =upper bound data of attributen;xminn =lower bound data of attributen.
ESIM Training
The HPC data were subjected to 10-fold cross validation to ensure that all of the data set was applied in both the training and testing phases. The root-mean-square error (RMSE) and mean absolute error (MAE) were employed to evaluate the error measurement of each fold. The formulations of RMSE and MAE are expressed in the following equations:
wherey=actual value;y0=predicted value; andn=number of
data samples.
Optimal Prediction Model of ESIM
This section presents the prediction results of ESIM training and testing. Additional well-known prediction tools, including SVM and ANN, were also employed for comparison purposes. TheC andγ parameters for SVM were set to 1 and 0.125, as suggested
by Hsu et al. (2003). The parameter setting for ANN followed Yeh (1998) and Yeh and Lien (2009) as follows: number of hidden layers = 1; number of hidden units = 8; learning rate = 1.0;
momentum factor = 0.5; and learning cycles = 3,000. RMSE and MAE results of the ESIM compared against SVM and ANN are shown in Tables2and 3.
The results indicate that ESIM achieves better performance for predicting HPC compressive strength than both SVM and ANN. The ANN did not show equally satisfactory performance. However, no attempt was made in this study to investigate the suitability of alternative ANN architectures or learning schemes. For the training
Table 2.Training and Testing RMSEs of Various Prediction Tools Verified by Ten-Fold Cross Validation
Number of folds
Training RMSE (MPa) Testing RMSE (MPa)
ESIM optimal parameters
ESIM SVM ANN ESIM SVM ANN C γ
1 5.98 8.76 6.81 6.76 7.56 6.97 185 0.5524
2 5.88 8.70 6.80 5.95 8.89 7.26 198 0.6364
3 6.05 8.61 6.56 7.64 9.66 7.95 195 0.4411
4 6.03 8.73 6.94 5.93 8.69 7.07 184 0.4171
5 5.95 8.76 6.62 6.46 8.49 7.25 24 0.8001
6 6.08 8.66 6.69 6.00 9.15 6.68 190 0.9985
7 6.33 8.73 6.97 6.77 8.29 7.41 200 0.2001
8 6.29 8.70 7.30 6.21 8.83 8.04 165 0.2561
9 5.94 8.65 7.05 6.50 9.43 7.44 60 0.9501
10 5.82 8.64 7.18 7.06 9.68 8.00 125 0.9995
Minimum 5.82 8.61 6.56 5.93 7.56 6.68 — —
Average 6.04 8.69 6.89 6.53 8.87 7.41 — —
Maximum 6.33 8.76 7.30 7.64 9.68 8.04 — —
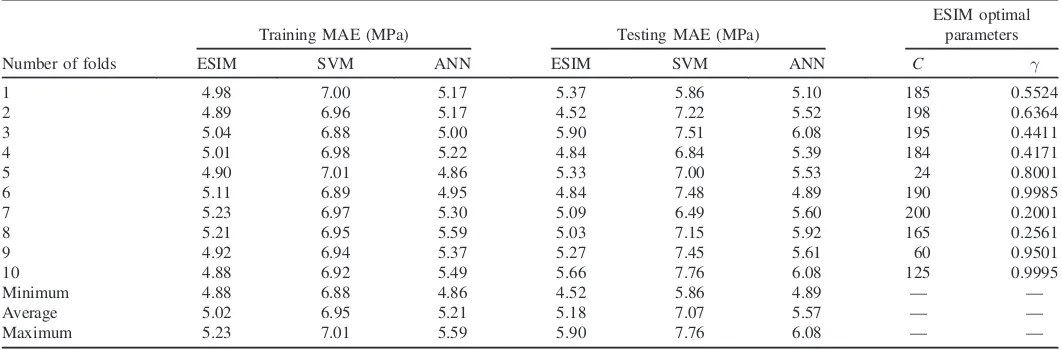
Table 3.Training and Testing MAEs of Various Prediction Tools Verified by Ten-Fold Cross Validation
Number of folds
Training MAE (MPa) Testing MAE (MPa)
ESIM optimal parameters
ESIM SVM ANN ESIM SVM ANN C γ
1 4.98 7.00 5.17 5.37 5.86 5.10 185 0.5524
2 4.89 6.96 5.17 4.52 7.22 5.52 198 0.6364
3 5.04 6.88 5.00 5.90 7.51 6.08 195 0.4411
4 5.01 6.98 5.22 4.84 6.84 5.39 184 0.4171
5 4.90 7.01 4.86 5.33 7.00 5.53 24 0.8001
6 5.11 6.89 4.95 4.84 7.48 4.89 190 0.9985
7 5.23 6.97 5.30 5.09 6.49 5.60 200 0.2001
8 5.21 6.95 5.59 5.03 7.15 5.92 165 0.2561
9 4.92 6.94 5.37 5.27 7.45 5.61 60 0.9501
10 4.88 6.92 5.49 5.66 7.76 6.08 125 0.9995
Minimum 4.88 6.88 4.86 4.52 5.86 4.89 — —
Average 5.02 6.95 5.21 5.18 7.07 5.57 — —
Maximum 5.23 7.01 5.59 5.90 7.76 6.08 — —
Table 1.HPC Influencing Factor Data
Input factor Unit Upper bound Lower bound
Cement Kg=m3 Superplasticizer Kg=m3
0.00 32.20 Fine aggregate Kg=m3
801.00 1,145.00 Coarse aggregate Kg=m3
594.00 992.60 Age of testing Day 1.00 365.00 Output factor Unit Upper bound Lower bound Compressive strength MPa 2.33 82.60
data set, the minimum, average, and maximum RMSEs of ESIM were 5.82, 6.04, and 6.33 MPa, respectively; those of MAE were 4.88, 5.02, and 5.23 MPa, respectively. For the testing data set, the minimum, average, and maximum RMSEs of ESIM were 5.93, 6.53, and 7.64 MPa, respectively; those of MAE were 4.52, 5.18, and 5.90 MPa, respectively. The best prediction model for HPC compressive strength was found in Fold 4, which showed the lowest testing RMSE of 5.93 and the second lowest testing MAE of 4.84.
Finally, ESIM C and γ parameters of Folds 4, 184, and
0.4171, respectively, were identified as the optimal tuning parameters. In the final step, the optimal C and γ parameters
were conducted in the optimization phase of GA-ESIM as the optimal prediction model. With this model, ESIM is ready for mapping the new input-output relationship during the fitness calculation process.
GA-ESIM Optimization Process
To demonstrate the performance of the proposed model, several HPC mixtures with various strength requirements were searched. The requirements included 28-day compressive strength (f0
c) of
25, 30, 35, 40, 45, 50, 55, and 60 MPa with additional 5% tol-erance. During the optimization process conducted by KCGA, ESIM used the prediction model to map the relationship between mixture properties as the input andfc0as the output of HPC data. The role of KCGA was to find the optimum mixture component that yielded the requiredfc0for HPC. Feasible solutions were gen-erated and evaluated by using the established prediction model. Solutions with the closest value to the required strength were re-garded as suitable solutions. In KCGA, the population of solution underwent selection, crossover, mutation, chaos operator, and K-means clustering until the optimal mixture solution with the requiredf0
c was reached.
The formulation for HPC mixture optimization was adopted from Yeh (2007) and is expressed in the following equation:
minimize cost¼Wc×CcþWsl×CslþWfl×CflþWw×Cw
þWsp×CspþWca×CcaþWfa×Cfa ð4Þ
The lower and upper bound components were adopted from his-torical data. Table4represents the approximate unit costs of each component in Taiwan.
The parameters of KCGA were set as follows: number of gen-erations=500, population size=80, crossover rate=0.8, mutation rate=0.15, number of K-means clusters=4. Reaching the
maxi-mum number of generations was the cue to stop the computation. Each individual in the population of KCGA represented ran-dom HPC mixture components. The age of testing was set at 28 days. Next, ESIM optimalCand γ parameters (C¼184and γ¼0.4171) were used to map each individual to its fitness value.
KCGA operators, including selection, crossover, mutation, chaos, and K-means, were employed to determine the best individual. The process was repeated until the stopping criterion was met. The final results of the optimum mixture obtained for each strength re-quirement are listed in Table5.
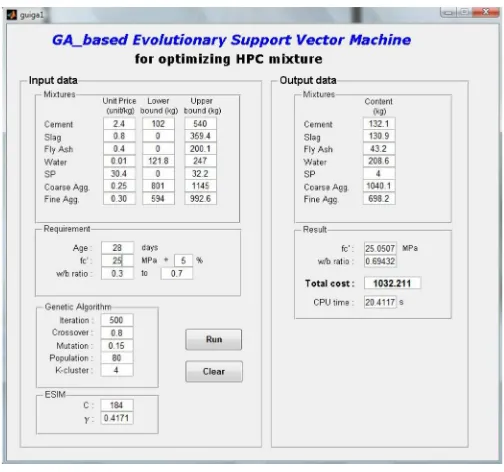
Integrating GA-ESIM with Graphic User Interface of MATLAB
A GUI is a graphical display that allows users to perform interactive tasks. This study developed a system that integrates GA-ESIM with
Table 4.Approximate Unit Prices of HPC Components in 2011
Components Unit price (NT$=kg)a
Cement 2.40
Table 5.Optimized HPC Mixture Components
Target f0
c (MPa)
Component contents (kg=m3
) Cement Slag Fly ash Water Superplasticizer
Coarse aggregate
Fine aggregate
25 132.1 130.9 43.2 208.6 4.0 1,040.1 698.2 25.1 0.694 1,032.2
30 132.7 135.0 70.7 193.0 4.4 1,042.0 705.9 30.0 0.583 1,062.7
35 134.4 211.9 24.8 221.5 4.8 878.4 749.7 35.0 0.610 1,094.6
40 136.3 203.1 74.1 228.2 5.4 799.6 775.9 40.1 0.565 1,118.3
45 161.4 205.4 70.5 221.5 5.7 786.5 786.6 45.3 0.520 1,187.7
50 217.9 196.6 56.6 217.5 6.1 808.7 748.5 50.0 0.475 1,317.2
55 293.7 14.0 197.4 186.1 6.6 995.8 658.5 55.1 0.382 1,444.0
60 332.2 3.1 199.9 172.2 7.0 1,001.5 666.8 61.6 0.335 1,544.6
Fig. 4.Demonstration of GUI integrated with GA-ESIM
a GUI to provide users with easy and effective interactions. To dem-onstrate the performance of the system, an example is provided as follows: unit price, lower and upper bounds, available water-binder ratio range, and the same KCGA and ESIM parameters as de-scribed previously; the requiredfc0 at 28 days was 25 MPa. The HPC mixture was presented on the output panel of the proposed system, as shown in Fig.4.
Conclusions
This research developed the GA-ESIM for optimizing HPC mix-tures by fusing KCGA with ESIM. ESIM primarily achieved the concurrent C and γ parameters to build an accurate prediction
model, verified by cross-validation. KCGA can conduct simula-tions of trial mixes and finds the optimum solution in a short time without becoming trapped in local optima. In this case study, indi-viduals of KCGA represented compositions of the HPC mixture, whereas the fitness value represented HPCf0
c. During the optimi-zation process performed by KCGA, ESIM handled the complex relationship between each individual and its fitness value. Mean-while, the integration between GA-ESIM with GUI assisted the user in easily performing optimization tasks.
The comparison among ESIM, SVM, and ANN showed the superiority of ESIM as a prediction tool for HPC f0
c. Thus, the incorporation of ESIM with KCGA shows the strong potential of GA-ESIM as a robust model for optimizing HPC mixtures. In addition, this model has the possibility for application in other academic and engineering fields.
Acknowledgments
The authors would like to thank Professor I-Cheng Yeh for provid-ing HPC database.
References
Andre, J., Siarry, P., and Dognon, T. (2001).“An improvement of the stan-dard genetic algorithm fighting premature convergence in continuous optimization.”Adv. Eng. Softw., 32(1), 49–60.
Beasley, D., Bull, D. R., and Martin, R. R. (1993).“An overview of genetic algorithms: Part 1, fundamentals.”Univ. Comput., 15(2), 58–69. Chen, C.-S., Cheng, M.-Y., and Wu, Y.-W. (2012).“Seismic assessment
of school buildings in Taiwan using the evolutionary support vector machine inference system.”Expert Syst. Appl., 39(4), 4102–4110.
Chen, H., and Flann, N. S. (1994).“Parallel simulated annealing and ge-netic algorithms: A space of hybrid methods.”Parallel problem solving from nature: PPSN III, Vol. 3, Springer, New York, 428–438. Cheng, M.-Y., and Huang, K.-Y. (2009).“K-means clustering and chaos
genetic algorithm for nonlinear optimization.” 26th Int. Symp. on Automation and Robotics in Construction (ISARC 2009), International Association for Automation and Robotics in Construction, Eindhoven, Netherland.
Cheng, M.-Y., and Huang, K.-Y. (2010).“Genetic algorithm-based chaos clustering approach for nonlinear optimization.”J. Mar. Sci. Tech., 18(3), 435–441.
Cheng, M.-Y., Huang, K.-Y., and Cuong, C. P. (2011a). “Genetic algorithm-based chaos clustering approach for optimizing construction time-cost tradeoff problems.” 28th Int. Symp. on Automation and Robotics in Construction (ISARC 2011), International Association for Automation and Robotics in Construction, Eindhoven, Netherland. Cheng, M.-Y., Peng, H.-S., Wu, Y.-W., and Chen, T.-L. (2010a). “Estimate at completion for construction projects using evolutionary support vector machine inference model.” Autom. Constr., 19(5), 619–629.
Cheng, M.-Y., Peng, H.-S., Wu, Y.-W., and Liao, Y.-H. (2011b).“Decision making for contractor insurance deductible using the evolutionary support vector machines inference model.”Expert Syst. Appl., 38(6), 6547–6555.
Cheng, M.-Y., and Wu, Y.-W. (2009a).“Evolutionary support vector ma-chine inference system for construction management.”Autom. Constr., 18(5), 597–604.
Cheng, M.-Y., and Wu, Y.-W. (2009b).“Prediction of diaphragm wall de-flection in deep excavations using evolutionary support vector machine inference model (ESIM).”26th Int. Symp. on Automation and Robotics in Construction (ISARC 2009), International Association for Automa-tion and Robotics in ConstrucAutoma-tion, Eindhoven, Netherland.
Cheng, M.-Y., Wu, Y.-W., and Wu, C.-F. (2010b).“Project success predic-tion using an evolupredic-tionary support vector machine inference model.”
Autom. Constr., 19(3), 302–307.
Chou, J.-S. (2011). “Optimizing the prediction accuracy of concrete compressive strength based on a comparison of data-mining techniques.” J. Comput. Civ. Eng., 10.1061/(ASCE)CP.1943-5487 .0000088, 242–253.
Chou, J.-S., Cheng, M.-Y., Wu, Y.-W., and Tai, Y. (2011). “Predicting high-tech equipment fabrication cost with a novel evolutionary SVM inference model.”Expert Syst. Appl., 38(7), 8571–8579.
Domone, P. L. J., and Soutsos, M. N. (1994).“Approach to the proportion-ing of high-strength concrete mixes.”Concr. Int., 16(10), 26–31. Hsu, C. W., Chang, C. C., and Lin, C. J. (2003).“A practical guide to
sup-port vector classification.”Department of Computer Science, National Taiwan Univ., Taipei City, Taiwan.
Ji, T., Lin, T., and Lin, X. (2006).“A concrete mix proportion design algo-rithm based on artificial neural networks.”Cement Concr. Res., 36(7), 1399–1408.
Kao, Y.-T., and Zahara, E. (2008).“A hybrid genetic algorithm and particle swarm optimization for multimodal functions.” Appl. Soft Comput., 8(2), 849–857.
Kaya, M. (2011).“The effects of two new crossover operators on genetic algorithm performance.”Appl. Soft Comput., 11(1), 881–890.
Ko, C.-H., Cheng, M.-Y., and Wu, T.-K. (2007).“Evaluating sub-contractors performance using EFNIM.”Autom. Constr., 16(4), 525–530.
Liang, J. J., Qin, A. K., Suganthan, P. N., and Baskar, S. (2006). “Comprehensive learning particle swarm optimizer for global optimi-zation of multimodal functions.”IEEE Trans. Evol. Comput., 10(3), 281–295.
Lim, C.-H., Yoon, Y.-S., and Kim, J.-H. (2004).“Genetic algorithm in mix proportioning of high-performance concrete.”Cem. Concr. Res., 34(3), 409–420.
Mahmoodabadi, M. J., Safaie, A. A., Bagheri, A., and Nariman-zadeh, N. (2013). “A novel combination of particle swarm optimization and genetic algorithm for Pareto optimal design of a five-degree of freedom vehicle vibration model.”Appl. Soft Comput., 13(5), 2577–2591. MATLAB version 7.10.0 (R2010a)[Computer software]. Natick, MA, The
MathWorks Inc.
Na-Na, L., Jun-Hua, G., and Bo-Ying, L. (2006).“A new genetic algorithm based on negative selection.”2006 Int. Conf. on Machine Learning and Cybernetics, IEEE, New York.
Patel, R., Raghuwanshi, M. M., and Jaiswal, A. N. (2009).“Modifying genetic algorithm with species and sexual selection by using K-means algorithm.” Advance Computing Conf., 2009, IACC 2009, IEEE International, New York.
Patel, R., Raghuwanshi, M. M., and Malik, L. G. (2011).“An improved ranking scheme for selection of parents in multi-objective genetic algorithm.”2011 Int. Conf. on Communication Systems and Network Technologies (CSNT), IEEE, New York.
Pattnaik, S. S., Bakwad, K. M., Sohi, B. S., Ratho, R. K., and Devi, S. (2013).“Swine influenza models based optimization (SIMBO).”Appl. Soft Comput., 13(1), 628–653.
Shieh, H.-L., Kuo, C.-C., and Chiang, C.-M. (2011). “Modified particle swarm optimization algorithm with simulated annealing behav-ior and its numerical verification.” Appl. Math. Comput., 218(8), 4365–4383.
Tang, P.-H., and Tseng, M.-H. (2013). “Adaptive directed mutation for real-coded genetic algorithms.” Appl. Soft Comput., 13(1), 600–614.
Yeh, I.-C. (1998).“Modeling of strength of high-performance concrete using artificial neural networks.”Cem. Concr. Res., 28(12), 1797–1808.
Yeh, I.-C. (1999).“Design of high-performance concrete mixture using neural networks and nonlinear programming.”J. Comput. Civ. Eng., 10.1061/(ASCE)0887-3801(1999)13:1(36), 36–42.
Yeh, I.-C. (2007). “Computer-aided design for optimum concrete mix-tures.”Cem. Concr. Compos., 29(3), 193–202.
Yeh, I.-C. (2009).“Optimization of concrete mix proportioning using a flattened simplex–centroid mixture design and neural networks.”
Eng. Comput., 25(2), 179–190.
Yeh, I.-C., and Lien, L.-C. (2009). “Knowledge discovery of concrete material using Genetic Operation Trees.” Expert Syst. Appl., 36(3), 5807–5812.