Analyzing Rice Demand and Supply Behavior for
Food Availability: a System Dynamics Framework
(Case Study: Sub-Regional Surabaya, Gresik, and Sidoarjo)
Erma Suryani*, Diajeng Permata I.J. *, Rully Agus Hendrawan*, Lily Puspa Dewi*,**
* Department of Information Systems, Faculty of Information Technology, Institut Teknologi Sepuluh Nopember ** Department of Informatics, Faculty of Industrial Technology, Petra Christian University
Keywords:
System Dynamics Supply
Demand
Food availability Scenario
ABSTRACT
Food availability is a cross-cutting issue that has become a national issue as the impact of food insecurity in several regions in Indonesia. Current popular of staple food in Indonesia is still dominated by rice, so that the Indonesian population demand on rice is still very high. This led to the dominance of rice food availability in Indonesia become unbalanced. Therefore, it is important for the government to maintain the food availability in each region in order to sustain national food availability. To support these efforts, in this research, we developed system dynamics model to analyze the behavior of the supply and demand of rice in the sub-regional Surabaya, Gresik, and Sidoarjo with the consideration that rice demand of these three regions merged into one division and has greatest value when compared with the demand from other divisions in East Java. System dynamics framework is utilized based on consideration that the relationship factors that affect supply and demand of rice are non-linear and dynamic. The expected outcome of this research is a system dynamic model of rice demand and supply based on the existing condition and several policy scenarios to ensure food availability in these three sub-regionals.
Copyright © 2013 Information Systems International Conference. All rights reserved.
Corresponding Author:
Erma Suryani,
Departement of Information Systems Faculty of Information Technology, Institut Teknologi Sepuluh Nopember,
Jalan Raya Kampus ITS, Gedung Sistem Informasi, Sukolilo, Surabaya, Indonesia. Email: [email protected]
1. INTRODUCTION
Rice is still the most popular of the staple food in Indonesia, therefore people's dependence on rice is still very high. The ease of rice processed into food affordable price and available in most parts of the country, thus it is difficult to choose the staples other than rice. Nutrient content of rice is relatively better, when compared with other staples, such as cassava, maize and tubers. This led to the dominance of rice food availability in Indonesia become unbalanced. Another consequence of the Indonesia population dependence on rice caused the government should pursue policies to import rice to meet domestic demand for rice. Another problem arising is the rice distribution is still not evenly distributed to region likely lead to food shortages which impact on the poor. Therefore, it is important for the government to expand the food availability from each region to be able to sustain national food availability.
Sumatra, Sulawesi and Kalimantan is also an area of rice production. However, the levels of production generated by these areas are not as high as that produced by Java [1]. In general, rice production is highly dependent on the land productivity that is affected by several factors such as harvest area, rainfall, and fertilizer subsidies. Good rainfall for rice is 200mm per month or 1500 to 2000 mm per year [3]. If rainfall is too low, it will reduce the fertility of crops, while if it is too high, it will cause flooding.
Today, rice supply comes from local procurement, other region (movement), and imports [8]. Approximately 0.54% of total procurement distributed in the form of Raskin (rice for the poor) to RTS (Targeted Households), and the rest is stored as CBP (Government Rice Reservation). CBP issued for catastrophe and market operations.
System dynamics (SD) models is used to model of the rice demand and supply behavior for food availability based on the consideration that system dynamics is a powerful (simple ideas can be combined into complex systems models), useful (it makes the integration of modeling and experimenting a simple matter), and natural (the simple ideas behind SD models Correspond to a basic form of human thought) framework to learn the system behavior [6]. It provides a framework flexibility in developing several scenarios to reduce technical (TL) and non-technical losses (NTL).
This paper is organized as follows. Section 2 provides research method. Section 3 describes results and analysis, and finally in Section 4, conclusion is presented.
2. RESEARCH METHOD
To develop a system dynamics models, the steps required are: a) understanding the system, b) identification of significant variables, c) Causal Loop Diagram Development d) Flow Diagram Development, e) Model Validation, f) Scenario Development.
1. Understanding of the system. Understanding of the required system to be modeled as a first step in developing the model, to provide an overview and guidance in determining the models’ components and interactions between components of the model. In this research, there are several models’ components (sub-models), namely: population, demand, average per capita consumption of rice, land productivity, land area, the ratio of fulfillment, and supply of rice to the sub-regional Surabaya, Sidoarjo and Gresik. 2. Identification of significant variables. Some of the significant variables related to demand and supply
food availability are described in Table 1:
Table 1 List of Significant Variables
Sub-model Variables
Population Birth rate, Death rate
Demand Average per capita rice consumption, population
Average per capita rice consumption
Average caloric needs per day, rice calories per kilogram, rice calorie percentage fulfillment
Land productivity Rainfall, fertilization, widely puso (percentage of rice planted area damaged by drought, floods and pests)
Land area Land expansion, land that change function
Fulfillment ratio Demand, supply
Supply Land area, Land productivity
Figure 1. Causal Loop Diagram of Rice Fulfillment Ratio
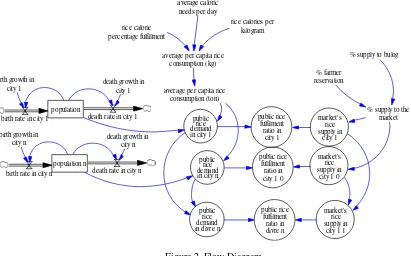
4. Flow Diagram Development. After having obtained the relationships between variables, then flow diagram is developed as shown in Figure 2.
Figure 2. Flow Diagram
Total Population is the value of birth minus deaths (using the simple formula of the total population). Rice demand is multiplied by the population and average rice consumption per capita per year.
5. Model Validation is required to check the model accuracy. According to Barlas [2], a model will be valid if the error rate (E1) is less than or equal to 5% and the variance error (E2) is less than or equal to 30%. The equations of error rate and error variance are shown in Eq. (1) – (2).
Eq. (1)
Eq. (2)
6. Scenario Development. This process is done to improve the system performance, in this case is to increase the fulfilment ratio. Increase in the fulfilment ratio is obtained by extending the land with the
Population
birth rate in city 1 death rate in city 1 birth growth in
city 1 death growth incity 1
population n
birth rate in city n death rate in city n birth growth in
city n death growth incity n
planted and that number from 2009 to 2011 was unchanged at 50 acres. Whereas, Gresik still have 2,973 acres of swamp that have not been planted [3].
3. RESULTS AND ANALYSIS
From the base model and scenario development, we obtained some research finding as follows:
3.1. Base Model Analysis
In this section will present the results of the output sub models, such as population, demand, rice supply of for the sub-region Surabaya, Sidoarjo and Gresik.
3.1.1 Population.
The population sub model output is shown in Figure 3, it appears that the population of Surabaya higher than in Gresik and Sidoarjo. Surabaya municipality population is in the range 2.6 - 2.9 million people, Sidoarjo in the range of 1.5 - 2.3 million people, while Gresik in the range of 1 - 1.3 million people during the years 2011-2012.
Figure 3. Population of Surabaya, Sidoarjo, and Gresik 3.1.2 Demand
The amount of rice demand is strongly influenced by rice consumption per capita and population. As shown in Figure 4, the Surabaya rice demand in 2011-2012 ranged from 300000-350000 tons, Sidoarjo ranges between 185000-277000 tons, while Gresik ranges between 120000-160000 tons.
Figure 4. Rice Demand of Surabaya, Sidoarjo, and Gresik 3.1.3 Supply
Rice supply was affected by the land productivity and land area. Surabaya rice supply in year 2011-2012 ranged from 6000-16623 tons, Sidoarjo ranged from 75000-185000 Ton, while Gresik ranged from 112000-339000 tons as shown in Figure 5.
Population
4 M
3 M
2 M
1 M
0
0 2 4 6 8 10 12 14 16 18 20
Time (Year)
Surabaya Population : Current Sidoarjo Population : Current Gresik Population : Current
Demand
400,000
300,000
200,000
100,000
0
0 2 4 6 8 10 12 14 16 18 20
Time (Year)
T
on
Figure 5. Rice Supply of Surabaya, Sidoarjo, and Gresik
3.2. Validation of Some Outputs (Results)
Regarding model validation, we utilized some variables such as population, demand, and supply to check the model accuracy. The error rate and error variance of these variables can be seen in Table 2.
Table 2. Model Validation
Variable Average Rate Standard Deviation Error Rate Error Variance
Population 0.001 0.146
Data 5537593 212884
Model 5530857 243984
Demand 0.042 0.196
Data 628406 24158
Model 654976 28893
Supply 0.027 0.264
Data 447871 29093
Model 460086 21425
As we can see from Table 2, it is shown that all the error rates and the error variance are less than 5% for the error rates and less than 30% for the error variance, which means that the model is valid.
3.3. Scenario Result
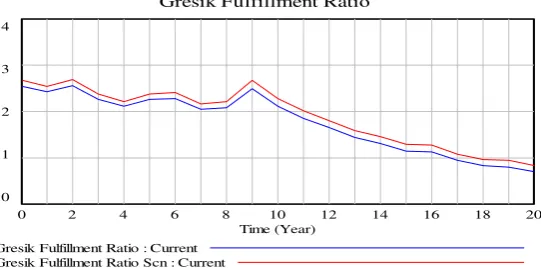
With the expansion of land area in Surabaya (50 ha) and Gresik (2973 ha), thus supply for Gresik will exceed the fulfilment ratio of 20% (the time period t = 13 - 20) as shown in Figure 6.
Figure 6. Gresik Fulfillment Ratio: Base and Scenario
This excess may be distributed to the Surabaya, thus Surabaya’s fulfilment ratio increased to an average of 20%, as shown in Figure 7. As a solution to comply the rice needs in Surabaya, 80% fulfilment can be brought in from outside Surabaya. For the Sidoarjo, since no additional land area, it can be done with the intensification of land use rice seeds. From land intensification scenario results for the Sidoarjo, it will increase the land productivity to 0.62%, thus the Sidoarjo’s fulfillment ratio increased by 4% as shown in
Supply
400,000
300,000
200,000
100,000
0
0 2 4 6 8 10 12 14 16 18 20
Time (Year)
Ton
Surabaya Supply : Current Sidoarjo Supply : Current Gresik Supply : Current
Gresik Fulfillment Ratio
4
3
2
1
0
0 2 4 6 8 10 12 14 16 18 20
Time (Year) Gresik Fulfillment Ratio : Current
approximately 33.6% of their needs.
Figure 7. Surabaya Fulfillment Ratio: Base and Scenario
Figure 8. SIdoarjo Fulfillment Ratio: Base and Scenario
4. CONCLUSION
Some conclusions can be described as follows:
In system dynamics model developing required a strong understanding of the system so that the resulting model can better represent the real system.
The data can help in determining the value of the parameters, equations and model validation.
With the expansion of land area in Surabaya (50 ha) and Gresik (2973 ha), thus supply for Gresik will exceed the fulfilment ratio of 20%,thus the excess can be distributed to the Surabaya.
The fulfilment ratio of Surabaya after receiving additional supply of Gresik can be increased to an average of 20%. As a solution to comply the rice needs in Surabaya, 80% fulfilment can be brought in from outside Surabaya.
For Sidoarjo region, since no additional land area, it can be done with the intensification of land use rice seeds. From land intensification scenario results for Sidoarjo, it will increase the land productivity to 0.62%, thus the Sidoarjo’s fulfilment ratio increased by 4%. To comply the rest of its lack, Sidoarjo needs supply from other areas by an average of approximately 33.6% of their needs.
REFERENCES
[1] Amang, B., Sawit, M. H., “Kebijakan Beras dan Pangan Nasional,” Institut Pertanian Bogor Press, Jakarta, 1999 [2] Barlas, Y., “Multiple tests for validation of system dynamics type of simulation models,”European Journal of
Operational Research, 42:59-87, 1989.
[3] Dinas Pertanian Jawa Timur. “Laporan Tahunan Penggunaan Lahan Bukan Sawah (ha) per Kabupaten/Kota,” Conference at the University of Puerto Rico, Mayaguez, 2006
[7] Widyakarya Nasional Pangan dan Gizi (WNPG), Jakarta: Lembaga Ilmu Pengetahuan Indonesia.2004
[8] Workshop Bulog., “Pemantauan Stok Gabah / Beras di Tingkat Penggilingan,” Surabaya: Bulog, 2012
Surabaya Fulfillment Ratio Scn Surabaya Fulfillment Ratio Scn : Current
BIBLIOGRAPHY OF AUTHORS
Erma Suryani has done researches in several areas such as System Dynamics, Modeling and Simulation, Supply Chain Management
Second author’s photo (3x4cm)
Diajeng Permata I.J has done research in System Dynamics
Rully Agus Hendrawan has done researches in several areas such as Information Engineering, Data Warehouse, and System Dynamics.