THESIS
Submitted to the Mathematics Education of tarbiyah Faculty of Syekh Nurjati State Institute for Islamic Studies (IAIN) Cirebon in Partial Fulfillment of the
Requirement for Islamic Scholars in Mathematics Education
SYAEFUL ANWAR
Reg. Number. 59451000
MATHEMATICS DEPARTMENT OF TARBIYAH FACULTY THE STATE INSTITUTE FOR ISLAMIC STUDIES
2
FORMER EDUCATIONAL BACKGROUND. Thesis.
Cirebon: Tarbiyah Faculty, Mathematics Tadris, The State Institute for Islamic Studies Syekh Nurjati Cirebon, July 2013. Educational institutions in Indonesia is divided into two kinds namely the institution that is in the shade of the religious affairs ministry ministry and the culture and education ministry. With this difference, it impacts on curriculum and educators. In MAN Cirebon 1 researcher founded that there are student with educational background in MTs, have higher mathematical reasoning than student from SMP.
This study aims at describing the students 'mathematical reasoning level educational background in junior high school, and the level of students' mathematical reasoning of MTs educational background. In other words, this study aims at test the hypothesis that there is a difference between the level of students 'mathematical reasoning background of SMP and students' educational background of MTs.
The reasoning is a thinking process or activity to draw a conclusion or thought processes in order to make a new statement that was based on a statement whose truth has been proven or assumed previously. Two kinds of educational institusion in Indonesia is impacts on curriculum and educators, also in facilities. So, educational background quite an impact in mathematical reasoning
This research is a case study with quantitative approach. Population in this research that students of class X in Cirebon MAN 1 in the academic year 2012/2013. With total amount 469 students. Samples were taken by using cluster random sampling technique and taken 30 students educational background from MTs and 30 from SMP.
And the result is, the average of mathematical reasoning students with Educational background from SMP is 64.73 and for students from MTs is 63.53. With each variance is 89.016 and 108.271. so, H0accepted and Hais rejected.
“ Where I am Fall in, In that
ﻢْـﯿـــِﺣﺮﱠـــﻟا ِﻦـــَﻤـــ ْﺣﺮﱠـــﻟا ﷲ ِﻢـــْﺴـــِﺑ
Alhamdulillahi Rabbil ‘Alamiin In the name of Allah, the Most Gracious and Merciful. All
praises and thanks be to Allah because of His blessing to me
until this time
I can keep istiqomah in my adventure in Your way ya Allah.
Finally my time to share my passion to my qoum insya Allah was arrive, qoum of Rosulullah Muhammad SAW.
Then Always keep my faith, Islam, and Ihsan ya Allah.
This thesis is dedicated to all of my lovely peoples.
Especially for my parents (Abdul Kholik and Sri Atun)
Who Always support my way.
And to my brothers and my sisters, i hope you can prepare because it is just begin. Be better than me.
To All of my big family who always in my side.
Then to my lovely all of my friends, especially for
Mathematics-A’09 Ganbatte
Name : Syaeful Anwar Birth : Decembre 22, 1989 Child No. : three of Seven Father : Abdul kholik Mother : Sri Atun
Address : Ir.H.Djuanda street RT.01 RW.04
Weru , Cirebon Regency of West Java Province
History of Education :
i
thanks be to Allah because of His blessing the writer was able to finish this thesis. May invocation and peace always be with Prophet Muhammad Peace be Upon Him, his family, colleageus, and followers up to the end of the world. Making of the thesis entitledis The Difference of Level of Mathematical Reasoning of Students based on Their Former Educational Backgroundwas companied by challenges that gave satisfaction for the writer.
The writer says thanks to:
1. Prof. Dr. H. Maksum Mukhtar, M.A., Rektor of The State Institute for Islamic Studies Syekh Nurjati Cirebon
2. Dr. Saefudin Zuhri, M. Ag., Dean of Tarbiyah Faculty of The State Institute for Islamic Studies Syekh Nurjati Cirebon
3. Toheri S,Si. M.Pd. as chief of Mathematics Department of State Institute for Islamic Studies Syekh Nurjati Cirebon
4. Reza Oktiana Akbar, M.Pd., Secretary of Mathematics Department of The State Institute for Islamic Studies Syekh Nurjati Cirebon.
5. Mustopa, M.Ag., as the Supervisor I 6. Budi Manfaat, M.Si., Supervisor II
7. Students of mathematics department of The State Institute for Islamic Studies Syekh Nurjati Cirebon,
8. Kumaedi M,Pd. as Chief of MAN Cirebon 1
9. Drs. Rojin Muna.M,Pd. as chief curicullum department of MAN Cirebon 1 10. Tuyono S,pd. as mathematical teacher of MAN Cirebon 1.
11. All teachers in MAN Cirebon 1 12. All Staff in MAN Cirebon 1
13. All students at MAN Cirebon 1, especially for class X5and X6.
ii
education.
iii
PREFACE... i
CONTENTS... iii
LIST OF TABLE ... iv
LIST OF FIGURE ... LIST OF APPENDIX ... CHAPTER I INTRODUCTION A. Background of Problems ... 1
B. Identification of Problems ... 5
C. Limitations of Problems ... 5
D. Problem Formulation... 6
E. Research Objectives ... 6
F. Use of Research ... 7
CHAPTER II THEORETICAL FRAMEWORK A. Theoretical Description... 9
1. Mathematical Reasoning ... 9
2. Educational Background ... 15
B. Overview of Relevant Research Results... 18
C. Framework of Thinking... 19
D. Hypothesis ... 21
CHAPTER III RESEARCH METHODOLOGY A. Place and Time of research ... 22
1. Place of Research... 22
2. Research time... 22
B. Methods and Desain of Research... 22
1. Research methods... 22
2. Research Design... 23
iv
b. Variable mathematical reasoning’s student(Y) ... 25
2. Operational Definitions... 26
a. Student's educational background variables (X) .... 26
4. Recapitulation Trial Analysis of Mathematical Reasoning Test Level ... 35
F. Data Analysis Techniques ... 36
1. Prerequisite test ... 36
a. Normality Test ... 36
b. Homogeneity test ... 37
2. Hypothesis Testing (T test)... 38
CHAPTER IV RESULTS AND DISCUSSION A. Data Description... 40
1. Educational Background of Students... 40
2. The level of mathematical reasoning of student ... 42
3. Hypothesis Testing ... 69
B. Data Analysis ... 69
1. Normality Test ... 69
2. Homogeneity test ... 70
3. T test ... 71
b. Variable mathematical reasoning skills students...26
E. Data Collection’s Techniques and Instrumentation... 26
1. Latticework construction... 26
2. Content validity by Expert Judgment ... 27
3. Empiric try-out... 31
a. Reliability estimation ... 31
b. Index Discrimination... 32
v
vi
Table 2.1 MTs Syllabus ... 16
Table 2.2 SMP Syllabus ... 17
Table 3.1 Research Schedule... 22
Table 3.2 Class X students MAN Cirebon ... 24
Table 3.3 The General Latticework of Instrument ... 27
Table 3.4 CVR Calculation Phase... 28
Table 3.5 Minimum CVR Value According to Lawshe ... 29
Table 3.6 CVR Calculation Phase... Table 3.7 Interpretation of Reliability ... 31
Table 3.8 Interpretation of Index Discrimination... 32
Table 3.9 Index Discrimination ... 33
Table 3.10 Interpretation Index of Dificulty... 34
Table 3.11 Index of Dificulty ... 34
Table 3.12 Recapitulation Trial Analysis of Mathematical Reasoning Test Level ... 35
Table 4.1 Sample List... 40
Table 4.2 Ability of junior high school students a background in conductinginference based on similarity of data or processes ... 42
Table 4.3 Ability students educational background MTs in doing inference based on similarity of data or processes ... 44
Table 4.4 The ability of students with SMP educational background on drawing general conclusion based on a number of observed data ... 45
vii
answers, solutions, or tendency ... 49 Table 4.8 The ability of students in the junior high educational
background Explaining the models, facts, nature,
relationships, or patterns that exist ... 51 Table 4.9 The ability of student in MTs educational background to
explain in the model, the facts, nature, relationships,
or patterns that exist ... 52 Table 4.10 Ability of junior high school students a background in
performing calculations based on certain rules or
formulas... 53 Table 4.11 Ability students educational background MTs in
implementing rules or calculations based on certain
formulas... 54 Table 4.12 The ability of students in the junior high educational
background Preparing direct evidence and indirect
evidence ... 56 Table 4.13 Ability students educational background MTs in
developing direct evidence and indirect evidence... 57 Table 4.14 The ability of students in a junior high school
education background checks the validity of the argument . 58 Table 4.15 Ability students educational background MTs in checking
the validity of the argument... 60 Table 4.16 Percentage of students' mathematical reasoning level in
terms of educational background SMP ... 61 Table 4.17 Percentage of students' mathematical reasoning level in
viii
Table 4.19 Descriptive Statistics ... 69
Table 4.20 Test of Normality... 70
Table 4.21 Test of Homogeneity Varians ... 71
ix
Figure 2.1 Scheme framework ... 20 Figure 4.1 Diagram of the student's ability with background in
junior high school students in performing similarity
Drawing conclusions based on data or process ... 43 Figure 4.2 Diagram of the student's ability students educational
background MTs in doing Withdrawal conclusions
based on similarity of data or processes... 44 Figure 4.3 Diagram ability junior high school students a
background in performing drawing general conclusion
based on a number of observed data ... 46 Figure 4.4 The ability of students in the educational background
MTs do recall some general conclusions based on the
observed data ... 47 Figure 4.5 Diagram ability junior high school students a background
in doing Estimating answers, solutions,
or the tendency ... 49 Figure 4.6 Diagram ability students educational background MTs in
doing estimating answers, solutions, or the tendency ... 50 Figure 4.7 Diagram ability junior high school students a background
in the Give an explanation of the model, the facts,
nature, relationships, or patterns that exist ... 51 Figure 4.8 The ability of students in MTs educational background
explaining the models, facts, nature, relationships,
or patterns that exist ... 52 Figure 4.9 Diagram ability junior high school students a background
in performing calculations based on certain rules or
x
Figure 4.11 Diagram of The ability of students in the junior high educational background Preparing direct evidence and
indirect evidence ... 56 Figure 4.12 Diagram ability students educational background MTs in
Developing direct evidence and indirect evidence... 58 Figure 4.13 Diagram ability junior high school students a
background in checking the validity of the argument ... 59 Figure 4.14 Diagram ability students educational background
MTs in checking the validity of the argument ... 60 Figure 4.15 Graph the results of tests of mathematical reasoning
students with a background in SMP... 62 Figure 4.18 Graph the results of tests of mathematical reasoning
xi
A.1. DATA POPULATION... 79
A.2. DATA SAMPLE ... 104
B.1. LATTICEWORK CONSTRUCTION ... 110
B.2. INSTRUMENT ... 112
B.3. SOLUTION ... 115
C.1. EMPHIRIC TRY OUT... 127
C.2. DATA ANALYZE ... 135
C.3 t TABLE ... 146
D.1. LETTER OF PROBLEM VALIDATION... 147
D.2. SK. ... 156
D.3. SURAT PENGANTAR PENELITIAN ... 157
CHAPTER I INTRODUCTION
A. Background of Problem
Education is a crucial thing which can not be separated from the human as social beings, this is make a differences between human and other creatures. Human has a reasoning and mind to be used for the benefit of a lot of human in the world and in order that people has been choosen as leader in the world. To increase more degree of human, people have to learn. Then all of people especially for muslim people have to take a education start from he was born, until he died.
The definition of education according to the Law of the Republic of Indonesia No.20 of 2003 is:
... Educationis a conscious and deliberate effort to create an
atmosphere of learning and the learning process so that students can
be actively and develop his potential with religious spiritual
strength, self-control, personality, intelligence, noble character, and
skills which needed by him, society, nation and religion1.
In other side, according to Indonesian dictionary a good education is a process to educate students so that it can be useful to the nation. Education is also a process of changing attitudes and code of conduct a person / group of people in a mature business people through teaching and training efforts
2
. So, education is the most important thing that should not be separated from the list of human needs.
How important education is to make us as acandidate of teacher in the future have to improve our skill and to enrich the quality of the strategies, models, innovations and methods to resolve the issue that exists in the world of education, especially in this case researchers focusing in
1
Departemen Pendidikan Nasional. 2003.Undang-Undang Republik Didonesia Nomor 20 Tahun
2003.Jakarta: Balai Pustaka, p. 6
2
Arranged dictionary team. 1996.Kamus Besar Bahasa Didonesia. Jakarta: Balai Pustaka, part of
pieces“P”that educational
mathematics studies. We know that mathematics is what a scary subject according by most students, is the highest difficulty level compared with other lesson in classes3.
Mathematics with all of his problem, have a huge of benefit. Even what a huge of the influence of mathematics on other subjects in school, make math is very important to be learned and understood at every level of education either elementary, middle or high school. And basically mathematics is also included in the national exams (UN), which makes one of the graduation requirements for students4, therefore learning of mathematics material should be completely mastered by the students. In other side, mathematics also has relations with other subjects in the school, certaintly also Indonesianlanguage’ssubjects which discuss about the logic and make a good conclussions, and indirectly also in our life math is always used for example in determining the broad, high and length of a building, counting and so on. It is why we have to learn mathematics.
According to Sumarmo5, There are two visions of learning mathematics, namely: (1) directing the learning of mathematics for understanding concepts are then required to resolve the problem and the other sciences, and (2) to direct into a future that is wider mathematical provide problem-solving abilities, systematic, critical, meticulous, are objective and open. The capability is needed in the face of an ever-changing future.
Seeing the reality of education in Indonesia according to the researcher’s own view, the indonesian’s world education is very alarming. There are still a lot of number which do not fit the standards set by the government, even the unconscious figure of education was relatively large number, because of these become common if there are Indonesian
3
Result of interview with student class X MAN Cirebon 1 at MAN Cirebon 1 on 09.45 WIB
4
http://id.wikipedia.org/wiki/Ujian_Nasional downloaded at 20 juni 2013 on 13:46 WIB
5
Asmar Bani. 2011.Mendigkatkan kemampuan penalaran matematika siswa sekolah menengah
population is illiterate and weak in math. A lot of problems of education include curriculum issues, and basiccally Indonesia is still developing countries will continue to look for the most suitable curriculum implemented in Indonesia. This of course affects the state of education in Indonesia.
Reinforcing problem when there are discrimination between educational scholars of the religious affairs ministry and Educational scholars from the Ministry of Culture and education. We can not pretend to turn a blind eye to this phenomenon. Often we are shocked by the news of rejection PTAIN graduates to participate in the test of CPNS6. Of course this is very troubling, especially for graduates PTAIN. As if the letter 'I' in the title graduate PTAIN S.Pd.I a curse for this PTAIN graduates, whereas the letter 'I' which means that Islam should be the pride of the Muslims in the world.
The same thing also happened in the world of education curriculum in Indonesia, differences of substance between schools under the auspices of the Ministry of Religious Affairs under the auspices of the Ministry of culture and education. This is evident from the study by Izna Maratus Sholikhah7 tell that KTSP’s curriculum that is in SMP and MTS which he compared that no significant differences in the respective syllabus. That is because the syllabus has the same reference MTS also the status of State so he took the subtle differences in practice by a material emphasis each English teacher and student guide books used at each school.
In the reality of education in Indonesia between the school who sheltered in the school Ministry’s Religion and auspices of the Ministry of Culture and Education is have difference. If the note curriculum applied in
6
Result of interview with mr. Kumaedi M.Pd. Chief Madrasah Aliyah Cirebon (MAN Cirebon)1 at MAN Cirebon 1 at 2 may 2013 on 11:45 WIB
7
Izna. M. S.Studi Komparasi Kurikulum Smp Dan MTs. Ponorogo : STADI Ponorogo. At http://iznanew.blogspot.com/2009/03/studi-komparasi-kurikulum-smp-dan-mts.html
different junior secondary schools, seen from the preparation of each school syllabus as an example syllabus attached.
Of the curriculum syllabus appears that for MTs provide loads more lessons because faith-based, compared to SMP curriculum that gives a little more about the science of religion. Then came new problems, whether these differences affect curriculum mathematics achievement of students. While the achievement is not only supported from the IQ of the students but also EQ and owned ESQ students determine the success of a student, certainly in this case MTs is undoubtedly more superior than SMP8. And because it is rooted in the mathematics achievement of students reasoning, the writer is interested to analyze the level of students' mathematical reasoning based on educational background. Other fields of other locusts, another down another fish, another another school curriculum as well, due to differences in curriculum and whether this impacts on different levels of' mathematical reasoning”s student.
In MAN Cirebon 1, based on observation in PPL II, there are student with has background of education from MTs have higher mathematical reasoning than student with backgroun of educational in SMP. So, there are a contradiction wich a goverment stats that education based on culture and education ministry is better than education based on religious ministry.
In addition educators in MTs are not only recruited from graduates PTAIN but also of PTN, whereas only a junior educators recruited from graduates of state universities9. It is like a double-edged sword, ie, MTs have the advantage of having a more diverse teacher because of the ability of the teachers could come from all universities, on the other hand is a graduate of the Ministry of Religious Affairs who should have more power even underestimated by the government as if there is a gap between the
8
Aldi Mustaqim. 2012. PENERAPAN METODE GALLERY WALK DAN SMALL GROUP
DISCUSSION DALAM MATA PELAJARAN AL-QUR’AN HADITS DI MADRASAH ALIYAH
NEGERI (MAN/MA).Batu Sangkar : STADI Batu Sangkar. di http://syafrisalmi.wordpress.com/ downloaded on 31 june 2013 on 12:34 WIB
9
Departmen of Religion and the Ministry of Education, which graduates can enter the Departmen PTN whereas religion is not to the contrary.
Based on the above, the authors wanted to examine further the extent to which differences in educational background affects the level of students' mathematical reasoning. Therefore the authors are interested to research the level of mathematical reasoning of student based on their former educational background.
B. Identification of Problems
Based on the problems mentioned above, we can identify the problem as follows:
1. Figures aware that education is still low in Indonesia 2. Math is scarry subject for most students
3. The average mathematical ability in Indonesia is still weak 4. Indonesia is likely to change curriculum-fox.
5. Curriculum between MTs and SMPis different 6. In MTs load more lessons than SMP
7. Educators between SMP and MTs has different educational background 8. Number of hours of religious instruction in MTs far more than the SMP 9. There is a gap between the Ministry of Religious Affairs and the Ministry
of Education in Indonesia
10. Graduates from PTN acceptable not only in the Ministry of Education but also the Ministry of Religious Affairs, while for graduates of the Ministry PTAIN only accepted religion.
C. Limitations of problems
1. Educational background of students referred to in this study were grouped into two, namely of MTs and SMP. Mathematical reasoning here is the ability to think deductively and inductively
2. The material tested was a matter of MTs and junior class 1 (one) to Class 3 (two) taken at random as needed. Research conducted on the class X MAN Cirebon 1 Academic Year 2012/2013.
D. Problem Formulation
From the descriptions above can be formulated several problems to be studied, among others:
1. How is Mathematical Reasoning level students?
2. Is there the differencce of level of student’s mathematical reasoning between student who have educational background in SMP and MTs?
E. Research Objectives
In general, this research aims to determine the extent to which factors affect the educational background of students' mathematical reasoning level. While this research specifically conducted to determine:
1. To measure the level of students' Mathematical reasoning that MTs educational background;
2. To measure the level of reasoning that students Mathematics background junior high school education;
F. Use of Research
In this study there are several uses / benefits include: 1. For Students
a. Provide information regarding the extent to which the educational background influence the level Reasoning Math students.
b. Raise awareness of the importance of reasoning in learning mathematics.
c. Provide new experiences on mathematical reasoning. Improve Math students through reasoning and discussion about the test.
2. For Teachers
a. Provide information regarding the extent to which the educational background affect Mathematical Reasoning level students
b. in order to be used as guidelines in the face of different students educational background.
c. Provide an alternative way of teachers in identifying students' level of reasoning.
d. Can be used as a reference material for consideration to undertake class action effort. For the world of education in Indonesia
e. Provide information regarding the extent to which the educational background influence the level Reasoning Math students.
f. Can be used as a reference material for consideration in developing the curriculum in Indonesia.
3. For Researchers
CHAPTER II
THEORETICAL FRAMEWORK
A. Theoretical Description 1. Mathematical Reasoning
Reasoning by Cleanth and Robert Penn Warren in his work entitled Modem Rhetoric as cited by Effendi OU in Maemunah thesis10, that reasoning is Process by roomates the mind moves from certain the data (evidence) to a conclusion. In other words, the reasoning is essentially the process of nets mind of a data or facts to conclusion.
While the reasoning according to Copi11 "Reasoning is a special kind of thinking in roomates inference take place, in roomates ar Conclusions drawn from premises". In other words, reasoning is an activity, process, or activity thought to draw a conclusion or make a new statement is true based on statements that were correct have been proven or assumed previously.
According Keraft12 reasoning is a process of thinking that seeks connection between the facts or evidences are known towards a conclusion. Reasoning requires logic foundation that is not a process of remembering, memorizing, or delusional but is a series of processes before looking for other information.
Reasoning ability make students able to solve problems in their life, inside and outside of school. Whenever we use reasoning to evaluate our thinking, then we increase the confidence with mathematics and thinking mathematically.
So it can be concluded that the reasoning is one of the basic mathematical competencies in addition to understanding, communication,
10
Maemunah. 2012. Pengaruh kemampuan penalaran matematika terhadap kemampuan
komunikasi matematika siswa.Thesis is not published. Cirebon : IAIN Syekh Nurjati Cirebon.
11
F shadiq. 2007.Penalaran atau reasondig : Mengapa perlu dipelajari siswa di sekolah. at http://fadjarp3g.files.wordpress.com/2007/09/ok-penalaran_gerbang_pdf. downloaded at 02 february 2013 on 13:43 WIB
12
ibid
connections, and problem solving. Reasoning is also a mental process in developing the minds of some of the facts and principles. Reasoning is also a thinking process or activity to draw a conclusion or thought processes in order to make a new statement that was based on a statement whose truth has been proven or assumed previously.
Mostly there are two types of reasoning, divide as13: a. Deductive Reasoning
A thinking process to draw conclusions about specific things that rests on the general or it has previously been shown were correct. Deductive argument can be used to obtain a valid conclusion. On the use of deductive reasoning consistency and consistency logic mind.
b. Inductive reasoning
A thinking process to draw general conclusions about which is based on the particulars. Inductive argument used to derive robust conclusions. On inductive reasoning, of the truth of a particular case can be summed up the truth for all cases. According Sumarmo in Totoni14, reasoning can be classified into two types, divide as inductive reasoning and deductive reasoning. Inductive reasoning can be interpreted as the conclusion of a general nature or specifically based on the observed data. Truth value of an inductive argument can be either true or false. Its activities include:
a. Transduktive:
Draw conclusions from a single case or a specific nature that is applied to other special cases.
b. Analogy:
Drawing conclusions based on the similarity of data or processes. c. Generalization:
Drawing general conclusions based on a number of data observed. d. Estimating answers, solutions, or the tendency
13
Lehmann, S. 2001. A Quick Ditroduction to Logic. At http://www.ucc.ucon.edu/wwwphil /logic.pdf downloaded at 17 juni 2013 on17.32 WIB
14
Totononi ,Muhammmad. 2012. Perbandingan Kemampuan Penalaran Matematika pada
e. Give an explanation to the model, the facts, nature, relationships, or patterns that exist
f. Using the pattern of relations to analyze the situation and formulate a conjecture
Then, deductive reasoning is drawing conclusions based on agreed rules. The truth value of deductive reasoning is absolutely true or false and not both together. Some of the activities belonging to the deductive reasoning are:
a. Carry out calculations based on certain rules or formulas.
b. Draw logical conclusions based on inference rules, check the validity of the argument, prove, and make the argument valid.
c. Arrange direct proof, indirect proof and proof by mathematical induction. About the students' report card indicators outlined in reasoning ability, if students are able to15:
a. Have prediction
b. Perform mathematical manipulations
c. Compile evidence, giving reasons or evidence for the truth of the solution d. Draw conclusions from the statement
e. Check the validity of the statement
f. Discovering patterns or mathematical nature of symptoms to make generalizations.
As mentioned previously, reasoning in mathematics is difficult to separate from the rules of logic that mean inductive thinking16, abot skill of mathematical reasoning indicator according Sumarmo17, indicators that include the mathematical reasoning ability, namely:
a. Make analogies and generalizations, b. Provide explanations using models,
c. Use patterns and relationships to analyze mathematical situations,
15
Law of Dirjen Dikdasmen Depdiknas Number 506/C/Kep/PP/2004 on 11 Nopember 2004
16
http://10310242.blogspot.com/2011/10/mendigkatkan-kemampuan-pemahaman-dan.html downloaded at 01-11-12 on10:37 WIB
17
d. Formulate and test conjectures, e. Check the validity of arguments, f. Formulate direct evidence, g. Formulate indirect evidence, h. Provide examples of denial, and i. Follow the rules of inference.
Mathematical reasoning is needed to determine whether a mathematical argument is right or wrong and also used to construct a mathematical argument. Mathematical reasoning is not only important to prove (proof) or inspection program (program verification), but also to perform inference in a system of artificial intelligence (artificial intelligence / AI)18.
There are several terms that will be used in mathematical reasoning is often used and are familiar in mathematical reasoning that evidence, inference, theorem, lemma, corollary and conjecture (conjecture). Mentioned in the previous explanation of the rules of inference.
The inference rules or the rules of inference are: a. Ponen mode (law of detachment)
Written or denoted as follows: qp
p q
Symbol “" read ”so”. Ponents states : if the hypothesis p and
implication pq is true, the conclusion q is true, Example:
“if 16 runs in the second, then 16 is an even number"
If the write inference, then:
if 16 runs in the second, then 16 is an even number 16 runs in
the second 16 is an even number
18
b. Tollen mode Written by:
qp
~ Q ~ p
Tollen mode states: if the hypothesis ~ q and pq is true, so the
conclusion ~ p is true. Example: "if n is an odd number, then the value n2odd"
If the write inference, then:
if n is an odd number, then n2odd value n2is worth even
n is not an odd number
c. Syllogism Hypothesis Denoted by:
qp
rq rp
This syllogism states : if the hypothesis q r and p q is true,
then the conclusion p r is true. For example: "If I study hard,
then I will pass the exam" and "If I pass the exam, then I bought a new bag"
If the write inference, then:
If I study hard, then I will pass the exam if I pass the exam, then I bought a new bag
if I study hard, then I bought a new bag.
qp
~ P
q
Disjunctive syllogism states: if the hypothesis ~p and p ∨q is true, then the conclusion q is true. For example: "I study hard or I bought a new bag"
If the write inference, then:
I study hard or I get married next year I did not study hard
I'm getting married next year
e. Simplification Denoted by:
qp p
Simplification mode states: if p and q hypothesis, whereas p is the conclusion. Example: "Agus was IAIN students and students majoring in Mathematics"
If the write inference, then:
Agus is IAIN students and students of Mathematics
Agus is a student of IAIN
f. Addition Denoted by: p
qp
Summing example "slamet take discrete mathematics course" If the write inference, then:
Slamet take discrete mathematics course
Slamet take math courses or repeat courses algorithm diskirt
P Q qp
Example: "Dewi take discrete mathematics course" and "Dewi repeat study applied mathematics"
If the write inference, then:
Dewi take discrete mathematics course repeat courses of applied mathematics
Dewi take discrete mathematics course and repeat courses of
applied mathematics
2. Educational Background
As mentioned in previous chapters, educational background is in the present study is the Junior Secondary which has a different curriculum can be viewed in terms of the syllabus for each of them.
As according to the results of research that Izna Maratus Sholikhah19
At SBC curriculum that is in SMP and MTS which he compared that no significant differences in the respective syllabus. That is because the syllabus has the same reference MTS also the status of State so he took the subtle differences in practice by a material emphasis each English teacher and student guide books used at each school.
Althogh in the difference of amount of time in learning mathematics in both of institution is limit to zero, but in other subject there are huge difference. It is caused by in MTs students have to learn about religious aspect, of course it is hard working for student. But in other side, in SMP the amount of time of learning about religious is less than in MTs.
To make it easier in describing, Structure can be seen from the following syllabus:
19
Table 2.1 Syllabus MTs.20
Class components and Time Allocation
Komponen Kelas dan Alokasi Waktu VII VIII IX A. Mata Pelajaran
1. Al-Qur’an Hadis 2 2 2
1. Aqidah Ahlaq 2 2 2
1. Fiqih 2 2 2
1. Sejarah Kebudayaan Islam 2 2 2
5. Pendidikan Kewarganegaraan 2 2 2
6. Bahasa Indonesia 4 4 4
7. Bahasa Arab 2 2 2
9. Bahasa Inggris 4 4 4
10. Matematika 4 4 4
11. Ilmu Pengetahuan Alam 4 4 4
12. Ilmu Pengetahuan Sosial 4 4 4
13. Seni Budaya 2 2 2
14. Pendidikan Jasmani, Olahraga dan
Kesehatan
2 2 2
15. Keterampilan/Teknologi Informasi dan
Komunikasi
2 2 2
B. Muatan Lokal
1. Bahasa Daerah
2. Muhadoroh
3. Baca Tulis Qur’an
4. Bimbingan Sholat
1. Pengembangan Diri 2*) 2*) 2*)
Total 42 42 42
Table 2.2. SMP syllabus21
.
Komponen
Kelas dan Alokasi Waktu
VII VIII IX
A. Mata Pelajaran
1. Pendidikan Agama 2 2 2
2. Pendidikan Kewarganegaraan 2 2 2
3. Bahasa Indonesia 4 4 4
4. Bahasa Inggris 4 4 4
5. Matematika 4 4 4
6. Ilmu Pengetahuan Alam 4 4 4
7. Ilmu Pengetahuan Sosial 4 4 4
8. Seni Budaya 2 2 2
9. Pendidikan Jasmani, Olahraga dan Kesehatan 2 2 2
10. Keterampilan/Teknologi Informasi dan
Komunikasi
2 2 2
B. Muatan Lokal 2 2 2
C. Pengembangan Diri 2*) 2*) 2*)
Total 32 32 32
From the above two tables it can be seen that the allocation of time to teaching mathematics in junior secondary schools differ, in junior time allotted more than in MTs.
21
B. Overview of Relevant Research Results
Research relevant to the study conducted by researchers are:
1. Comparison of Mathematical Reasoning Ability in use Ikuiri and Expository Methods in Learning Mathematics, by Shaykh Muhammad Totoni Students IAIN Nurjati Cirebon Ministry of Mathematics force Tadris 2012, prepared for the graduation requirement S1. The results of the use of methods of inquiry stated penelitianya better than using Expository method in developing students' mathematical reasoning22. 2. The results under the title Mathematics Learning Method Using Improv
To Improve Student Mathematical Reasoning Ability SMP. By Darmawan Sutarji academic year 2009 is used for the thesis, Ministry of Mathematics Education FPMIPA Indonesia University of Education (UPI). Hasi study suggested an increase in the students' reasoning Improve methods, mathematical reasoning skills students gain in the index data quality improvement data is categorized as 85% moderate and high 15%23.
3. Mathematical Reasoning ability eighth grade students of SMP Negeri 3 Banguntapan In Mathematics Learning Through Realistic Mathematics Education Approach Indonesia (PMRI), by Widayanti Nurma on in 2010, which is used for the thesis Ministry of Mathematics Education, Faculty of Mathematics and Natural Sciences, University of Yogyakarta country. Results of his research is applied learning school mathematics using PMRI approach increased students' mathematical reasoning ability class VIII-A SMP Negri 3 Banguntapan24.
22
Totoni Muhammad. 2012. Perbandingan Kemampuan Penalaran Matematika pada
Penggunaan Metode Ikuiri dan Ekspositori dalam Pembelajaran Matematika. Thesis not published Cirebon : IAIN Syekh Nurjati Cirebon .
23
Darmawan Sutarji . 2009. Pembelajaran Matematika Dengan Menggunakan Metode Improve
Untuk Mendigkatkan Kemampuan Penalaran Matematika Siswa SMP.thesis not published. Bandung : FPMIPA Universitas pendidikan Didonesia (UPI).
24
Widayanti Nurma.2010. Kemampuan Penalaran Matematis Siswa kelas VIII SMP Negeri 3
By the three studies above have in common with the research examined by the author. But from their full no exact studies examined by the authors examine "Mathematical reasoning" with relation to "the educational background of students in the previous level". Therefore research " The Level of Mathematical Reasoning of Students based on Background of Student’s
Educational Before " worth doing because it is not a duplication or plagiasi of existing research before.
C. Framework of Thinking
Mathematics is a science that must be possessed by every human being, because in living life on earth can not be separated from the calculations and operations Mathematics. Since it started when we wake up until we go back to sleep is always the name of mathematics stuck in our activities. Even in our relegious activities to God we were not always able to regardless of Mathematical calculations, everything is has a calculation. Math is what makes it very important to learn. However, most students considered mathematics is the most difficult subject matter, so many are reluctant to enter the world of mathematics. Absolute mathematical fact must be mastered by the students, especially math is one of the materials tested on the national exams that determine student graduation.
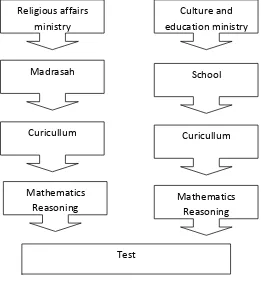
To master the math necessary to train mathematical reasoning ability, therefore the author will review a little more about this mathematical reasoning ability. As has been reviewed in the previous chapter that the world of education in Indonesia is divided into two camps, the camp of the Ministry of Religion and from the Ministry of Education who gave birth to two different curricula. From two different curricula logic will generate two different beings.
So, the authors wanted to analyze the level of student reasoning based on educational background. Departing from previous studies by measuring Izna that Sholikhah Maratus25At SBC curriculum that is in SMP and MTS which he
25
compared that no significant differences in the respective syllabus. That is because the syllabus has the same reference MTS also the status of State so he took the subtle differences in practice by a material emphasis each English teacher and student guide books used at each school. From here the authors draw a hypothesis that the effect of educational background on students' level of mathematical reasoning. As for the scheme I use is as follows:
Figure 2.1. Scheme framework
Referring to the theoretical description, educational background quite an impact in mathematical reasoning. So based on the above descriptions it can be concluded that the level of students' mathematical reasoning close relationship with the educational background of the students themselves. Then the extent to which the educational background of pot affect the ability of students' mathematical reasoning. Therefore researchers wanted to analyze the level of student reasoning based on educational background.
Religious affairs ministry
Curicullum Madrasah
Mathematics Reasoning
Curicullum School Culture and education ministry
Mathematics Reasoning
D. Hypothesis
Based on the theoretical framework and the framework as described above, then the hypothesis proposed in this study are:
CHAPTER III RESEARCH METHODE
A. Place and Time of research 1. Place of Research
This study will be conducted at MAN Cirebon 1 which located in Cirebon city at Crossroad Post Office Weru No. 36, Cirebon district. That will be made to the students of class X
2. Research time
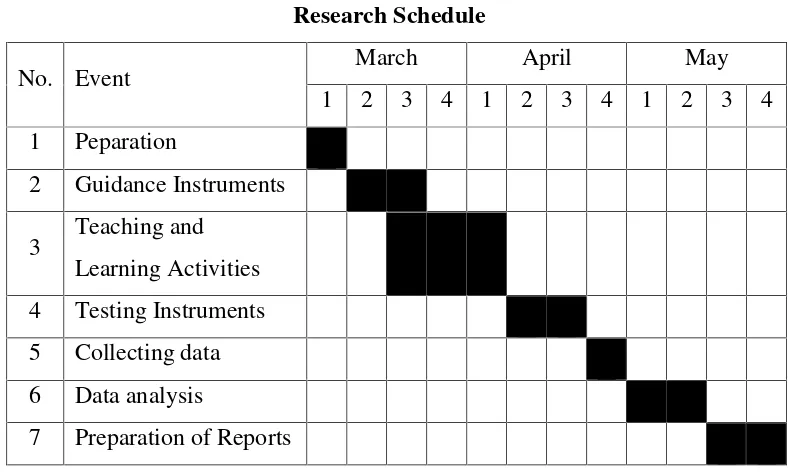
The time required from the preparation stage to the stage of writing that is expected during the three months from March to May 2013.
Table 3.1 Research Schedule
No. Event March April May
1 2 3 4 1 2 3 4 1 2 3 4 1 Peparation
2 Guidance Instruments
3 Teaching and Learning Activities 4 Testing Instruments 5 Collecting data 6 Data analysis
7 Preparation of Reports
B. Methods and Desain of Research 1. Research methods
According to Sugiyono26, basically scientific research methods is a way to get the data with the purpose and usefulness. This type of
26
Sugiyono. 2013.Metode Penelitian Pendidikan.Bandung: Alfabeta, p. 3
research is a quantitative study that uses the case study method. Because this study was to measure the presence or absence of the influence of a variable to another variable. Case study method is to analyze a case which occurred in nature without the intervention of the researcher.
2. Research Design
The study design is a design in a study. It is therefore necessary to design appropriate circumstances. The design used is as follows:
Description: X: Education
Y: Reasoning math students
The relationship that shows the influence of Stage in this research is divided into four (4) stages: preparation, execution, processing, preparation. Breakdown of these stages are as follows: a. First is the preparation stage. Performed at the preparation stage
include :
1) choosing the problem and determine the title.
2) Find materials and information relating to research that will be investigated.
3) Preparation of the proposal, sign up seminars, seminars and revision of proposals.
4) Sign up to request the appointment of SK and research mentors. 5) Process of consultation with the supervisor while asking IPD to be
tested.
6) Go to the location of the study with the intention of: introducing yourself, submit a cover letter and study schedule.
7) Data processing test results.
b. Implementation stage, the stage to collect the data necessary research through questionnaires and tests.
c. Data processing stage, the stage where the data were analyzed manually or by using the computer program and draw tentative conclusions.
d. The last stage is the stage of writing and compilation of the results of the full study report.
C. Population, Sample and Data Collection Techniques Population
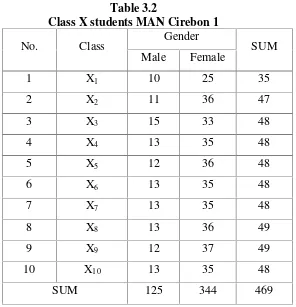
Table 3.2
Class X students MAN Cirebon 1
No. Class Gender SUM
Male Female
1 X1 10 25 35
2 X2 11 36 47
3 X3 15 33 48
4 X4 13 35 48
5 X5 12 36 48
6 X6 13 35 48
7 X7 13 35 48
8 X8 13 36 49
9 X9 12 37 49
10 X10 13 35 48
SUM 125 344 469
Population is a generalization area consisting of: object or subject that has certain qualities and characteristics are determined by investigators to be studied and then drawn conclusions27. The population in this study were all students of class X MAN Cirebon 1, amounting to 469 students28.
27
Sugiyono.Op. Cit,p. 117
28
2. Samples
Sample is a small group that significantly we are careful and we draw conclusions. With all the limitations researchers sampling technique used in this study is a cluster random sampling. Cluster random sampling is used when the population of a group (cluster), instead of the individual subject.
Sampling was done by cluster random sampling from a normal population is assumed to be homogeneous with consideration of the students sitting in the same grade level, students have the same ability, based on the material being taught from the same curriculum. The populations were scattered in 9 classes, randomly selected 30 students with an educational background MTs and 30 students with the educational background of junior high school.
D. Research variables 1. Conceptual definition
a. Educational background variables (X)
Background history of education is the education of students before entering the study with higher levels. As in this study pursed into junior and junior.
b. Variable mathematical reasoning’s student(Y)
Mathematical reasoning skills students are students' skills in mathematics, namely:
1) Make analogies and generalizations, 2) Provide explanations using models,
3) Use patterns and relationships to analyze mathematical situations,
4) Check the validity of arguments,
5) Arrange direct proof, indirect proof Develop,
2. Operational Definitions
a. Student's educational background variables (X)
Educational background is in the study was the level of junior high school (SMP) and junior secondary madrasah (MTs).
b. Variable mathematical reasoning skills students (Y)
Mathematical reasoning ability of students is the total score obtained by students after working on the mathematical reasoning test given researchers.
E. Data Collection’sTechniques and Instrumentation
Data Collection Instrument (IPD) is a tool to collect data on some variables that will be used for research needs. On the selection and preparation of IPD should be tailored to the type of research conducted. On this research, type of research is a quantitative approach to research data used instrument is the written test.
Collecting data about students' backgrounds through the documentation of the data that was available. As for the reasoning level of students' data collection is done through tests of mathematical reasoning abilities. The instrument is a description of the test sheet. In the tests the students 'level of mathematical reasoning using multilevel scoring technique (graded) according to the students' responses to the indexs. The criteria category scores were used in the test of mathematical reasoning can be found in appendix.
Then tests performed through the following steps: 1. Latticework construction
Table 3.3
The General Latticework of Instrument
Research Variable Technique Instrument Data Source Mathematical
reasoning
Testing Test index Student as object
Whereas special latticework is latticework which made for describe indexs design which will arranged for enclosed instrument. 2. Content validity by Expert Judgment
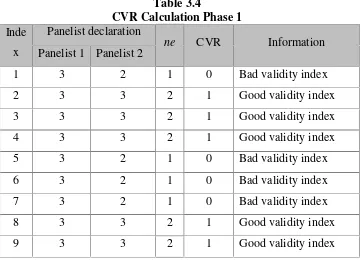
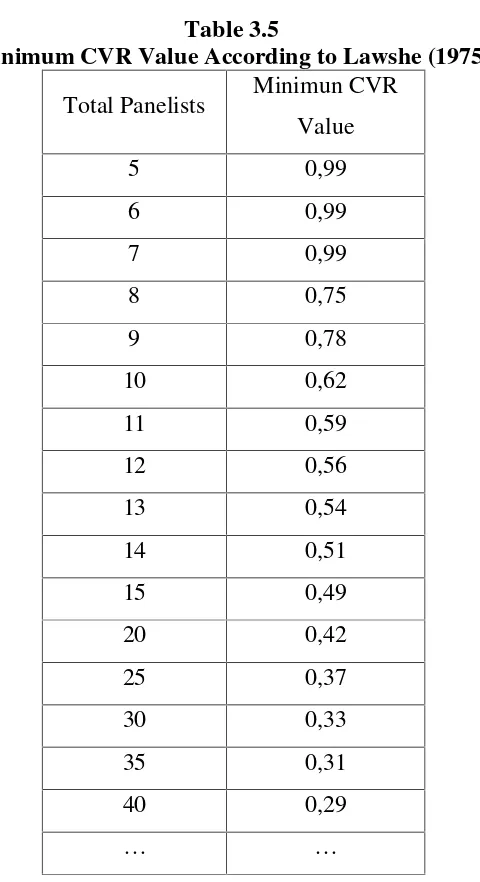
Validity is a related concept with how far the test measuring what must measured. This research will use validity content by expert judgment where index of the test which have made proposed to some panelist and the panelist will give their judge to the index of the test about the appropriate between index of the test and indicators which have made by the researcher. In this research index of the test proposed to two panelists, the panelist will give their judgment with give “1” if the index of the test is not appropriate with the indicator, “2” if index of the test is important but still not appropriate with the indicator, and “3” if index of the test is appropriate with the indicator. The result of two panelists judgment will processed used quantitative approach to estimate index of the test validity using Content Validity Ratio (CVR) like written by Lawshe (1975). The formula of CVR is
= ( −
2)/(2)
Or can be written as
= 2 − 1
Table 3.4
CVR Calculation Phase 1 Inde
x
Panelist declaration
ne CVR Information Panelist 1 Panelist 2
1 3 2 1 0 Bad validity index 2 3 3 2 1 Good validity index 3 3 3 2 1 Good validity index 4 3 3 2 1 Good validity index 5 3 2 1 0 Bad validity index 6 3 2 1 0 Bad validity index 7 3 2 1 0 Bad validity index 8 3 3 2 1 Good validity index 9 3 3 2 1 Good validity index
Information Judgment codes:
3 : panelist judge that index of the test appropriate with the indicator
2 : panelist judge that index of the test is important but not appropriate with the indicator
1 : panelist judge that index of the test is not important
ne : total of panelists who judge that index of the test appropriate with the indicator
Table 3.5
Minimum CVR Value According to Lawshe (1975) Total Panelists Minimun CVR
Value
5 0,99
6 0,99
7 0,99
8 0,75
9 0,78
10 0,62
11 0,59
12 0,56
13 0,54
14 0,51
15 0,49
20 0,42
25 0,37
30 0,33
35 0,31
40 0,29
… …
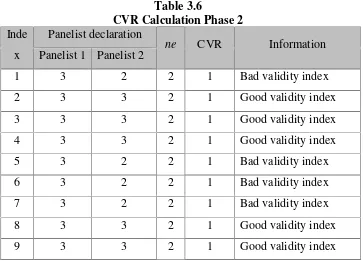
Table 3.6
CVR Calculation Phase 2 Inde
x
Panelist declaration
ne CVR Information Panelist 1 Panelist 2
1 3 2 2 1 Bad validity index 2 3 3 2 1 Good validity index 3 3 3 2 1 Good validity index 4 3 3 2 1 Good validity index 5 3 2 2 1 Bad validity index 6 3 2 2 1 Bad validity index 7 3 2 2 1 Bad validity index 8 3 3 2 1 Good validity index 9 3 3 2 1 Good validity index
Information Judgment codes:
3 : panelist judge that index of the test appropriate with the indicator
2 : panelist judge that index of the test is important but not appropriate with the indicator
1 : panelist judge that index of the test is not important
ne : total of panelists who judge that index of the test appropriate with the indicator
3. Empiric try-out
In this study, will be used with the 10 question written test descriptions. These questions more specifically the problems of mathematical reasoning. The questions used in this study are the questions researchers are tailored made to the existing indicators. As a trial, the researchers will share the test that had been developed to grade 1 with X2 MAN Cirebon without attention to the educational background of them.
a. Reliability estimation
Reliability is a measure of regularity of an instrument to obtain information. Reliability of the tests used in this research was calculated by using the software AnatestV4. The formula of AnatestV4 which used to estimate reliability is Spearman-Brown’s formula to the split second method according to Arikunto (2010).
= 2
1 +
With:
= Reliability of the test as a whole
= Correlation between test scores of each hemisphere Table 3.7
Interpretation of Reliability
Correlation Coefficient Reliability Criteria
0,81≤ r ≤ 1,00 Very High
0,61≤ r ≤ 0,80 High
0,41≤ r ≤ 0,60 Enough
0,21≤ r ≤ 0,40 Low
0,00≤ r ≤ 0,20 Very low
b. Index Discrimination
Index discrimination is the ability of indexs to discriminate students on the student top group and under group. Figures which show the amount of the difference is called index discrimination (D). Index discrimination of every index of the test in this research was calculated by using the software AnatestV4. The formula which used in AnatestV4 to measure index discrimination is the formula by Arikunto as follows29
:
= − = −
With:
J = Total of participants test
= Total of participants on the group = Total of participants under the group
= Total of the group of participants who answered the question correctly
= Total of participants under the group who answered questions correctly
Arikunto said that to interpret index discrimination of an instrument obtained by looking at the following table 3.4.
Table 3.8
Interpretation of Index Discrimination Coefficient Index Discrimination
Criteria
0,70≤ D ≤ 1,00 Excellent
0,40≤ D ≤ 0,69 Good
0,20≤ D ≤ 0,39 Enough
0,00≤ D ≤ 0,19 Bad
D < 0,00 Discard
29
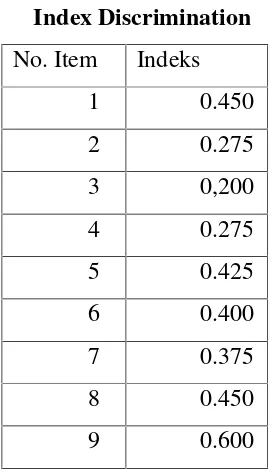
According to the calculation by using Anates V4 program, the result of the index discrimination each index is
Table 3.9 Index Discrimination No. Item Indeks
1 0.450
2 0.275
3 0,200
4 0.275
5 0.425
6 0.400
7 0.375
8 0.450
9 0.600
From the result of calculation of index discrimination for mathematical
reasoning’s intrument is there are 2 grade, such as enough index number 2, 3, 5
and 8. Then good index in number 1, 4, 6, 7, 9 and 10 . (The results of the calculations can be seen in Appendix C.3)
c. Index difficulty
Index difficulty is the ability of indexs to discriminate students on the student group under group. Figures show the amount of the difference is called the index of discrimination (D). the difficulty each of the indexs used in this study was calculated by using programAnates V4. At Anates V4 formula used to calculate the distinguishing difference is the formula by Arikunto as follows:
=
With:
P = Index lurch
JS = Total number of participants of the test
Index difficulty of an index of the test is between 0.00 to 1.00. According to Arikunto (2009) the interpretation of index difficulty served in table below.
Table 3.10
Interpretation Index of Dificulty
The difficulty level Index Difficulty
0,00≤ IK ≤ 0,29 Difficult
0,30≤ IK ≤ 0,69 Medium
0,70≤ IK ≤ 1,00 Easy
The results of the index difficulty calculations described that index 1 was easy index, index 2 and 3 were difficult index, and index 4 was medium index. The results of the calculations can be seen in Appendix.
Based on calculations using the program Anates V4 distinguishing index obtained by the following indexs:
Table 3.11 Index Difficulty No. Butir Indeks
From Table 3.11 breaks we can know the results of the calculation of the level of difficulty for mathematical reasoning abilities instrument acquired several criteria problem, namely about being number 1, 2, 3, 7, 8, 9, and 10. And about the simple matter of numbers 4, 5, and 6. (The results of the calculations can be seen in appendix C.5)
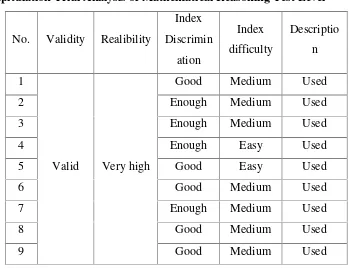
4. Recapitulation Trial Analysis of Mathematical Reasoning Test Level By using expert judgment and content validity testing result is the overall description of the proposed test questions on expert apparently valid. So that all the questions used in this study has good content validity. As for the empirical test, researchers used the program Anates V4, reliability estimates showed a significantly high ratio of 0.96 is included in the very high category. As for the level of difficulty distinguishing power and use also use Anates V4 following indexs recapitulation analysis obtained Anates V4 program is presented in tabular form.
Table 3.12
Recapitulation Trial Analysis of Mathematical Reasoning Test Level
No. Validity Realibility
2 Enough Medium Used
3 Enough Medium Used
4 Enough Easy Used
5 Good Easy Used
6 Good Medium Used
7 Enough Medium Used
8 Good Medium Used
F. Data Analysis Techniques 1. Prerequisite test
a. Normality Test
Normality test is used to test whether the data were normally distributed or not. If the data are normally distributed, it can be analyzed using parametric statistics. If not then it can be used non-parametric statistics.
Normality test can use kolmogorov-Smirnov formula, with the value of statistics test is D, and the value of D is:
D =Supx| ( ) − ( )|
Description:
D: maximum absolute deviation value
Fn: commutative empirical distribution function
F: theoretical opportunities commutative function and normal distribution
The hypothesis used is:
H0: The data came from a normally distributed
population
Ha: The data come from the population distribution is not
normal
Normality testing criteria used are:
if the probability / significance / value of P <0.05 then abnormal data. If the probability / significance / P value> 0.05 then the data is normal.
In the process of this reaserch the normality test examiners using SPSS 19. The steps to test normality using SPSS 19 as follows:
2. Input data according to the column variable. Click the option and check the normality test.
3. Click the Plot button.
4. Click the normality with plot 5. Click ok
On the Kolmogorov-Smirnov Test output, if the significance value> a normal data means, if the value of significance <a then the data is not normal.
b. Homogeneity test
Homogeneity test used to determine whether some variants of data homogeneous population or not. To test Levene homogeneity can use the formula, namely:
= ( − ) ∑ ( − … )
( − 1) ∑ ∑ ( − )
Description:
L: Value Levene count
X: The value of the data residuals : Average residual
N: number of samples K: number of groups
if the value of Levene count <Levene table or the value of L> 0.05 then the data is homogeneous.
The testers in this study using SPSS 19. The steps to test the homogeneity by using SPSS 19 as follows:
1. Click Analyze - Comphare Means - One-Way ANOVA, and then input the data according to the column variable 2. Click on Options, mark the homogeneity of variance test 3. Click Continue–OK
Testing criteria as follows:
2. If the significance value <a, the data are not homogeneous
The formulation of the hypothesis is formed:
H0: The two groups of data populations have the same
variance or (homogeneous).
Ha: Two groups of data populations have unequal variances
or (heterogeneous).
2. Hypothesis Testing (T test)
T test aims to determine whether the partial effect of independent variables on the dependent variable. For the t test using the formula:
= ̅ − ̅
( − 1) + ( − 1)
+ − 2
1 + 1
Description:
̅ : Average mathematical reasoning students an educational background in junior high
̅ : Average mathematical reasoning students educational background MTs
S: Variance
n1: number of students with educational backgrounds SMP
n2: number of students with an educational background MTs
The hypothesis of this test is:
H0: There are no difference of mathematical reasoning of student
between students with a background of educational in SMP and student with a background of educational in MTs.
Ha: There are difference of mathematical reasoning of student
Or in other words, we can make statistical hypothesis of this study, namely:
H0: μ 1 = μ 2;
Ha: μ 1 ≠ μ 2;
Description:
μ 1: Mathematical Reasoning of students with the educational
background of SMP
μ 2: Mathematical Reasoningof students with the educational background of MTs
With hypothesis testing criteria:
1. If -ttabel <t <ttable, then Accept H0, means no difference in
the level of students' mathematical reasoning among students with junior high education background and students with educational backgrounds MTs.
2. If t> t table-t>-t table, then reject H0, means that there are differences in the level of students' mathematical reasoning among students with the educational background of junior high schools and students with the educational background of MTs.
The T Test testing in this study using SPSS 19 with the following steps:
1. Click Analyze - Comphare Means - independent-sample T test, then will open the dialog box Independent sample T test.
2. Click the variable mathematical reasoning and then inserted into the test box vaiable. Then the input variables on the educational background grouping variable box. Then select Define Group is 1 to 1 and 2 to 2. Obviously with already pass variable data labeling prior to the student's educational background.
CHAPTER IV
RESULTS AND DISCUSSION
This chapter will discus about the research results obtained from the research conducted. This study will present the results of data analysis the test of the level of mathematical reasoning of students based on background of student’s educational before in this case is the MTs and SMP. A. Data Description
1. Educational Background of Students
Data about the student's educational background obtained from interviews with staff TU in MAN Cirebon 1. Interview conducted on March 26, 2013 at 14:15 pm. This interview was conducted in order to minimize the time and also more practical untunk determine the distribution of educational backgrounds of students MAN Cirebon 1 particular class X of the school year 2012/1013. (For more details see the appendix D.1)
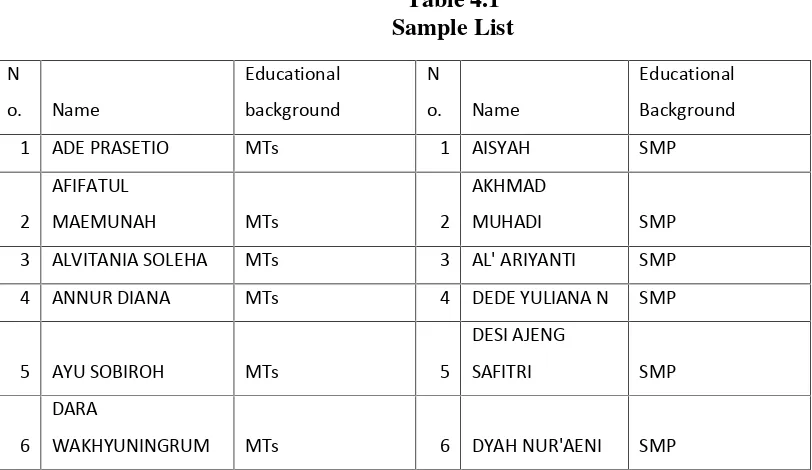
The following table is presented of the results of documentation and interviews with staff TU in MAN Cirebon 1 related to the educational background of students who want to investigate.
Table 4.1
1 ADE PRASETIO MTs 1 AISYAH SMP
2
AFIFATUL
MAEMUNAH MTs 2
AKHMAD
MUHADI SMP
3 ALVITANIA SOLEHA MTs 3 AL' ARIYANTI SMP
4 ANNUR DIANA MTs 4 DEDE YULIANA N SMP
5 AYU SOBIROH MTs 5
DESI AJENG
SAFITRI SMP
6
DARA
WAKHYUNINGRUM MTs 6 DYAH NUR'AENI SMP
7 EKO PUTRA M MTs 7 FIKRIYAH SMP
8 FAKIH ANWAR MTs 8
FRISCA DEWI
LESTARI SMP
9 FATIMAH MTs 9
HALIMAH
SA'DIYAH SMP
10 FITRIYAH MTs 10 HANITA SMP
11 KHUNUL HAJIBAH MTs 11
IBROHIM
BARDAN SMP
12 LILIS ROLYAH MTs 12 IQBLA WIDYANTO SMP
13 LINDA ASHARI MTs 13 KHUMAEROIH SMP
14 LU'LUATUL A MTs 14 KURNIAWATI SMP
15 M FAHRUL FAOZAN MTs 15 LENI YULIANTI SMP
16 MIFTAHUL JANNAH MTs 16
LUTFI AJI
SAPUTRA SMP
17 MOH UBAEDILLAH MTs 17 MOH HAFIDZIN S SMP
18 MUH ABDULANI MTs 18 NONI SMP
19 PEGI YULIAWATI MTs 19 NUR HASANAH SMP
20 ROIKHATUL JANNAH MTs 20
OVIE NUR
22 SITI FACHTIYATUL K MTs 22 RUMINA SMP
23 SITI KHUMAEROH MTs 23 SAPUTRA ANURU SMP
24 SITI ROFIQOH MTs 24 SILVIA INTAN SMP
25 SITI ROMLAH MTs 25 SITI AZIZAH SMP
26 SOLIKHIN MTs 26 SITI JUHAERIYAH SMP
27 SUNOTO MTs 27 SITI SOLECHA SMP
28
ULFA HANIFA
ROSIDAH MTs 28 SOFYAN MAR'I SMP
29 UMI KULSUM MTs 29 WIDYANINGSIH SMP
2. The level of mathematical reasoning of student
The data about the level of mathematical reasoning of student obtained by testing the students by providing a test questions are made by adjusting the indicator mathematical reasoning of students, in the form of 10 questions description. Test carried out to students MAN Cirebon 1 on 28 April 2013 at 12:45 AM until 13:45 PM. The test is only given to 30 students educational background MTs and 30 junior high school students' educational background. So that the amount of matter that is spread as much as 60 indexs.
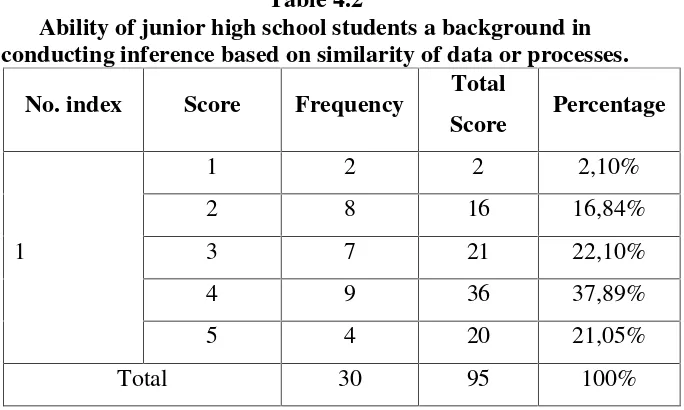
a. Ability of drawing conclusions based on similarity of data or processes (Capability analogy).
Data on the ability of drawing conclusions based on similarity of data or process or in other words the ability of students analogy presented in tabular form. For a table of the results of the calculation of the student's ability junior high school students' educational background in performing similarity Drawing conclusions based on the data or the process can be seen in Table 4.2 below.
Table 4.2
Ability of junior high school students a background in conducting inference based on similarity of data or processes.
No. index Score Frequency Total
Score Percentage
1
1 2 2 2,10%
2 8 16 16,84%
3 7 21 22,10%
4 9 36 37,89%
5 4 20 21,05%