Development of Soret Forced Rayleigh Scattering
Apparatus to Measure Soret Coefficient
in Binary and Ternary Liquid Mixtures
February 2019
Hiroaki Matsuura
A Thesis for the Degree of
Ph.D. in Engineering
Development of Soret Forced Rayleigh Scattering
Apparatus to Measure Soret Coefficient
in Binary and Ternary Liquid Mixtures
February 2019
Graduate School of Science and Technology
Keio University
Contents
Contents
Contents ... i List of Figures ... iv List of Tables ... vi Nomenclature ... ix Acknowledgments ... xii1. Introduction
1.1 The Soret effect (thermodiffusion) ... 11.2 Soret coefficients in binary and ternary systems ... 4
1.2.1 Linear laws and phenomenological equations ... 4
1.2.2 Binary systems ... 5
1.2.3 Ternary systems ... 6
1.3 Experimental findings for binary systems ... 7
1.3.0 Soret effect in gaseous mixture ... 7
1.3.1 Additive contributions due to difference in mass and moment of inertia ... 7
1.3.2 Thermophobicity concept ... 8
1.3.3 Change in signs of Soret coefficient ... 9
1.3.4 Molar mass independence of thermodiffusion coefficient of polymers ... 9
1.4 Existing experimental techniques to measure Soret coefficient ... 10
1.4.1 Thermogravitational column (TGC) ... 10
1.4.2 Optical beam deflection (OBD) ... 11
1.4.3 Optical digital interferometry (ODI) ... 13
1.4.4 Thermal field flow fractionation (ThFFF) ... 15
1.4.5 Light scattering from non-equilibrium fluctuations (LS-NEF) ... 16
1.4.6 Thermal lensing (TL) ... 18
1.4.7 Holographic grating technique (HGT) ... 19
1.5 Motivation and objectives ... 21
2. Design and construction of instrument for ternary systems
2.1 Concept ... 252.2 Working equations for binary systems ... 26
Contents
2.2.2 Relaxation process by mass diffusion ... 29
2.2.3 Fitting models for data evaluation ... 29
2.3 Derivation of Working equations for ternary solutions by direct detection scheme ... 31
2.3.1 Formation process by Soret effect ... 31
2.3.2 Relaxation process by mass diffusion ... 32
2.3.3 Fitting models for data evaluation ... 34
2.3.4 Determination of transport coefficients using the two-wavelength technique ... 34
2.4 Design of instrument for ternary systems ... 35
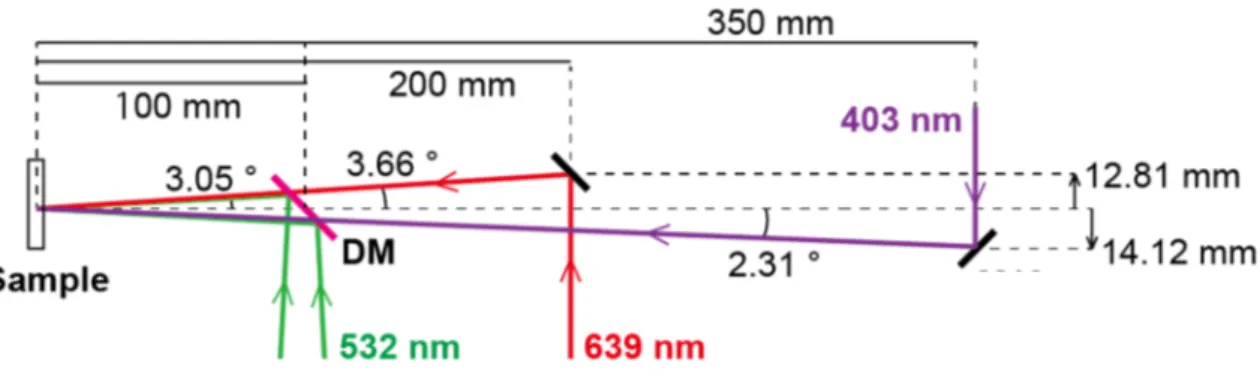
2.4.1 Selection of probing wavelengths ... 35
2.4.2 Optical system for simultaneous detection of two-wavelength signals ... 38
A. Incidence angle of lasers ... 38
B. Optical system ... 40
2.4.3 Real-time observation and analysis ... 41
2.4.4 Control of probing time (pulsed probing) ... 42
3. Validation of instrument by measurement of benchmark mixtures 3.1 Binary benchmark mixtures ... 43
3.1.1 Sample ... 43
3.1.2 CW (continuous wave) and pulsed laser probing ... 45
3.1.3 Soret and mass diffusion signals ... 48
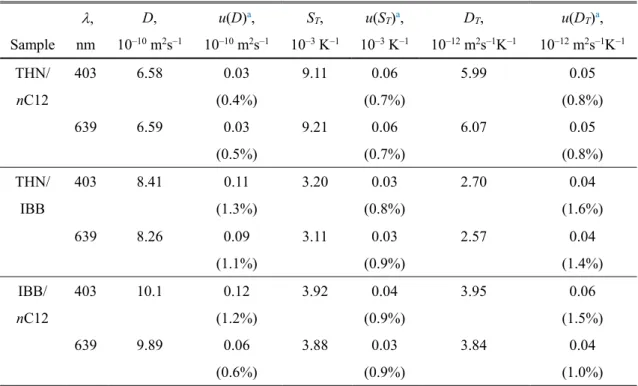
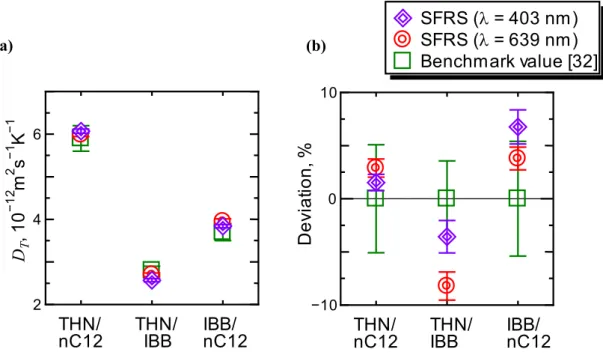
3.1.4 Results of signal analysis... 51
A. Evaluation of Uncertainties ... 51
B. Comparison to benchmark values ... 54
3.2 Ternary benchmark systems ... 56
3.2.1 Sample ... 56
3.2.2 Detected signals ... 57
3.2.3 Curve fitting ... 57
3.2.4 Soret coefficient and thermodiffusion coefficient ... 61
4. Measurement of ternary polymer solutions 4.1 Sample ... 66
4.2 Optical contrast factors ... 67
4.2.1 Concentration derivative and condition numbers ... 67
4.2.2 Temperature derivative ... 73
4.3 Result of measurements ... 73
Contents
4.3.2 Analysis of Soret effect signals in formation process ... 78
4.3.3 Soret coefficient and thermodiffusion coefficient ... 80
5. Development of Infrared Soret forced Rayleigh scattering (IR-SFRS) apparatus 5.1 Concept of IR-SFRS using CO2 laser... 86
5.2 Design of IR-SFRS apparatus ... 87
5.2.1 Sample cell ... 87
A. Selection of window materials ... 87
B. Configuration of sample cell ... 88
5.2.2 Optical system ... 89
5.3 Measurement of fringe spacing ... 90
5.4 Measurement of aqueous ethanol solution to confirm the validity ... 92
5.5 Potential of IR-SFRS apparatus ... 94
6. Conclusion ... 96
References ... 99
List of Figures
List of Figures
1.1 Schematic of a thermogravitational column (TGC). ... 11
1.2 Schematic of a Soret cell. ... 12
1.3 Schematic of the two-color optical beam deflection (OBD) apparatus. ... 12
1.4 Schematic of the optical digital interferometry (ODI) apparatus. ... 14
1.5 Principle of the thermal field flow fractionation (ThFFF) technique. ... 16
1.6 Instrument of the light scattering from non-equilibrium fluctuations (LS-NEF) technique. . ... 16
1.7 Principle of thermal lens technique. ... 18
1.8 Principle of holographic grating technique. ... 20
2.1 Concept of Soret forced Rayleigh scattering (SFRS) technique with two-wavelength detection scheme for measurement of ternary systems. ... 25
2.2 Absorption spectrum of the sample (binary benchmark mixture THN/nC12 with the dye of quinizarin) ... 37
2.3 Incident beam path designed for simultaneous detection of two-wavelength signals. ... 39
2.4 Soret forced Rayleigh scattering instrument developed for ternary systems. ... 40
2.5 Example of timing chart of function synthesizer output to control laser irradiation time. ... 42
3.1 Components of benchmark systems. ... 44
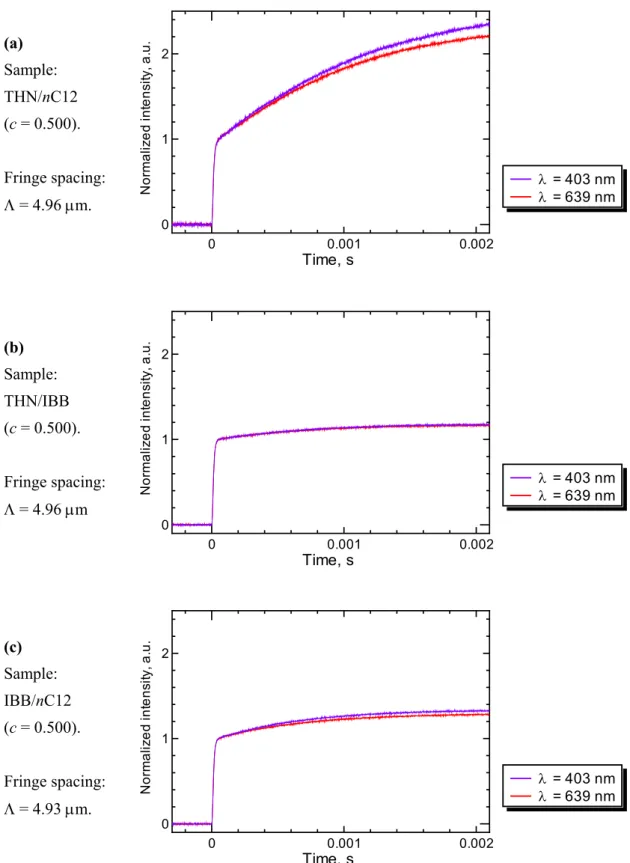
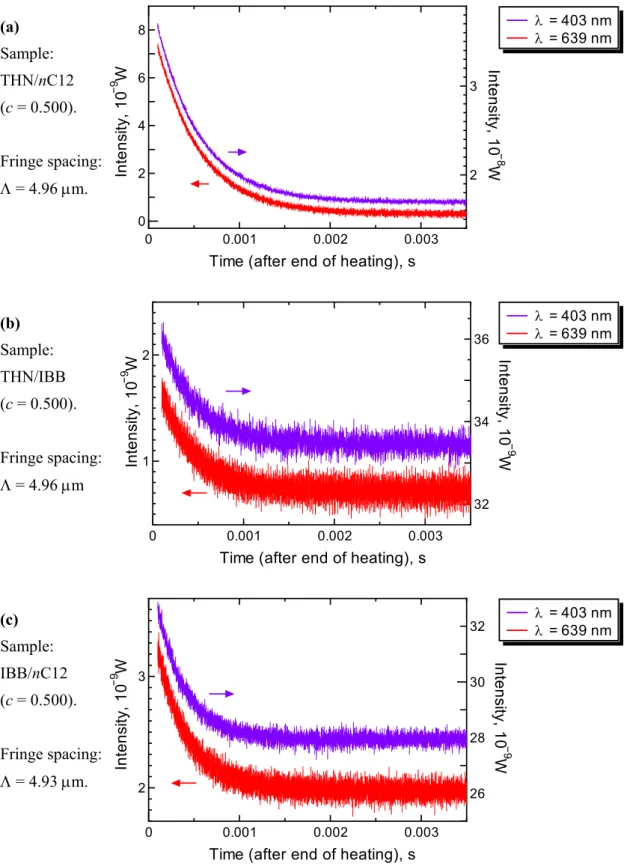
3.2 Simultaneously detected two-wavelength signals by CW probing for binary mixture of THN/nC12 (c = 0.500, T = 298.2 K). ... 46
3.3 Simultaneously detected two-wavelength signals by pulsed probing for binary mixture of THN/nC12 (c = 0.500, T = 298.2 K). ... 47
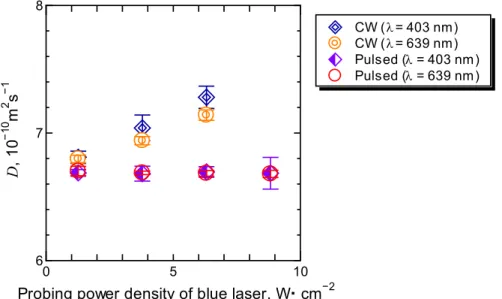
3.4 Diffusion coefficient D measured by CW and pulsed probing on binary mixtures of THN/nC12 (c = 0.500, T = 298.2 K) with changing power density of a probing laser ( = 403 nm). ... 48
3.5 16 times averaged Soret signals of the binary benchmark mixtures at T = 298.2 K. ... 49
3.6 16 times averaged mass diffusion signals of the binary benchmark mixtures at T = 298.2 K. ... 50
3.7 Mass diffusion coefficient D of binary benchmark mixtures (c = 0.500) at T = 298.2 K. ... 55
3.8 Soret coefficient ST of binary benchmark mixtures (c = 0.500) at T = 298.2 K. ... 55
List of Figures
3.9 Thermodiffusion coefficient DT of binary benchmark mixtures (c = 0.500) at T = 298.2 K. ... 56 3.10 Simultaneously detected two-wavelength signals of ternary benchmark mixture THN/IBB/nC12 with mass fractions of 0.80/0.10/0.10 at T = 298.2 K. ... 57 3.11 Mass diffusion signals and fitting curves of ternary benchmark mixture THN/IBB/nC12 with mass fractions of 0.80/0.10/0.10 at T = 298.2 K. ... 58 3.12 Mass diffusion signals and fitting curves of ternary benchmark mixture THN/IBB/nC12 with mass fractions of 0.80/0.10/0.10 at T = 298.2 K. Fitting curves were obtained by analysis using the benchmark values of the diffusion eigenvalues. ... 59 3.13 Soret effect signals and fitting curves of ternary benchmark mixture THN/IBB/nC12 with mass fractions of 0.80/0.10/0.10 at T = 298.2 K. ... 60 3.14 Soret coefficient S′T,i of ternary benchmark mixtures of THN/IBB/nC12 with mass fractions of 0.80/0.10/0.10 at T = 298.2 K. ... 64 3.15 thermodiffusion coefficient D′T,i of ternary benchmark mixtures of THN/IBB/nC12 with mass fractions of 0.80/0.10/0.10 at T = 298.2 K. ... 65 4.1 Components of ternary polymer solutions. ... 66 4.2 Compositions of ternary polymer solutions of CAB/styrene/2-butanone investigated in this work. ... 67 4.3 Directions for concentration derivatives ∂n/∂ci of CAB/styrene/2-butanone with the mass fractions of 0.1/0.1/0.8. ... 68 4.4 Condition numbers (1-norm) of Nc for ternary polymer solutions of CAB/styrene/2-
butanone with cCAB = 0.10 at T = 298.2 K. ... 72
4.5 Detected signals of CAB/styrene/2-butanone at T = 298.2 K. ... 74 4.6 Example of mass diffusion signals of CAB/styrene/2-butanone at T = 298.2 K. ... 75 4.7 Diffusion eigenvalues D̂ i of CAB/styrene/2-butanone with cCAB = 0.10 at T = 298.2
K. ... 77 4.8 Relaxation signal after end of heating for CAB/styrene/2-butanone with mass fractions of 0.10/0.30/0.60 at T = 298.2 K detected by probing laser of = 403 nm. ... 78
4.9 P′S, of CAB/styrene/2-butanone with cCAB = 0.10 at T = 298.2 K. ... 79
4.10 P′T, of CAB/styrene/2-butanone with cCAB = 0.10 at T = 298.2 K. ... 80
4.11 Soret coefficient S′T,i of CAB/styrene/2-butanone with cCAB = 0.10 at T = 298.2
K. ... 82 4.12 Thermodiffusion coefficient D′T,i of CAB/styrene/2-butanone with cCAB = 0.10 at T =
298.2 K. ... 82 5.1 Appearance of optical windows. ... 88 5.2 Sample cell for IR-SFRS, in which a single crystal diamond window was employed as
List of Figures
the incident side window (designed by collaborator Daichi Tokuda). ... 88 5.3 Experimental apparatus of the infrared Soret forced Rayleigh scattering (IR-SFRS) technique. ... 89 5.4 Measurement method to determine the diffraction angle of ±1st mode 1. ... 91
5.5 A typical relationship of a half of the distance between the ±1st order diffracted beams l/2 and the distance between the acrylic plate and the probing needle , which were
measured to determine the fringe spacing. ... 91 5.6 Detected signal of aqueous methanol solution cethanol = 0.10 at T = 298.2 K. ... 92
5.7 16 times averaged mass diffusion signal and fitting curve of aqueous ethanol solution with cethanol = 0.10 at T = 298.2 K. ... 93
5.8 16 times averaged Soret effect signal and fitting curve of aqueous ethanol solution with cethanol = 0.10 at T = 298.2 K. ... 93
A.1 Mass diffusion signals and fitting curves of the binary benchmark mixtures at T = 298.2 K. ... 111 A.2 Soret effect signals and fitting curves of the binary benchmark mixtures at T = 298.2 K. ... 112 A.3 Refractive index vs cstyrene for CAB/styrene/2-butanone at T = 298.2 K (cCAB is fixed).
... 117 A.4 Refractive index vs cCAB for CAB/styrene/2-butanone at T = 298.2 K (cstyrene is fixed).
... 118 A.5 Refractive index vs cCAB for CAB/styrene/2-butanone at T = 298.2 K (c2-butanone is fixed).
... 118
A.6 Temperature dependence of refractive index of CAB/styrene/2-butanone (cCAB = 0.10).
List of Tables
List of Tables
1.1 Comparison of experimental techniques to investigate the Soret effect. ... 21 2.1 Condition numbers calculated for the ternary benchmark mixture of THN/IBB/nC12 with the mass fractions of 0.8/0.1/0.1. ... 38 2.2 Coefficients of dispersion equations for the ternary benchmark mixture of THN/IBB/nC12 with the mass fractions of 0.8/0.1/0.1 ... 38 3.1 Composition and physical characteristics of three crude oils. ... 44 3.2 Experimental result and standard uncertainties of diffusion coefficient D, Soret coefficient ST, and thermodiffusion coefficient DT of binary benchmark mixtures (c = 0.50) at T = 298.2 K. ... 52 3.3 Uncertainty budgets for the mass diffusion coefficient in measurement of the binary benchmark mixtures (c = 0.50) by the probing laser of = 403 nm at T = 298.2 K. ... 52 3.4 Uncertainty budgets for the Soret coefficient in measurement of the binary benchmark mixtures (c = 0.50) by the probing laser of = 403 nm at T = 298.2 K. ... 54 3.5 Experimental result and standard uncertainties of parameters P′S, = (∂n/∂c1)S′T,1 +
(∂n/∂c2)S′T,2 and P′T, = (∂n/∂c1)D′T,2 + (∂n/∂c2)D′T,2 of ternary benchmark mixture
THN/IBB/nC12 with mass fractions of 0.80/0.10/0.10 at T = 298.2 K. ... 60 3.6 Experimental results and standard uncertainties of Soret coefficient S′T,i and thermodiffusion coefficient D′T,i of ternary benchmark mixture THN/IBB/nC12 with mass fractions of 0.80/0.10/0.10 at T = 298.2 K. ... 61 3.7 Uncertainty budgets for the Soret coefficient and thermodiffusion coefficient of 1,2,3,4- tetrahydronaphthalene (THN) in measurement of the ternary benchmark mixture of nC12/THN/IBB with mass fraction c1 = cnC12 = 0.10 and c2 = cTHN = 0.80 at T = 298.2
K. ... 63 4.1 Optical contrast factors (∂n/∂cstyrene)c_CAB,T,p of ternary polymer solutions of CAB/styrene/2-butanone at T = 298.2 K. ... 69 4.2 Optical contrast factors (∂n/∂cCAB)c_styrene,T,p of ternary polymer solutions of CAB/styrene/2-butanone at T = 298.2 K. ... 69 4.3 Optical contrast factors (∂n/∂cCAB)c_2-butanone,T,p of ternary polymer solutions of CAB/styrene/2-butanone at T = 298.2 K. ... 70 4.4 Condition numbers (1-norm) of Nc for ternary polymer solutions of CAB/styrene/2-
butanone at T = 298.2 K. ... 71 4.5 Optical contrast factors ∂n/∂T of ternary polymer solutions of CAB/styrene/2-butanone
List of Tables
at T = 298.2 K. ... 72
4.6 Diffusion eigenvalues D̂ i of CAB/styrene/2-butanone at T = 298.2 K. ... 76
4.7 Mass diffusion coefficient D of CAB/styrene/2-butanone at T = 298.2 K. ... 77
4.8 P′S, and P′T, of CAB/styrene/2-butanone at T = 298.2 K. ... 79
4.9 Soret coefficient S′T,i of CAB/styrene/2-butanone at T = 298.2 K. ... 81
4.10 Thermodiffusion coefficient D′T,i of CAB/styrene/2-butanone at T = 298.2 K. ... 81
4.11 Solubility parameters of CAB, styrene, and 2-butanone. ... 84
5.1 Experimental results and standard uncertainties of mass diffusion coefficient D, Soret coefficient ST, and thermodiffusion coefficient DT of aqueous ethanol solution with cethanol = 0.10 at T = 298.2 K. . ... 94
A.1 Uncertainty budgets for the mass diffusion coefficient in measurement of the binary benchmark mixtures (c = 0.500) by the probing laser of = 639 nm at T = 298.2 K. ... 113
A.2 Uncertainty budgets for the Soret coefficient in measurement of the binary benchmark mixtures (c = 0.500) by the probing laser of = 639 nm at T = 298.2 K. ... 113
A.3 Uncertainty budgets for the Soret coefficient and thermodiffusion coefficient of n- dodecane (nC12) in measurement of the ternary benchmark mixture of nC12/THN/IBB with mass fraction c1 = cnC12 = 0.100 and c2 = cTHN = 0.800 at T = 298.2 K. ... 114
A.4 Uncertainty budgets for the Soret coefficient and thermodiffusion coefficient of isobutylbenzene (IBB) in measurement of the ternary benchmark mixture of nC12/THN/IBB with mass fraction c1 = cnC12 = 0.100 and c2 = cTHN = 0.800 at T = 298.2 K. ... 115
A.5 Refractive induces of CAB/styrene/2-butanone measured at T = 298.2 K. ... 116
A.6 Temperature dependence of refractive induces of CAB/styrene/2-butanone ( = 401 nm). ... 119
A.7 Temperature dependence of refractive induces of CAB/styrene/2-butanone ( = 633 nm). ... 119
Nomenclature
Nomenclature
Roman symbols
a Thermal diffusivity m2・s–1
A Amplitude factor for the diffracted light intensity –
ci Mass fraction –
Cp Specific heat at constant pressure J・kg–1・K–1 d Length of optical path m
D Mass diffusion coefficient in binary mixtures m2・s–1
D11, D22 Main diffusion coefficient in ternary mixtures m2・s–1
D12, D21 Cross diffusion coefficient in ternary mixtures m2・s–1
D̂1, D̂ 2 Diffusion eigenvalue m2・s–1
D Diffusion matrix –
DT,i Thermodiffusion coefficient m2・s–1・K–1 D′T,i Thermodiffusion coefficient (containing concentration factor) m2・s–1・K–1 Dsq Amplitude factor for the scattered light intensity –
g Acceleration of gravity m・s–2
Ii Moment of inertia of component i kg・m2 Ih Intensity of heating laser W・m–2
I Intensity of diffracted light W・m–2 Ji Mass flux of component i kg・m–2・s–1
J Heat flux W・m–2
J′q Net heat flux W・m–2
L Length m
Lik Phenomenological coefficient –
Mi Molecular mass of component i –
n Refractive index –
Nc Refractive index matrix –
Nomenclature
∂n/∂T Optical contrast factor (temperature derivative) K–1
p Pressure Pa
P′T, Parameter related to thermodiffusion coefficient m2・s–1・K–1
P′S, Parameter related to Soret coefficient K–1
q Wavenumber m–1
Q′*
i Reduced heat of transport for component i J・kg–1
r Position –
R Gas constant J・K–1・mol–1
ST,i Soret coefficient K–1 S′T,i Soret coefficient (containing concentration factor) K–1
t Time s t0 Initial time s T Temperature K u(x) Standard uncertainty of x – v Velocity m・s–1 V Output voltage V W Normalized weight –
xi Mole fraction of component i –
Xi Thermodynamic forces –
Greek symbols
Absorption coefficient m–1
Thermal expansion coefficient K–1
Solubility parameter (MPa)1/2
Kinematic viscosity m2・s–1
Angle rad
Wavelength m
Fringe spacing m
Chemical potential J・mol–1
Nomenclature
a Characteristic time of heat diffusion s D Characteristic time of mass diffusion s
Phase difference rad
Acknowledgments
Acknowledgments
First of all, I would like to express my appreciation to my advisor Prof. Yuji Nagasaka for his enthusiasm and support during my six years in his group. He has provided me the ideal environment for my research and I fortunately got the opportunity to find the excitement in experimental studies on thermophysical properties. I consider it a privilege to have been his student and it was an honor to be able to work with him.
I would also like to thank Prof. Yoshihiro Taguchi, for his selfless supports at all hours. In addition, I would like to express my appreciation to the other members of my thesis committee, Prof. Atsushi Nakajima, Prof. Kenji Yasuoka, for their valuable and helpful suggestions.
This thesis was only possible because of the super-talented colleagues with whom I had the opportunity to work and interact. I would like to thank Shintaro Iwaasa for his unlimited kindness to explain me all important things to start my research life. I am grateful to Masayuki Fujita, Daichi Tokuda, and Taichi Murai, who enjoyed experiments on diffusion projects together. The significant improvement of the experimental technique could not be realized without useful and stimulating discussions with them. I also would like to thank Takuya Hoshino and Ryohei Konno who kindly taught me how to use the infrared laser system.
I would like to express my regards to other members in our group, who always cheer me up. I am especially grateful to Kota Tomioka and Makoto Kamata, who worked together in our laboratory for six years.
Lastly I would like to thank my family for their support and encouragement. To my parents who sacrificed so much for my education, I cannot thank you enough.
1. Introduction
1
Introduction
1.1 The Soret effect (thermodiffusion)
Mass transport phenomena play central roles in our daily lives and in engineering processes [1]. Diverse phenomena such as the transport in living cells, the efficiency of distillation, and dispersal of pollutants can be described using diffusion equations [1]. The Soret effect, also known as Ludwig-Soret effect, thermodiffusion, thermophoresis or thermal diffusion, describes mass transport flows driven by temperature gradients [2–4], whereas the driving force of the mass diffusion is the concentration gradient. The Soret effect which results from diffusion in a temperature gradient is an example of a cross-effect, in analogy with the thermo-electric effects known as Seebeck/Peltier effect [5]. The discovery of thermodiffusion was reported in a one-page paper by Ludwig in 1856 [6], which was just one year later after Fick presented the law of diffusion in 1855 [7]. After more than 20 years from the first observation by Ludwig, Soret reported more systematic studies on thermodiffusion in various salt solutions [8–10]. His name is attached to thermodiffusion due to his pioneering works and contributions, although Soret was probably not aware of the work of Ludwig, according to the short biography of Soret by Platten and Costesèque [11].
Although usually the Soret effect does not seem to be apparent to our eyes, this phenomenon can be significant depending on the spatial or time scale of the systems. One early application was the separation of uranium isotopes during World War II, using Clusius-Duckel columns [12,13]. In petroleum reservoirs, the Soret effect changes the oil compositions over geological time scales [14–16]. Also, isotope fractionation in silicate melts in magmatic systems is assumed to be associated with the Soret effect [17–21]. In addition, the Soret effect as well as the mass diffusion is considered to be important to design the solution casting processes to fabricate polymer films, where temperature and concentration distributions are formed in the casting solutions with micro-nano meter scale thickness [22,23]. As another interesting example,
1. Introduction
the accumulation of the prebiotic molecules by the combination of the Soret effect and convection in hydrothermal pores in ancient sea might explain the unrevealed origin-of-life problem [24–28]. The Soret effect in liquid mixtures is still not well understood [2,3]. Thermodiffusion in gaseous mixtures can be described by the Chapman-Enskog theory [29–31], but this classical theory for gases cannot be applied to liquid systems where interactions make the description complexed [2,3]. Therefore, the experimental approach to the Soret effect is important for the understanding and applications. In the last twenty years, remarkable progress was made on binary systems, including the Fontainebleau benchmark campaign to provide reliable values for the Soret coefficient in binary organic mixtures [32]. Experiments were performed on the three binary mixtures of 1,2,3,4-tetrahydronaphthalene (THN), isobutylbenzene (IBB), and n-dodecane (nC12) with the mass fraction of 0.5 at a temperature of T = 298.15 K, by five groups using different methods including the holographic grating technique [33,34] and thermogravitational column technique [35–37]. From the result, the benchmark values of the Soret coefficient, thermodiffusion coefficient, and the mass diffusion coefficient were proposed. New techniques can refer to the benchmark values to confirm the validity. For example, the optical digital interferometry (ODI) [38], the optical beam deflection (OBD) [39], thermogravitational micro-column [40], thermogravitational micro-column applying digital interferometry technique [41]
and the light scattering from non-equilibrium fluctuations [42] were validated by the measurement of the Fontainebleau benchmark systems. Experimental studies on binary systems lead to some interesting findings, including the change in signs of the Soret coefficient in water/alcohol mixtures [39,43], the molar mass independence of thermodiffusion in polymer solutions [44–46], the isotope Soret effect [47–51], and the concept of thermophobicity [52,53].
More recently, the research focus has shifted to ternary systems. Measurement of ternary mixtures is not straightforward, because there are two independent components and mass transport is described by six independent transport coefficients: four diffusion coefficients and two thermodiffusion coefficients. In mixtures composed of more than two components, the mass flux of one component is influenced by the concentration of other components (cross-diffusion)
[54]. Due to the cross-diffusion, the flux of the first component can be accelerated by as much as an order of magnitude [54]. Because the liquids of practical interest usually contain more than two components, approach to ternary mixtures is important to understand mass transport phenomena in multicomponent systems.
1. Introduction
The first systematic measurement of thermodiffusion in ternary systems was performed in 2005 on ternary hydrocarbon systems using the convective coupling technique of thermogravitational column (TGC) [55–57]. Subsequently, Köhler et al. [58,59] built the two-color optical beam deflection (OBD) instrument based on the two-two-color detection scheme proposed by Haugen and Firoozabadi [60]. Also, two-color optical experiments of the optical digital interferometry (ODI) technique by the Shevtsova group [61] were successfully carried out. These techniques contributed to the ternary benchmark campaign [62], which has been promoted within the framework of the DCMIX (diffusion coefficient measurements in mixtures) project
[61,63,64]. The benchmark values of the Soret coefficient, thermodiffusion coefficinet, and diffusion eigenvalues were proposed in 2015 [62] for the ternary mixture of THN/IBB/nC12 with mass fractions of 0.8/0.1/0.1 at a temperature of T = 298.15 K. Themodiffusion coefficients and the Soret coefficients were measured under the ground conditions by the ODI [61], OBD [65], and TGC [66] technique. The four diffusion coefficients were measured by the Taylor dispersion (TD) technique [61], the open ended capillary (OEC) technique [67], and the sliding symmetric tubes (SST) technique [66]. The values of mass diffusion coefficient measured by TD were used to calculate thermodiffusion coefficient by ODI technique [61]. Also, Soret coefficient by TGC technique were determined using the values of mass diffusion coefficient by SST [66]. In addition to these ground experiments, the microgravity experiments to reduce the effect of the convection in the SODI (selectable optical diagnostic instrument) installation [61] were conducted and the raw interferometric images of ODI were analyzed independently by the four laboratories [61,67– 69]. The Soret coefficient and thermodiffusion coefficient of THN/IBB/nC12 in a broader composition range were measured using TGC [70] and OBD [71].
Although the situation has significantly improved recently, experimental data for complex systems such as ternary mixtures are available for only particular systems. The understanding of the Soret effect is still limited and there is as yet no comprehensive microscopic description of the Soret effect in multicomponent liquid mixtures. Probably due to this lack of understanding, knowledge of the Soret effect is not widely utilized in industry, although the thermodiffusion can play dominant roles in some systems. This thesis deals with the development of the new instruments to measure the Soret coefficient in complex systems, with the aim to open up the option to gain broader knowledge of mass transport phenomena.
1. Introduction
1.2 Soret coefficients in binary and ternary systems
1.2.1 Linear laws and phenomenological equations
The description of the mass transport including the Soret effect and the mass diffusion is dealt with the linear non-equilibrium thermodynamics. In the following, the relationship between the mass transport coefficients and the description based on the non-equilibrium thermodynamics by de Groot [5] is briefly outlined.
The Fick’s law says that the mass flux is in proportion to the concentration gradient. Also, according to the Fourier’s law, the heat flux is in proportion to the temperature gradient. On the other hand, the Soret effect describes the mass flux generated by the temperature gradient. The mass flux considering the Soret effect can be expressed empirically by adding a term concerning the temperature gradient to the equation of the Fick’s law. Also, the heat flux considering the Dufour effect, which is known as the transport of heat by the concentration gradient, can be described by adding a term of the concentration gradient to the Fourier’s law. These empirical formula can be generalized to be the following phenomenological relation (linear laws) concerning the independent fluxes Ji and thermodynamic forces Xi.
k N k ik i
L
X
J
1 . (1.1)The coefficients Lik are independent of thermodynamic forces and called the phenomenological coefficients. Lii are proportionality factors of conjugate flux and force, whereas Lik (i = k) are quantities concerning cross effects such as the Soret effect and the Dufour effect. Onsager demonstrated the following reciprocal relations [72, 73] in 1931.
ki ik L
L . (1.2)
The phenomenological equations on the reduced heat flux J′q, which is the heat flux without the contribution of the mass transport, and the mass flux Ji (for component i) in the mixtures composed of N components of the temperature T without convection, chemical reactions, pressure gradient, and eternal forces can be written in a barycentric reference system as:
,
)
(
1 1 , 2
N k T p N k qk qq qL
T
T
T
L
'
J
(1.3)1. Introduction
,
)
(
1 1 , 2
N k T p N k ik iq iT
L
T
T
L
J
(
i
,
k
1
,
2
,
,
N
1
)
. (1.4) The phenomenological coefficients Lqq and Lik represent the heat conduction and the massdiffusion. Also, Liq and Lqk are related to the Soret effect and the Dufour effect. Because the chemical potential k is function of the concentration, k can be described with the mass fraction ci: 1 , 1 , . ( ) , j N k k p T i i i p T c c c
(
k
1,2, ,
N
1)
. (1.5) 1.2.2 Binary systemsFor the binary systems (N = 2), the reduced heat flux J′q and mass flux Ji can be calculated from the Eqs. (1.3)–(1.5). 1 2 , 1 1 1 2
)
/
(
1
c
T
c
c
L
T
T
L
'
q
qq
q
pT
J
. (1.6) 1 2 , 1 1 11 2 1 1)
/
(
1
c
T
c
c
L
T
T
L
q
pT
J
. (1.7)After defining the mass diffusion coefficient D and thermodiffusion coefficient DT as,
11 1 2 1 p T,
L
D
c T
c
, (1.8) 2 2 1 1T
c
c
L
D
q T
, (1.9)Eq. (1.6) can be written in a known form which is convenient to describe the actual experiments
[53].
1 D c 1 c1(1c D1) TT
J , (1.10)
where J1 is the mass flux of the component 1 (J1 + J2 = 0), c1 is the mass fraction of the component
1 (c1 + c2 = 1), and is the density.
In the stationary state where the mass flux by the mass diffusion and the Soret effect balance (J1 = J2 = 0), the ratio of the concentration gradient and the temperature gradient can be
described as [32]: 1 1(1 1) T c D c c T D . (1.11)
1. Introduction
The Soret coefficient ST is defined as the ratio of DT to D. T T D S D . (1.12)
With the Soret coefficient ST, Eq. (1.11) can be written as Eq. (1.13). ) 1 ( 1 1 1 S c c T c T . (1.13) The magnitude of the separation by the Soret effect is characterized by the Soret coefficient ST.
When the sign of the ST is positive, the component 1 is transported to the cold side.
1.2.3 Ternary systems
In ternary systems, there are two independent components. The mass fluxes of the component 1 and 2 are described as [62]:
T
D'
c
D
c
D
T
11 1 12 2 ,1 1
J
, (1.14)T
D'
c
D
c
D
T
21 1 22 2 ,2 2
J
. (1.15)D11 and D22 are the main diffusion coefficient. D12 and D21 are called as the cross diffusion
coefficient, which characterize the mass diffusion influenced by the concentration of other components (cross-diffusion). D′T,i is the thermodiffusion coefficient of the component i. Mass flux and mass fraction of the dependent component 3 are described as,
3 1 1 2
c c c , (1.16)
3 1 2
J J J . (1.17)
The Soret coefficients of the component i are defined as the ratio of the concentration gradient to the temperature gradient in the stationary state, as in the binary case (cf. Eq. (1.13)):
, i T i c S' T (1.18)
From Eqs. (1.14) and (1.15) with J1 = J2 = 0, the Soret coefficients can be obtained as: 21 12 22 11 12 1 , 22 1 , 1 ,
D
D
D
D
D
D'
D
D'
S'
T T T
, (1.19) 21 12 22 11 21 1 , 11 2 , 2 ,D
D
D
D
D
D'
D
D'
S'
T T T
. (1.20)The Soret coefficient and thermodiffusion coefficient of the dependent component 3 are described as: , 2 , 1 , 3 , T T T S' S' S' D'T,3 D'T,1D'T,2. (1.21) Note that thermodiffusion and Soret coefficients with a prime (D′T,i and S′T,i) contain the
1. Introduction
concentration factor c1 × c2 in a widely accepted definition for ternary systems, while in the binary
case the concentrations of the two components are usually factored out [58]. The binary thermodiffusion coefficient DT and the Soret coefficient ST can be converted to that with a prime D′T,1 and S′T,1, using the following equations [58].
T T
c
c
D
D'
,1
1(
1
1)
. (1.22) T Tc
c
S
S'
,1
1(
1
1)
. (1.23) In ternary systems, the positive Soret coefficient also indicates the transport to the coldside, as in binary systems. However, the sign of the Soret coefficient S′T,i does not always corresponds to that of thermodiffusion coefficient D′T,i in multicomponent systems of more than two components, because the sign of the cross diffusion coefficient can be positive or negative.
1.3 Experimental findings for binary systems
Although the microscopic mechanism of the Soret effect in liquid is still not well understood, a number of interesting findings based on experimental approaches were reported. In the following, part of them, mostly limited to binary systems, will be described.
1.3.0 Soret effect in gaseous mixture
Enskog and Chapman independently derived the thermodiffusion coefficient for gases by the Boltzmann equation [29–31]. In this classical theory for hard spheres, it was described that the heavier or larger component moves to the cooler region. The theoretical prediction was experimentally confirmed by Chapman and Dootson in 1917 [74]. Note that the attempts to extend the Chapman-Enskog theory to liquid state have not been successful [75].
1.3.1 Additive contributions due to difference in mass and moment of inertia
The effect of deuteration on the Soret coefficient was experimentally investigated by Debuschewitz and Köhler [47] for binary mixtures of benzene/cyclohexane and by Wittko and Köhler [48–50] for a large number of different organic liquids with cyclohexane. They found that the isotope substitution caused constant shift of the Soret coefficient depending neither on the composition nor on the mixing partner. It was shown that the Soret coefficient can be split into
1. Introduction three terms [47]: 0 2 1 2 1 2 1 2 1 T M I T M M I I S a b S M M I I , (1.24)
where aM and bI are constants, Mi is the molecular mass of species i, Ii is its moment of inertia, and S0
T is the so-called ‘chemical’ contribution to the Soret coefficient. Note that the isotopic part, the first and second terms of Eq. (1.24), was introduced by Schirdewahn et al.[76] for gaseous isotopic mixtures of hydrogen. It is assumed that the chemical contribution S0
T, which includes all the compositional dependence of the Soret coefficient, is due to interparticle interactions in the system [2].
Hartmann et al. [51] measured the Soret coefficient of the binary mixtures composed of the homologous series of halobenzenes and halobenzenes in toluene and cyclohexane, and it was shown that the isotopic contribution can be applied not only to truly isotopic systems, but also to mixtures of chemically similar molecules.
1.3.2 Thermophobicity concept
Hartmann et al. [52] measured the Soret coefficients of 41 equimolar mixtures of ten different organic solvents and found an additive rule for the heats of transport, which are defined as the heat transported by the mass flows.
1 * * abs ,abs 1 1 n n q k k k k k k ' Q' Q'
J J J . (1.25) Q′*k,abs is the absolute reduced heat of transport and Q′*k = Q′*k,abs – Q′*n,abs is the reduced heat of
transport. Jkabs is the absolute mass flux in the laboratory system,
abs
k
k k k
kJ v J v, (1.26)
where vk is the absolute velocity of component k in the laboratory system and vk is the barycentric
velocity. For binary systems, the reduced heat of transport is expressed by the phenomenological coefficients as: 1 * * * 1 1,abs 2,abs 11 q L Q' Q' Q' L . (1.27)
From Eqs. (1.8), (1.9), (1.12), and (1.27), the reduced heat of transport is related to the Soret coefficient as: * 1 1 ( 1/ 1) , T p T Q' S c T c . (1.28)
1. Introduction 1,abs 2,abs 2 1 1 , 1 ( ln / ln ) T p T Q Q S RT
x . (1.29)1 is the activity coefficient of component 1, x1 is the mole fraction of component 1, and R is the
gas constant.
Hartmann et al. [52] showed that a single value of the heat of transport Qk,abs can be
assigned to every pure substance, which determines its tendency to be transported towards the cold side (thermophobicity). It was shown that ten organic solvents [52] (later extended to 23 solvents [53]) can be sorted according to their thermophobicity based on the heats of transport, similar to the standard electrode potential.
1.3.3 Change in signs of Soret coefficient
In liquid systems with specific interactions such as hydrogen bonds, changes in signs of the Soret coefficient at certain temperatures and/or compositions are frequently observed [2,3]. A typical example is the mixture of ethanol/water [39,43]. Iacopini et al.[77] reported sign reversals of the Soret coefficient as a function of temperature in protein solutions. Prigogine et al.[78] explained qualitatively the sign change of the Soret coefficient in alcoholic mixtures of methanol/benzene, ethanol/cyclohexane, cyclohexanol/cyclohexane, and ethanol/dioxane using a free energy concept. However, this phenomenological approach does not lead to a microscopic understanding of the Soret effect [3].
1.3.4 Molar mass independence of thermodiffusion coefficient of polymers
Schimpf and Giddings [45,46] investigated the influence of molar mass on the thermodiffusion coefficient of polystyrene, poly(-methyl)styrene, polymethyl methacrylate, and polyisoprene in several solvents, and reported that the thermodiffusion coefficient did not depend on the molecular weight of polymers. Brochard and De Gennes [79] gave the explanation of the molar mass independence of the thermodiffusion coefficient by the idea based on the combination of non-equilibrium thermodynamics and hydrodynamic concepts.
1. Introduction
1.4 Existing experimental techniques to measure Soret coefficient
There are several experimental techniques which have different excitation methods of the Soret effect, detection schemes, and diffusion lengths. In the following, existing experimental techniques to measure the Soret effect will be overviewed.
1.4.1 Thermogravitational column (TGC)
The thermogravitational column (TGC) technique is based on the principle of the Clusius-Dickel separation discovered in 1938 [12,80], which amplifies the separation of components by coupling thermodiffusion and natural convection. In TGCs, a sample mixture is put in a vertically long column which consists of two vertical plates or concentric cylinders [4]. Figure 1.1 shows a schematic of a parallelepipedic TGC. Copper plates separated by a small gap to create a horizontal temperature gradient are maintained at two different temperatures by circulating water. Usually, the temperature difference of about 5 K is kept for 24–48 hours [4], before extracting a small amount of sample (1–2 mL) from sampling taps to analyze the compositional distribution formed vertically by the Clusius-Dickel separation. The analysis of the composition of the extracted sample is carried out by the measurement of the refractive index or the density for the measurement of binary systems. In the measurement of ternary systems, both the refractive index and the density are analyzed to determine the composition [55]. Naumann et al.[40] developed a thermogravitational micro-column with an interferometric contactless detection system. Recently, Lapeira et al. [41] applied the optical digital interferometry technique to thermogravitational micro-column technique, which enabled to determine the complete concentration profile inside the micro-column.
From the Furry-Jones-Onsager theory [81], the vertical concentration gradient ∂ci/∂y formed in a TGC is given by [66], , 4
504
T i i xD'
c
y
gL
, (1.30)where g is the gravity acceleration, is the kinematic viscosity, is the cubic thermal expansion coefficient. Lx is the gap of the column. In the ternary benchmark campaign, two types of TGCs with (i) Lx = 1 + 0.005 mm and the height of Ly = 500 mm, and (ii) Lx = 1.02 + 0.005 mm and Ly = 980 mm were employed [66].
1. Introduction
Figure 1.1: Schematic of a thermogravitational column (TGC).
It is pointed out that instabilities may make measurements difficult or even impossible for the system with the negative Soret coefficient of the denser component [2,82]. In addition, mechanical precision of TGCs can affect the reliability of measurements, because uncertainties may be generated by the length of the gap Lx, which is included in the form of Lx4 in Eq. (1.30). Note that only thermodiffusion coefficients D′T,i can be obtained by Eq. (1.30) in TGC experiments. To determine the Soret coefficient, the mass diffusion coefficient obtained by other means is required.
1.4.2 Optical beam deflection (OBD)
The optical beam deflection (OBD) technique optically detects thermodiffusion in a Soret cell. As shown in Figure 1.2, a Soret cell consists of two horizontal parallel plates with different temperatures to form a vertical temperature gradient in a sample between the plates. In Soret cells, a vertical concentration distribution is formed by the Soret effect. Experimental studies employing Soret cells were started in 1920s by Tanner [83,84]. The analytical solution for binary mixtures in the Soret cell has been derived by Haugen and Firrozabadi [85].
0 ( , ) 1 2 (2 1) 2 (2 1) ( 1) ( ) erf erf / 2 4 4 N m m N T c y t c y m y m y y m S' T L t t
2 2 2 (2 1) 2 (2 1) ( 1) exp exp 16 16 N m m N t y m y m t t
, (1.31)1. Introduction
between two plates.
In the OBD technique, the Soret effect in a Soret cell is detected by the deflection of a laser beam which enters the sample horizontally. Due to the vertical refractive index gradient induced by the Soret effect, the laser is deflected. The displacement of the deflected laser beam at the detector Δy(t) is the function of the refractive index gradient ∂n(t)/∂y.
w air w air ( ) ( ) 2 d d n t d y t d y n n n , (1.32)
where n, nw, nair are the refractive index of the sample, exit window and air, respectively. Also, d,
dw, dair are the length of the optical path in the sample, thickness of the exit window, and the
distance between the exit window and the detector, respectively. For binary systems, the refractive index gradient ∂n(t)/∂y can be written as [39]:
1 1 , 1 , ( ) ( ) ( ) p c p T c t n t n T t n y T y c y , (1.33)
∂T(t)/∂y and ∂c1(t)/∂y are calculated from the heat equation and the diffusion equation,
respectively [39]. Thus, the Soret coefficient can be obtained by analyzing the time history of the displacement signal Δy(t). Note that the optical contrast factors ∂n/∂T and∂n/∂c1 are required to
determine the Soret coefficient. The optical contrast factors can be measured by an Abbe refractometer or interferometric method [33,86].
Figure 1.2: Schematic of a Soret cell.
1. Introduction
As Haugen and Firrozabadi [60] suggested, measurement of ternary systems can be carried out by employing two readout lasers of different wavelengths because the refractive index is dependent on the wavelength. For ternary systems, the refractive index gradient ∂n(t)/∂y
can be written as [58]: 1 2 2 1 1 2 , , 1 , , 2 , , ( ) ( ) ( ) ( ) p c c p c T p c T n t n T t n c t n c t y T y c y c y . (1.34)
By using two lead out lasers, independent two displacement signals Δy(t) are obtained. This
enables to determine the time dependent concentration profiles of all three components [58,60]. Figure 1.3 shows the schematic of the two-color OBD apparatus to measure ternary systems. In the OBD instruments for ternary systems developed by the group of Köhler [65], the readout lasers of = 405 nm and = 635 nm have been employed, whereas one readout laser of = 637 nm was used to measure binary mixtures of water/ethanol [39]. Temperature of the copper plates is controlled using Peltier elements. In the measurement of the ternary benchmark system
[65], the time dependent OBD signals in 1–2 h were obtained under the temperature difference between two plates T of 1.0 K, using the sample cell with the length of optical path d = 10.0 mm and with the vertical spacing of h = 1.43 mm.
1.4.3 Optical digital interferometry (ODI)
The optical digital interferometry technique also employs a Soret cell, but the cell height is larger (5–10 mm) to observe the mass transport by means of the Mach-Zehnder interferometer. The ODI technique was developed by Mialdun and Shevtsova for the ESA (European Space Agency) project of IVIDIL (influence of vibrations on diffusion in liquids) [87].
Figure 1.4 shows the schematic of the ODI apparatus. A beam splitter splits the expanded laser beam into two beams. One of them enters the Soret cell and the other is used as a reference beam. Two beams interfere at the second beam splitter. The interference fringes are observed by a CCD camera. In the measurement of binary benchmark systems [38], a He-Ne laser with the wavelength of = 632.8 nm was employed to detect the mass transport in a Soret cell with the cell height of h = 6.3 mm and optical path of d = 18.0 mm. For the binary benchmark systems, the characteristic time of the measurement D is calculated by the cell height and the diffusion coefficient as D = h/D ≈ 12 h [38], which means that ODI requires more than ten hours for the mixtures of small molecules with D in several 10–10 m2s–1 due to the larger diffusion length.
1. Introduction
Figure 1.4: Schematic of the optical digital interferometry (ODI) apparatus.
By performing image processing based on 2-D Fourier transform technique to interference patterns recorded by a CCD, optical phase information can be extracted. The variation of the refractive index is obtained from the phase difference Δ[38],
0 ( , , ) ( , , ) ( , , ) ( , , ) 2 n x y t n x y t n x y t x y t d . (1.35)
Here, x is the horizontal position perpendicular to the optical axis, y is the vertical position, and d
is the length of the optical path. The variation of the refractive index is the function of the temperature and the mass fraction [38].
1 1 ( , , ) n ( , , ) n ( , , ) n x y t T x y t c x y t T c . (1.36)
Thus, the compositional profile over the entire two-dimensional cross section of the cell can be traced by the ODI technique.
Similar to the OBD technique, ternary systems can be measured by employing another probing laser. In the ground measurement of ternary benchmark system, two lasers with the wavelengths of = 670 nm and = 925 nm were used [61]. Measurement of ternary benchmark system by ODI was also performed under microgravity conditions in the selectable optical diagnostic instrument (SODI) instrument with the laser wavelengths of = 670 nm and = 935 nm [61].
1. Introduction
1.4.4 Thermal field flow fractionation (ThFFF)
The field flow fractionation is an analytical technique for separating and characterizing macromolecules, supramolecular assemblies, colloids and particles [88], which was developed by Giddings in 1966 [89]. In this technique, an external field is applied perpendicularly to the direction of the flow of solutions or suspensions in a channel. A temperature gradient is used as a field in the thermal field flow fractionation (TFFF or ThFFF) technique.
Figure 1.5 shows the principle of ThFFF. A laminar parabolic flow profile is formed when the sample liquid flows through a thin channel under a temperature gradient [88]. Due to the Soret effect, sample particles of positive Soret coefficient are forced to the cold wall. As the result of the balance of the Soret effect and the mass diffusion, the concentration profile is built up in the direction of the temperature gradient. The special distribution of the particles in the steady-state is characterized by the effective layer thickness l, which approximately denotes the distance between the accumulation wall and the center of gravity of the particles. This parameter
l and the velocity of the particles are related to the Soret coefficient. The retention ratio R, which is defined as the ratio of the average velocity of the analyte zone to the average velocity of the carrier liquid, is given by [45],
0 6 coth 1 2 2( / ) r t l l R t w l w w , (1.37)
where w is the thickness of the channel. tr is the retention time and t0 is the passage time without
external forces. The relationship between l and the Soret coefficient ST is given by [45], 1
( T )
l
w S
T , (1.38)where is thermal expansion coefficient, and T is the temperature difference. By the measurement of the retention time tr, the Soret coefficient is obtained with Eqs. (1.37) and (1.38). In the experiment by Schimpf and Giddings [45], a channel with the thickness of w = 76 m, the breadth of 2.3 cm, and tip-to-tip length of 34 cm was employed. The temperature difference between the hot wall and the cold wall was T = 30 K [45].
Although ThFFF has been successfully used for polymers solutions, this technique is less suitable for mixtures of small molecules because too strong temperature gradients would be required [2]. In addition, to determine thermodiffusion coefficient, the mass diffusion coefficient should be obtained by other means.
1. Introduction
Figure 1.5: Principle of the thermal field flow fractionation (ThFFF) technique.
Figure 1.6: Instrument of the light scattering from non-equilibrium fluctuations (LS-NEF)
technique.
1.4.5 Light scattering from non-equilibrium fluctuations (LS-NEF)
When a fluid is subjected to a stationary temperature gradient, long-range non-equilibrium fluctuations (NEFs) arise from a coupling between microscopic velocity fluctuations and the macroscopic temperature gradient [90]. Experimental analysis of the dynamics of non-equilibrium fluctuations by light scattering methods enables measurement of the Soret coefficient and the mass diffusion coefficient [42].
Figure 1.6 shows an optical setup for shadowgraph experiments. The non-equilibrium fluctuations in a thermodiffusion cell is observed by a low coherence light with the wavelength = 680 ± 10 nm and a charge coupled device (CCD) sensor [42]. The liner polarizer is employed to set the beam polarization before the light entering the Soret cell. The second linear polarizer
1. Introduction
after the cell enables to control the average transmitted light intensity. The Soret cell consists of two sapphire plates maintained at different temperatures by Peltier elements. In the measurement of binary benchmark systems [42], the cell thickness (length of optical path for sample liquid) was d = 1.3 mm or d = 1.53 mm [42] and the temperature difference was 8–20 K.
In this technique, shadowgraph images are acquired after reaching the steady state. Quantity obtained from the analysis of the images is the so-called structure function which is given by [42]:
2 ( , ) 2 ( ) ( ) 1 ( , ) ( ) m s I t A T I ISF t B q q q q q , (1.39)ΔIm(q, Δt) is the spatial Fourier transformation ofΔim(r, Δt), which is the difference of the
measured intensity Δim(r, Δt) = im(r, t) − im (r, t +Δt) between a delay time Δt (r is the position).
q is the wave number related to the scattering angle, A is a renormalization constant, Is(q) is the
ensemble averaged scattered light, T(q) is the transfer function of the imaging optics, and B(q) is the noise of the measurement. For binary systems, the intermediate scattering function (ISF) is modeled as a single exponential decay due to the concentration NEF [42],
( , ) exp ( ) t ISF q t q
, (1.40)(q) is the relaxation time constant for the concentration component in the presence of gravity
[42],
2 4 1 ( ) 1 ( c / ) q Dq q q , (1.41)qc is the gravitational critical wave number which is related to the Soret coefficient as [42]:
4 1 / ( / ) c T q Dd S' c T , (1.42)where is kinematic viscosity, D is the mass diffusion coefficient, and d is the cell thickness. 1/(∂/∂c) denotes the solutal expansion coefficient. By fitting analysis of the experimental structural function with Eqs. (1.39)–(1.42), the Soret coefficient and the mass diffusion coefficient can be obtained.
Non-equilibrium fluctuations in the ternary benchmark mixture were observed on a ground condition [91] and the good agreement between theory developed by Ortiz de Zárate [92]
and the experiments for the larger wave numbers was obtained, which validated theory for the microgravity conditions. It was not possible to distinguish the two eigenvalues of the mass
1. Introduction
diffusion matrix in the ternary benchmark mixture [91], but the two eigenvalues of the ternary polymer mixture composed of polystyrene, toluene, and n-hexane were well separated with the accuracy in the order of 1% [93].
1.4.6 Thermal lensing (TL)
In thermal lensing (TL) technique, both the excitation and detection of the Soret effect are carried out optically. Figure 1.7 shows the principle of thermal lens technique. The absorption of the laser generates the refractive index distribution in the sample. Due to the Gaussian profile of the laser beam, the refractive index distribution works as a laser induced lens (thermal lens). Following the formation of the temperature distribution in the sample, the Soret effect creates the concentration distribution, which also acts as a Soret lens. In the experiment by Polyakov and Wiegand [94], an infrared laser with the wavelength of = 980 nm was employed to investigate the Soret effect in the sample cell thickness of d = 0.2 mm and 1.0 mm. The distance between the sample cell and the beam waist was 3–4 mm [94]. When the sample cell placed 4 mm before the beam waist, the beam size was about 54 m [94]. The temperature difference formed by the laser absorption was in the order of 0.05 K [94].
The mass transport can be evaluated by the intensity change after the sample on the optical axis. The intensity in a thermal lens experiment I(t) is given by [95]:
1 2 th Soret th Soret th Soret th Soret ( ) 1 0.5 (0) 1 / 1 / 1 / 1 / I t I t t t t , (1.43)
th = /(4a) and Soret = /(4D) are characteristic time constants of the formation of thermal lens
and the Soret lens, respectively, in which is the beam spot size, a is thermal diffusivity, and the
D is the mass diffusion coefficient. th and Soret are strengths of thermal and Soret lens, which are
1. Introduction th 0.52 ( p) Pd n aC T , (1.44) Soret 0.52 ( p) T Pd nS' aC c , (1.45)
where is the absorption coefficient, P is the laser power, d is the cell thickness, is the density,
Cp is the specific heat at constant pressure, and is the wavelength of the laser. The numerical factor of 0.52 is introduced when the parabolic lens model gets extended [95,96]. Optical contrast factors are required to determine the Soret coefficient.
Careful consideration of convection is required in thermal lens experiments. In the measurement by Voit [97] on the binary benchmark mixutre n-dodecane/1,2,3,4 tetrahydronaphthalene, the Soret coefficient was 40% smaller than the benchmark value, which can be explained by the convection [94]. Measurement of systems with very small mass diffusion coefficient can be difficult, because convection might disturbs the concentration distribution by the Soret effect before reaching the stationary state [95,98]. In addition, it is pointed out that the optical distortion of the probing beam can be a problem [95].
1.4.7 Holographic grating technique (HGT)
The transient holographic grating technique is one of all optical techniques, similar to thermal lens technique, in which both excitation and detection are performed optically. The laser induced dynamic grating [99] is applied to the measurement of the Soret coefficient in this technique.
Figure 1.8 illustrates the principle of the holographic grating technique. The sinusoidal temperature distribution is formed by the absorption of the heating laser beams interfering in the sample. The Soret effect is subsequently induced by generated temperature grating with the interference fringe. In this process, the sample works as a form of diffraction grating because the spatially sinusoidal distribution of a refractive index is generated by the heat and mass transport. The mass transport can be evaluated by the intensity of the diffracted beam of a different laser, because the diffraction efficiency includes information on the compositional change.
The first observation of the Soret effect by this technique was reported by Thyagarajan and Lallemand on CS2/ethanol mixtures in 1978 [100]. Köhler et al. [101–103] significantly
improved the transient holographic grating technique using heterodyne detection schemes, and their improved method is known as the thermal diffusion forced Rayleigh scattering (TDFRS). To convert the interference pattern to the temperature grating, addition of small amount of inert
1. Introduction
Figure 1.8: Principle of holographic grating technique.
dye to the sample is required in measurement by TDFRS setup employing a heating laser of visible wavelength [103]. Wiegand et al.[104] has been developed the infrared thermal diffusion forced Rayleigh scattering (IR-TDFRS) setup, employing an infrared laser with the wavelength of = 980 nm. This enables measurement of transparent samples without doping a dye.
The normalized heterodyne diffraction intensity to be detected in TDFRS experiments is given by [103]: 1 0 0 , , 1 ( ) 1 exp (1 ) het T p T p c a D a t n n t S c c c c 1 exp 1 exp D a D a t t , (1.46)
th = 1/(aq2)–1 and D = /(Dq2) are characteristic time constant of heat and mass diffusion, respectivel. q is the wavenumber of grating q = 2/ and is the fringe spacing. The optical contrast factors are required to determine the Soret coefficient.
TDFRS is very sensitive technique which is able to detect the relative change of concentration below 10−5 induced by the temperature grating with the amplitude of 10 to 100 mK
[103]. The characteristic time of the measurement is very short due to the fringe spacing in m order. However, signal averaging in several thousands of times is required to increase the signal to noise ratio [2,102].
Diffracted beam (to detector)