Full Terms & Conditions of access and use can be found at
http://www.tandfonline.com/action/journalInformation?journalCode=vjeb20
Download by: [Universitas Maritim Raja Ali Haji] Date: 11 January 2016, At: 20:27
Journal of Education for Business
ISSN: 0883-2323 (Print) 1940-3356 (Online) Journal homepage: http://www.tandfonline.com/loi/vjeb20
The Major Field Test in Business: A Solution to the
Problem of Assurance of Learning Assessment?
Jeffrey J. Green , Courtenay Clifford Stone & Abera Zegeye
To cite this article: Jeffrey J. Green , Courtenay Clifford Stone & Abera Zegeye (2014) The Major Field Test in Business: A Solution to the Problem of Assurance of Learning Assessment?, Journal of Education for Business, 89:1, 20-26, DOI: 10.1080/08832323.2012.749206
To link to this article: http://dx.doi.org/10.1080/08832323.2012.749206
Published online: 13 Dec 2013.
Submit your article to this journal
Article views: 113
View related articles
View Crossmark data
ISSN: 0883-2323 print / 1940-3356 online DOI: 10.1080/08832323.2012.749206
The Major Field Test in Business: A Solution to the
Problem of Assurance of Learning Assessment?
Jeffrey J. Green, Courtenay Clifford Stone, and Abera Zegeye
Ball State University, Muncie, Indiana, USA
Colleges and universities are being asked by numerous sources to provide assurance of learning assessments of their students and programs. Colleges of business have responded by using a plethora of assessment tools, including the Major Field Test in Business. In this article, the authors show that the use of the Major Field Test in Business for assurance of learning purposes is ill advised. First, it provides no direct evidence of student learning. Second, it offers no useful comparative analyses to other business students or institutions. Consequently, it provides no guidance for curriculum or program changes to achieve better learning outcomes. Thus, use of the Major Field Test in Business offers only a pretend solution to the problem of assurance of learning assessment.
Keywords: assurance of learning, business school accreditation standards, Major Field Test in Business, pretend solutions
Higher education is plagued by numerous problems. Perhaps the most contentious problem is the demand, from various sources, that colleges and universities provide assurance of learning (AOL) assessments of their students and programs. In response, business schools have adopted a variety of mea-sures to assess student learning. One specific measure, the Major Field Test in Business (MFTB), is widely used to pro-vide independent and direct epro-vidence of students’ learning performancesvis-`a-visthe common body of knowledge ex-pected of all business school graduates. It is also used to compare student learning performance over time or relative to business students at all U.S. institutions whose students take the MFTB.
In this article, we first describe the MFTB and show that it plays an important role in AOL assessment at business schools. Second, we demonstrate that there are critical prob-lems with its use. Finally, we summarize our analysis and conclude that the MFTB offers only a pretend solution to the AOL assessment problem.
ACCREDITATION, AOL ASSESSMENT, AND THE MFTB
The MFTB, developed by the Educational Testing Service (ETS) in 1990, is a 2-hr test consisting of 120
multiple-Correspondence should be addressed to Courtenay Clifford Stone, Ball State University, Department of Economics, 2000 W. University Avenue, Muncie, IN 47306, USA. E-mail: [email protected]
choice questions, chiefly intended for students in the last year of their undergraduate business program. ETS (n.d., p. 2) states that it follows “the general guidelines of business school accrediting agencies . . . [and] . . . covers areas out-lined in statements of the ‘Common Body of Knowledge’ for undergraduate business education.”1
Table 1 shows the specific functional areas covered on the MFTB. The questions are written by experienced business school faculty and then validated by ETS assessment experts who subject each question to rigorous tests of sensitivity and reliability. ETS revises the MFTB approximately every four to five years. The latest test cycle began in September 2010. Its use for AOL assessment is accepted by all three major business school accrediting agencies—the Associa-tion to Advance Collegiate Schools of Business (AACSB), the Accreditation Council for Business Schools and Pro-grams (ACBSP), and the International Assembly for Col-legiate Business Education (IACBE).2 Martell’s survey of AACSB-accredited business schools in 2006 indicated that 46% of these schools used the MFTB. In a slightly differ-ent survey taken in 2006, Pringle and Michel found that about 30% of AACSB-accredited business schools used the MFTB. While there are no published surveys of the use of the MFTB by ACBSP- or IACBE-accredited business schools, ACBSP includes the MFTB among five alterna-tive measures it recommends for external assessment and IACBE illustrates its use in itsAccreditation Process Manual
(International Assembly for Collegiate Business Education, 2011).
THE MAJOR FIELD TEST IN BUSINESS: A SOLUTION TO AOL? 21
TABLE 1
MFTB Content Area Coverage
Business area
Information systems 10% 12
Finance 13% 16
Marketing 13% 16
Legal and social environment
10% 12
International issues (Overlapping and drawn from other content areas above)
12 (drawn from other content
areas)
Because these accrediting agencies accept its use in AOL assessment, the MFTB is widely used by their accredited and nonaccredited member business schools. From August 2006 to June 2010, 181,488 business students from 685 U.S. busi-ness schools took the previous version of the MFTB. From September 2010 to June 2011, 32, 982 business students en-rolled at 438 business schools took the current version of the test.
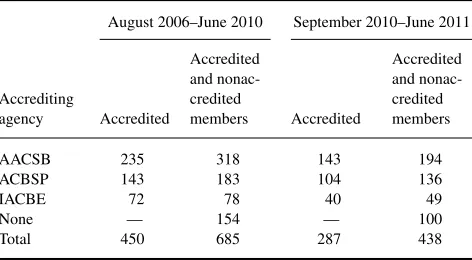
Table 2 indicates that the majority of business schools who used the MFTB are members of one or more of the three business school accrediting agencies. About 66% of these schools are fully accredited and about 78% are members of one or more of these agencies. Furthermore, 48 schools that took the 2006–2010 test and 41 schools that took the 2010–2011 test were members of more than one accrediting agency.
The business schools not affiliated with any of these three accrediting agencies (about 22%) used the MFTB for other
TABLE 2
Accrediting Agencies, U.S. Business Schools, and the Major Field Test in Business: 2006–2011
August 2006–June 2010 September 2010–June 2011
Accrediting
AACSB 235 318 143 194
ACBSP 143 183 104 136
IACBE 72 78 40 49
None — 154 — 100
Total 450 685 287 438
Note.AACSB=Association to Advance Collegiate Schools of Busi-ness; ACBSP=Accreditation Council for Business Schools and Programs; IACBE=International Assembly for Collegiate Business Education.
reasons, including satisfying AOL requirements established by their regional accrediting agencies. For example, Mason, Coleman, Steagall, Gallo, and Fabritius (2011) noted that “In a presentation to . . . the institution studied herein, an SACS accreditation representative . . . cited the [MFTB] as a content knowledge assessment tool and inquired whether the institution was using it” (p. 71).
THE MFTB: A PRETEND SOLUTION TO THE REAL PROBLEM OF AOL ASSESSMENT
Porter (2011) devised the termpretend solution:
to mean a social program that does not work as intended but is not critiqued or reformed because its flaws are hidden.
...The program’s mere existence immunizes policy makers
from the need to assess whether the program is an effective solution....Similarly, expert participation in crafting a
so-lution creates a powerful assumption from the outset that the program cannot be improved and therefore does not need monitoring and assessment. (pp. 113–114)
Use of the MFTB meets the criteria for a pretend solution. It has been crafted by experts, has neither been critiqued nor challenged by accrediting agencies or business schools and, as we show subsequently, does not work as intended. There are three significant flaws with its use for AOL assessment, all of which result from the methods used to calculate and report the MFTB scores.
Scaling of the MFTB Scores
ETS does not report the raw scores that would indicate indi-vidual or institutional performances on the MFTB. Instead, it converts them into scaled scores that are normed to the performance of all students who took the same version of the test. These scaled scores range from 120 to 200.
A few studies have pointed out that having access only to these scaled scores poses major problems for AOL assess-ment. Allen and Bycio (1997) commented that, “We would have preferred to examine the overall internal consistency and reliability of responses . . . but were unable to do so because the calculation requires the raw . . . test scores which ETS does not provide in their examinee reports” (p. 507). Similarly, Bandyopadhyay and Rominger (2010) stated that, “the MFT does not report the functional area specific scores for each student, so it’s impossible to analyze their strengths and weaknesses in these areas” (p. 35).
Also, confusion over the construction of these scores can lead to errors in interpreting their usefulness for AOL assess-ment. For example, Bandyopadhyay and Rominger (2010) incorrectly claimed that, “[it] is ‘normed’—that is, it com-pares students’ scores only to those of other test takers in that semester. For that reason, we cannot compare how well
students performed this semester to how well they performed last semester” (p. 35). If this statement were true, of course, use of the MFTB would be irrelevant for AOL assessment. While we argue below that it is irrelevant for AOL assess-ment, it is not for this reason. This example, however, in-dicates the confusion that can arise from the complicated, perhaps, even byzantine, procedure used to derive the scaled scores.
What useful information would a score that denotes a student’s comparative performance on the MFTB provide for AOL assessment? Consider, for example, ETS’s sample individual student report that shows a scaled score of 168 with a standard error of 4.7. ETS explains this score as follows: “If you were to take any number of tests equivalent to the one you have just completed, your score would fall within this range [158 to 177] with a statistical confidence level of 95%.” Using ETS’s Individual Students’ Total Score Distribution, it is then 95% certain that the sample student’s potential performance is somewhere between the 65th and 95th percentiles, with the 168 score ranked at the 85th percentile. This wide range explains very little about the sample student’s comparative level of learning.
More importantly, we know nothing about the sample student’s actual learning performance on the test. Is a scaled score of 168 (85th percentile) indicative of 100 correct an-swers out of 120 questions? 80 correct anan-swers? 60 correct answers? For his ETS study, Ling (2009) had access to the raw scores for the 2002–2006 version of the MFTB. His anal-ysis yields some answers to this conundrum. For the 155,235 students who took that test, the mean score was 56.92 cor-rect answers out of 118 questions (about 48% corcor-rect) with a standard deviation of 14.98 correct answers. If the distribu-tion of student scores were approximately normal, the 85th percentile score is 72 correct answers (61% correct)—which corresponds to a very low D grade.
When seven functional areas of the exam were graded separately, the mean percent of correct answers across these subsections ranged from 36.5% to 57.6%. Thus, the mean grades ranged from an abysmal F to almost a D. Obviously, use of the MFTB scaled scores and percentiles effectively hides any information on actual student performance on the test.
The Unknown Comparison Group
A student’s scaled score depends on his/her performance relative to that of all students who took the test. Who are these students? We know from Table 1 that, for the current MFTB, 44% of the 438 colleges are members of AACSB, 31% are members of ACSBP, 11% are members of IACBE, and 22% are not members of any of these organizations. However, we do not know how the 32,984 students who took the test are distributed across these accrediting agen-cies. Which students are actually relevant for AOL
assess-ment comparisons for our students? All students? Only those at accredited business schools? Only those at mem-ber schools of the same accrediting agency as our business school? Even choosing to compare an institution’s scores only against others accredited by or members of its accred-iting agency, however, is problematic if there are consid-erable quality differences across these institutions. Yunker (2000), Corcoran (2006), and Francisco, Noland, and Sin-clair (2008) show such differences for AACSB-accredited institutions.
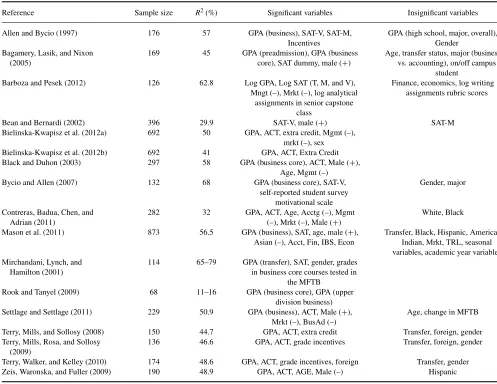
Determinants of Student Performance on MFTB Scores
However, the problem with using the MFTB scores for AOL assessment goes much further than finding the correct peer group of business schools for comparative analysis. It is necessary to select the correct peer students. A number of studies have examined the determinants of student perfor-mance on the MFTB. Table 3, expanded from Bielinsky-Kwapisz, Brown, and Semenik (2012a), summarizes the re-sults of 17 such studies conducted at 13 universities. The authors rounded up the usual suspects common to virtually all studies of student performance: grade point average (GPA; overall, in the business core or some variant thereof), ACT or SAT scores (overall, math, or verbal), sex, age, major, incentive for performance, and transfer or foreign student. GPAs as well as ACT and SAT scores were significant in the 16 studies that included them. Student incentives to do well had a positive significant impact and majoring in marketing or, to a lesser extent, management generally had a nega-tive impact on MFTB scores in studies that included these variables. The impact of sex and age, however, was mixed: sometimes positive, sometimes negative, and, sometimes in-significant. The overall explanatory power of the estimated regression models, measured by the adjustedR2, varied
con-siderably (from 11% to 79%), as did the sample size (65–873 students).
These studies show that individual and institutional MFTB scores are significantly influenced by specific student char-acteristics. Consequently, use of these scores for AOL as-sessment requires detailed analysis of these characteristics. Bush, Duncan, Sexton, and West (2008) stated that, “When interpreting MFTB results, it is important to recognize the uniqueness of your school, students and/or curriculum. . . . [Differences across students or institutions in a wide-variety of factors] . . . alone or combined could contribute to or confound test results” (p. 81). Similarly, Bielinska-Kwapisz et al. (2012a) noted that, “there is an irresistible desire to benchmark against other business programs. However, a comparison . . . of MFT-B scores, within and across dif-ferent student cohorts, can only be truly meaningful if stu-dent characteristics . . . are taken into account” (p. 159). They continue, “The nonavailability of detailed information
THE MAJOR FIELD TEST IN BUSINESS: A SOLUTION TO AOL? 23
TABLE 3
Determinants of Student Performance on the MFTB
Reference Sample size R2(%) Significant variables Insignificant variables
Allen and Bycio (1997) 176 57 GPA (business), SAT-V, SAT-M,
Incentives
GPA (high school, major, overall), Gender
Bagamery, Lasik, and Nixon (2005)
169 45 GPA (preadmission), GPA (business core), SAT dummy, male (+)
Age, transfer status, major (business vs. accounting), on/off campus
student Barboza and Pesek (2012) 126 62.8 Log GPA, Log SAT (T, M, and V),
Mngt (–), Mrkt (–), log analytical assignments in senior capstone
class
Finance, economics, log writing assignments rubric scores
Bean and Bernardi (2002) 396 29.9 SAT-V, male (+) SAT-M
Bielinska-Kwapisz et al. (2012a) 692 50 GPA, ACT, extra credit, Mgmt (–), mrkt (–), sex Bielinska-Kwapisz et al. (2012b) 692 41 GPA, ACT, Extra Credit Black and Duhon (2003) 297 58 GPA (business core), ACT, Male (+),
Age, Mgmt (–)
Bycio and Allen (2007) 132 68 GPA (business core), SAT-V,
self-reported student survey motivational scale
Gender, major
Contreras, Badua, Chen, and Adrian (2011)
282 32 GPA, ACT, Age, Acctg (–), Mgmt (–), Mrkt (–), Male (+)
White, Black
Mason et al. (2011) 873 56.5 GPA (business), SAT, age, male (+), Asian (–), Acct, Fin, IBS, Econ
Transfer, Black, Hispanic, American Indian, Mrkt, TRL, seasonal variables, academic year variables Mirchandani, Lynch, and
Hamilton (2001)
114 65–79 GPA (transfer), SAT, gender, grades in business core courses tested in
the MFTB Rook and Tanyel (2009) 68 11–16 GPA (business core), GPA (upper
division business) Settlage and Settlage (2011) 229 50.9 GPA (business), ACT, Male (+),
Mrkt (–), BusAd (–)
Age, change in MFTB
Terry, Mills, and Sollosy (2008) 150 44.7 GPA, ACT, extra credit Transfer, foreign, gender Terry, Mills, Rosa, and Sollosy
(2009)
136 46.6 GPA, ACT, grade incentives Transfer, foreign, gender
Terry, Walker, and Kelley (2010) 174 48.6 GPA, ACT, grade incentives, foreign Transfer, gender
Zeis, Waronska, and Fuller (2009) 190 48.9 GPA, ACT, AGE, Male (–) Hispanic
regarding business student characteristics makes compar-isons across institutions very unlikely” (pp. 164–165).
Unfortunately, because of the manner in which the MFTB scores are constructed, their use for AOL assessment makes comparisons across institutions inevitable and meaningless. Of course, using the raw scores for such comparisons without adjusting for student characteristics would create the same problem.
Table 4 provides two examples that demonstrate how de-terminants of student performance can confound the use of MFTB scores for student learning assessment. It shows institutional MFTB percentile scores for the University of Arkansas, Fort Smith (Settlage & Settlage, 2011) and the Virginia Military Institute (Bush et al., 2008) for selected periods.
When Settlage and Settlage (2011) analyzed the sharp decline in student scores in Fall 2008 at the University of Arkansas, Fort Smith, they could not find any statistical dif-ference in the impact of the general characteristics of that student cohort compared to those who took the exam
pre-viously. Instead, it appears that students who took the Fall 2008 MFTB were just randomly over-represented by those with lower ACT scores and GPAs and a greater proportion of business administration and marketing majors.
TABLE 4
A Tale of Two Business Schools and the Puzzling Declines in Their MFTB Scores
Institutional MFTB percentile results
University of Arkansas, Fort Smith Virginia Military Institute
Semester Percentile Year Percentile
Spring 2006 95 1998 87
Summer 2006 65 1999 74
Fall 2006 85 2000 80
Spring 2007 80 2001 92
Summer 2007 80 2002 48
Fall 2007 85 2003 93
Spring 2008 85 2004 93
Fall 2008 55 2005 94
At the Virginia Military Institute, Bush et al. (2008) at-tributed the Crash of 2002 to,
...low motivation born of inconsistent administration.
De-spite standing policies, the MFTB was worth only 10% of the Business Policy final grade that year, and the instructor promised no one would score lower than a C....Some
stu-dents sought high scores; others filled their answer sheets withinterestingpatterns and left early. (p. 82)
The problem was due to one instructor’s failure to properly incentivize the students who were taking the test, not to a serious decline in student learning.
Similar analyses of increases in students’ or institutions’ MFTB percentile scores over time may just as easily yield similar conclusions about the impact of student characteris-tics. However, we suspect that business schools will inter-pret such increases as evidence of improvements in student learning. The use of MFTB scores in the context of AOL assessment is fraught with considerable uncertainty unless the influence of the determinants of student performance is explicitly taken into account.
ALTERNATIVES TO THE MFTB FOR AOL ASSESSMENT
If business schools do not use the MFTB for AOL assessment, what might they use? In our opinion, three alternative direct measures of student learning for AOL assessment already used by some business schools avoid the significant problems associated with the use of the MFTB.
Locally Designed Comprehensive Exams
Locally designed comprehensive exams provide measures of student learning that can be focused specifically on assessing business knowledge directly related to the mission and goals of the college’s business program and curriculum. In addition, their other strengths include widespread faculty involvement and support as well as timely and relevant feedback. Bandy-opadhyay and Rominger (2010) discuss the advantages and costs of using such exams for AOL assessment.
Computer Simulation Models
Many business schools use computer simulation models for AOL assessment. For example, the CAPSIM Business Sim-ulation Experience (Capsim Management SimSim-ulations, Inc., Chicago, IL) is used by approximately 500 business schools worldwide.3It has three components that provide opportu-nities to assess student learning at two different points in time. The foundation component measures either individ-ual or group student learning at the business core courses level. The Capstone component measures either individual or group student learning in the senior capstone course. The
Comp-XM exam is designed to measure individual student learning for use with either component. Caldwell, Moore, and Schulte (2004) discussed the importance of the use of computer simulation models for business students.
CAPSIM does not provide a complete list of all business schools that use their computer simulations. However, they do list 34 business schools and testimonials from faculty or students at 21 other business schools that use CAPSIM. Of these 55 business schools, 47 are accredited by AACSB, two are accredited by ACBSE, none are accredited by IABSE, and six are not accredited by any of these three agencies.
The ACBSE and IACBE explicitly recognize the Pere-grine Outcomes Assessment (PerePere-grine Academic Services, LLC, Gillette, WY) as appropriate for AOL assessment. Pere-grine’s assessment methods and reports differ substantially from those for the MFTB. Specifically, Peregrine Academic Services (2013, pp. 1–2) utilized a pretest–posttest procedure for assessing student learning:
Students take the exam early in their academic program, usu-ally within their first major course (Inbound Exam). Students take the same exam at the end of their program, usually just before graduation within their last course (Outbound Exam). The comparison in scores between the Inbound exam and the Outbound exam is used for internal benchmarking. The com-parison of the outbound exam scores with the results from other universities is used for external benchmarking.4
Peregrine lists 73 associate and bachelor-degree business programs that presently use its exams.
SUMMARY AND CONCLUSIONS
AOL assessment is a process that requires at least two dif-ferent components. First, it should provide valid informa-tion about current student learning performance (i.e., an-swer the question “what do they know now?”). Second, it should provide some insight into changes in course content, programs and curriculum that will increase student learning in the future—the ubiquitous continuous improvement and closing the loop efforts.
Unfortunately, the MFTB cannot be used for either of these purposes. Its test results are scored and reported in a manner that makes it impossible to determine how well business students have actually learned the common body of knowledge expected of business graduates. Comparisons of MFTB performances either across time or across institutions are invalid because the test results are significantly driven by individual student characteristics of an unknown (and un-knowable) group of students enrolled at diverse non-random business schools.
For these reasons, the MFTB scores should not be used to assess student learning or to justify course or curriculum changes. Thus, the MFTB offers only a pretend solution to
THE MAJOR FIELD TEST IN BUSINESS: A SOLUTION TO AOL? 25
the assessment of student learning in business. Those seeking real solutions to the AOL assessment problem should look elsewhere.
ACKNOWLEDGMENTS
The authors would like to thank session participants at the 2012 Eastern Economics Association Annual Conference and colleagues at an Economics Department seminar for their comments on an earlier version of this article. In particular, they thank Professor Shaheen Borna for numerous sugges-tions that greatly improved this article.
NOTES
1. A general discussion of the MFTB can be found at http://www.ets.org/Media/Tests/MFT/pdf/mft testdesc
business 4cmf.pdf.
2. Henninger (1994) and Caldwell et al. (2004) com-pared AACSB and ACBSP accreditation standards; Roller, Andrews, and Bovee (2003); Julian and Ofori-Dankwa (2006); and Corcoran (2007) discussed those for AACSB, ACBSP, and IACBE.
3. For further information on CAPSIM, see http:// www.capsim.com/
business-simulations/academic/our-schools.html 4. For further information on Peregrine Academic
Services, see http://www.peregrineacademics.com/ services/program-learning-outcomes-assessment.php
REFERENCES
Allen, J. S., & Bycio, P. (1997). An evaluation of the Educational Testing Service Major Field Achievement Test in Business.Journal of Accounting Education,15, 503–514.
Bagamery, B. D., Lasik, J. J., & Nixon, D. R. (2005). Determinants of success on the ETS Business Major Field Exam for students in an undergraduate multisite regional university business program.Journal of Education for Business,81, 55–63.
Bandyopadhyay, S., & Rominger, A. (2010, March/April). Testing, 1...2
....BizEd, 34–38.
Barboza, G. A., & Pesek, J. (2012). Linking course-embedded assessment measures and performance on the Educational Testing Service Major Field Test in Business.Journal of Education for Business,87, 159–169. Bean, D. F., & Bernardi, R. A. (2002). Performance on the Major Field Test
in Business: The explanatory power of SAT scores and gender.Journal of Private Enterprise,17/18(2/1), 172–180.
Bielinska-Kwapisz, A., Brown, F. W., & Semenik, R. (2012a). Is higher better? Determinants and domparisons of performance on the Major Field Test in Business.Journal of Education for Business,87, 159–169. Bielinska-Kwapisz, A., Brown, F. W., & Semenik, R. (2012b). Interpreting
standardized assessment test scores and setting performance goals in the context of student characteristics: The case of the Major Field Test in Business.Journal of Education for Business,87, 7–13.
Black, H. T., & Duhon, D. L. (2003). Evaluating and improving stu-dent achievement in business programs: The effective use of stan-dardized assessment tests.Journal of Education for Business,79, 90– 98.
Bush, H. F., Duncan, F. H., Sexton, E. A., & West, C. T. (2008). Using the Major Field Test-Business as an assessment tool and impetus for program improvement: Fifteen years of experience at Virginia Military Institute. Journal of College Teaching & Learning,5, 75–88.
Bycio, P., & Allen, J. S. (2007). Factors associated with performance on the Educational Testing Service (ETS) Major Field Achievement Test in Business (MFAT-B).Journal of Education for Business,82, 196– 201.
Caldwell, R. W. Jr., Moore, J. R., & Schulte, M. (2004). What should a BBA graduate be able to do?: These competencies are essential.Journal of College Teaching & Learning,1(3), 31–36.
Contreras, S., Badua, F., Chen, J. S., & Adrian, M. (2011). Documenting and explaining Major Field Test results among undergraduate students. Journal of Education for Business,86, 64–70.
Corcoran, C. P. (2006). AACSB accredited business programs: Differences and similarities.Journal of Business & Economics Research,4(8), 41–48. Corcoran, C. P. (2007). Distinctions among accreditation agencies for
busi-ness programs.Journal of College Teaching & Learning,4(9), 27–30. Educational Testing Service (ETS). (2007).Sample student report. Retrieved
from http://www.ets.org/Media/Tests/MFT/pdf/MFT sample reports 2007/BusinessScoreReport.pdf
Education Testing Service (ETS). (n.d.).MFT test description. Retrieved from http://www.ets.org/s/mft/pdf/mft testdesc business 4jmf.pdf Francisco, W., Noland, T. G., & Sinclair, D. (2008). AACSB accreditation:
Symbol of excellence or march toward mediocrity?Journal of College Teaching & Learning,5(5), 25–29.
Henninger, E. A. (1994). Outcomes assessment: The role of business school and program accrediting agencies.Journal of Education for Business,69, 296–298.
International Assembly for Collegiate Business Education. (2011). Accredi-tation process manual. Retrieved from http://iacbe.org/pdf/accreditation-process-manual.pdf
Julian, S. D., & Ofori-Dankwa, J. C. (2006). Is accreditation good for the strategic decision making of traditional business schools?Academy of Management Learning & Education,5, 225–233.
Ling, G. (2009). Why the Major Field (Business) test does not report subscores of individual test-takers: Reliability and con-struct validity evidence. Unpublished ETS paper. Retrieved from https://www.ets.org/Media/Conferences and Events/AERA 2009 pdfs/ AERA NCME 2009 Ling.pdf
Martel, K. (2007). Assessing student learning: Are business schools making the grade?Journal of Education for Business,82, 189–195.
Mason, P. M., Coleman, B. J., Steagall, J. W., Gallo, A. A., & Fabritius, M. M. (2011). The use of the ETS Major Field Test for assurance of business content learning: Assurance of waste?Journal of Education for Business, 86, 71–77.
Mirchandani, D., Lynch, R., & Hamilton, D. (2001). Using the ETS Major Field Test in Business: Implications for assessment.Journal of Education for Business,76, 51–56.
Peregrine Academic Services. (2013).Our services/program assessment exams. Retrieved from http://www.peregrineacademics.com/services/ program-learning-outcomes-assessment.php
Porter, K. (2011). The pretend solution: An empirical study of bankruptcy outcomes.The Texas Law Review,90, 103–162.
Pringle, C., & Michel, M. (2007). Assessment practices in ASCSB-accredited business schools. Journal of Education for Business, 82, 202–211.
Roller, R. H., Andrews, B. K., & Bovee, S. L. (2003). Specialized ac-creditation of business schools: A comparison of alternative costs, ben-efits, and motivations. Journal of Education for Business, 78, 197– 204.
Rook, S. P., & Tanyel, F. I. (2009). Value-added assessment using the Major Field Test in Business.Academy of Educational Leadership Journal,13, 3.
Settlage, D. M., & Settlage, L. M. (2011). A statistical framework for assess-ment using the ETS Major Field Test in Business.Journal of Education for Business,86, 274–278.
Terry, N., Mills, L., Rosa, D., & Sollosy, M. (2009). Do online students make the grade on the Business Major Field ETS Test?Academy of Educational Leadership Journal,13, 109–118.
Terry, N., Mills, L., & Sollosy, M. (2008). Student grade motivation as a determinant of performance on the business Major Field ETS exam. Journal of College Teaching & Learning,5, 27–32.
Terry, N., Walker, J., & Kelley, G. (2010). The determinants of student performance on the Business Major Field ETS Exam: Do community college transfer students make the grade?The Journal of Human Resource and Adult Learning,6, 1–8.
Yunker, J. A. (2000). Doing things the hard way—Problems with mission-linked AACSB accreditation standards and suggests for improvement. Journal of Education for Business,75, 348–353.
Zeis, C., Waronska, A., & Fuller, R. (2009). Value-added program as-sessment using nationally standardized tests: Insights into internal va-lidity issues. Journal of Academy of Business and Economics, 9, 114–128.