Full Terms & Conditions of access and use can be found at
http://www.tandfonline.com/action/journalInformation?journalCode=cbie20
Download by: [Universitas Maritim Raja Ali Haji] Date: 17 January 2016, At: 23:33
Bulletin of Indonesian Economic Studies
ISSN: 0007-4918 (Print) 1472-7234 (Online) Journal homepage: http://www.tandfonline.com/loi/cbie20
The Role of Health Insurance Membership in
Health Service Utilisation in Indonesia
Yogi Vidyattama, Riyana Miranti & Budy P. Resosudarmo
To cite this article: Yogi Vidyattama, Riyana Miranti & Budy P. Resosudarmo (2014) The Role of Health Insurance Membership in Health Service Utilisation in Indonesia, Bulletin of Indonesian Economic Studies, 50:3, 393-413, DOI: 10.1080/00074918.2014.980380
To link to this article: http://dx.doi.org/10.1080/00074918.2014.980380
Published online: 03 Dec 2014.
Submit your article to this journal
Article views: 529
View related articles
Bulletin of Indonesian Economic Studies, Vol. 50, No. 3, 2014: 393–413
ISSN 0007-4918 print/ISSN 1472-7234 online/14/000393-21 © 2014 Indonesia Project ANU http://dx.doi.org/10.1080/00074918.2014.980380
THE ROLE OF HEALTH INSURANCE MEMBERSHIP IN
HEALTH SERVICE UTILISATION IN INDONESIA
Yogi Vidyattama Riyana Miranti
University of Canberra University of Canberra
Budy P. Resosudarmo The Australian National University
In 2014, Indonesia implemented a new, nationwide, subsidised universalcoverage health insurance program, under which poor Indonesians do not pay to become members and others pay a relatively low fee. This program has created a national debate about the effectiveness of the ownership of health insurance in increasing the use of health services—particularly among the poor—given the limitations in their quantity and quality. Using membership data on different health insurance programs from the 2007 rounds of Susenas and Riskesdas, this article researches the impact of having health insurance on health service utilisation, by controlling the levels of quality and quantity of health services in the area. We argue that having health insurance increases health service utilisation by approximately eight per -centage points when people feel sick (or by approximately ive per-centage points if we include those who do not feel sick).
Keywords: health insurance, development studies, policy impact
JEL classiication: I13, I15, I38, O15
INTRODUCTION
Since the early 2000s, the Indonesian government has been interested in rolling out a nationwide, subsidised universalcoverage health insurance program, not least because outofpocket expenditure as a percentage of private expenditure on health has remained relatively high and made health care utilisation inequitable. In 2001, for example, the ratio of consultation rates for doctors among people in the poorest and the richest quintiles was 0.8 (OECD and World Health Organiza
-tion 2012), whereas it was expected to be closer to 1.0.
In January 2014, Indonesia implemented such a health insurance program: poor Indonesians do not pay to join, while others pay a relatively low fee. The program is expected to reduce outofpocket expenditure (Aji et al. 2013),1 which composed
approximately 80% of private health expenditure in Indonesia between 2005 and
1. The relation between outofpocket expenditure and health insurance is complex and beyond the scope of this article.
394 Yogi Vidyattama, Riyana Miranti, and Budy P. Resosudarmo
2008, before dropping to around 77% between 2009 and 2011. Comparable per
-centages in Malaysia and Thailand were lower, at 76% and 66%, respectively, between 2005 and 2008, and 77% and 57% between 2009 and 2011.2
Yet the program has created a national debate (as have similar programs in other developing countries) about its effectiveness in increasing the utilisation of health services—particularly among the poor—given the existing quantity and quality of public health services. Its implementation brings with it several challenges, par
-ticularly for the supply side of providing health services. First, the disparity among levels of development in Indonesia remains great (Vidyattama 2013), and there are concerns about whether there is suficient access to health services—particularly in less developed areas with challenging geographical conditions—and whether the poor have enough information to understand the beneits of having health insurance. Second, the provision of universal health insurance may potentially increase the burden on the capacity of the public health system, which has been argued to be already stretched, even without the application of a universal scheme (World Bank 2012). Third, the supply of health providers in Indonesia, especially on the public side, has been affected by economic downturns. The 1997–98 Asian inancial crisis, for example, reduced the funding allocated to maintaining the country’s network of health centres, including hospitals, community health clin -ics (puskesmas), and local, integrated health care posts (posyandus) (Hotchkiss and
Jacobalis 1999). In addition, decentralisation has shifted the administration of the formerly centralised network to the local government. Although some health cen
-tres have beneited from funding allocated by their local governments, many have faced a lack of transparency in local government management or a lack of funding in certain district governments (Kristiansen and Santoso 2006). This has dimin
-ished the supply of public health providers or facilities. It is therefore important to understand and anticipate the increase in demand for health services that may follow the implementation of subsidised universalcoverage health insurance.
Using membership data for various health insurance programs in Indonesia— that is, private or nonsubsidised, partially subsidised, and fully subsidised health insurance programs—this article researches the role of health insurance member
-ship in the decision to seek treatment at a health facility when one feels sick. It controls for accessibility and for the quality and quantity of health services across areas, among other variables. This article also attempts to estimate the impact of health insurance ownership on the use of health services, taking into account their quantity and quality, regardless of whether the insurance owner feels sick—that is, it considers those using the services for preventive care. It also observes other individual demographic, socioeconomic, and geographical location characteris
-tics affecting the effectiveness of health insurance membership in determining the decision to access health services.3
Many studies of other countries have examined the implementation of nation
-wide, subsidised universalcoverage health insurance. In China, for example, it
2. Authors’ calculations based on data from the World Bank (2013).
3. Consequently, this article observes the demand side of health services with supplyside controls in place. It is true that there are also supplyside issues, such as low levels of public and private expenditure on providing healthrelated facilities. However, these issues are beyond the scope of this article.
The Role of Health Insurance Membership in Health Service Utilisation 395
was shown to have increased hospital outpatient and inpatient utilisation (Wag
-staff and Pradhan 2005, Wag-staff et al. 2009). A similar result was found in Sen
-egal (Jütting 2003), but not among the poor in remote areas of Vietnam (Wagstaff 2007, Ekman et al. 2008). Studies of lowincome countries have also found that the impact of this policy is not signiicant for certain groups in society (Ekman 2004, McIntyre 2007). Hence, there has been serious debate about the effectiveness of such a policy. So far, such studies of Indonesia have been relatively limited. Prad
-han, Saadah, and Sparrow (2007) assessed the effectiveness of the implementation of the socialsafetynet (SSN) Health Card program (which gives the poor free access to government health services) as a response to the 1997–98 Asian inancial crisis. Hidayat et al. (2004) and Hidayat and Pokhrel (2009) analysed the impact of mandatory health insurance for civil servants (Asuransi Kesehatan [Askes]) and the governmentprovided insurance scheme through PT Jamsostek on outpatient visits at public and private health facilities.
This article differs from those of Pradhan, Saadah, and Sparrow (2007), Hidayat et al. (2004), and Hidayat and Pokhrel (2009) in several ways. First, it investigates the impact of membership across different health insurance schemes; Pradhan et al.’s (2007) study examines only the fully subsidised health insurance scheme for the poor, and the studies of Hidayat et al. (2004) and Hidayat and Pokhrel (2009) examine only the Askes and PT Jamsostek schemes. Although this arti
-cle does not focus on measuring the performance of each scheme, it attempts to observe possible variations among them in the impact of membership. Second, this article analyses data from the 2007 rounds of the Basic Health Research Sur
-vey (Riset Kesehatan Dasar [Riskedas]) and the National Socioeconomic Sur-vey (Survei Sosial Ekonomi Nasional [Susenas]). The Riskesdas database covers the nation, in contrast to the Indonesia Family Life Survey database used by Hidayat et al. (2004) and Hidayat and Pokhrel (2009). Furthermore, Riskesdas provides more reliable information on health service utilisation and the types of diseases affecting household members. It also includes variables that are not captured in Susenas—the main dataset used in Pradhan, Saadah, and Sparrow’s (2007) study—and that may inluence one’s decision about accessing health services, such as the travel time to the nearest health service provider and the distance to the provincial capital city. Third, this article’s period of observation differs from those used by Pradhan, Saadah, and Sparrow (2007), Hidayat et al. (2004), and Hidayat and Pokhrel (2009), who focused on the crisis years of 1997–98. This arti
-cle looks at 2007, which can be considered a normal year.
This article has its shortcomings. For example, it is not able to distinguish between the role of health insurance membership in a person’s decision, when sick, to seek treatment at a public health facility or at a private health facility. This article also does not discuss the impact of health insurance membership on out ofpocket health expenditure. It attempts to take account of these shortcomings in
its concluding sections.
HEALTH INSURANCE PROVISION IN INDONESIA
Health insurance in Indonesia has a long history; in the colonial period, insurance companies provided policies to middleincome earners, and organisations such as labour unions established mutual health insurance plans for their members. Such
396 Yogi Vidyattama, Riyana Miranti, and Budy P. Resosudarmo
forms of health insurance continued after independence in 1945 (Soedjono 1956). The government’s irst major attempt to introduce health insurance for public servants took the form of Askes, in 1968 (table 1).4
In 1969, several community organisations introduced the Health Fund (Dana Sehat) program, which operated under a microinance scheme. This program was promoted by the government, and provided a kind of health insurance for its members. Despite having government support, the Health Fund program was not adopted by the majority of Indonesia’s population (Nugroho and Elliott 1977); it suffered from high dropout rates, lowquality beneits, limited coverage, and lack of access for the poor, among other problems (Thabrany et al. 2003).
In 1992, a new communitybased health insurance program, Jaringan Pemeliharaan Kesehatan Masyarakat (JPKM), was launched in parallel with an improved Health Fund (Soors et al. 2010). This was the Indonesian version of a managed care program, inspired by the health maintenance organisations (HMOs) of the United States. (HMOs combined a commercialbased health insur
-ance model with social aims of reaching the poor.) Yet owing to the underfunding of the JPKM program and the poor quality of its beneits, fewer than 500,000 peo
-ple registered as members, so it was also considered unsuccessful and its expan
-sion was put on hold (ScheilAdlung 2004). At the same time, Jaminan Sosial Tenaga Kerja (Jamsostek) was introduced to provide health insurance for private, formalsector employees and employers.5
In 1994, the Ministry of Health introduced the irst stage of its Health Card program covering puskesmas and targeted to poor households (Johar 2009, 2010). These cards were poorly distributed, however, because there were no proper
guidelines to help puskesmas distribute the cards among the poor and no incen
-tives for them to do so.
In 1998, in an effort to soften the impact of the 1997–98 Asian inancial cri
-sis on the poor, the Indonesian government implemented a major SSN program, Jaringan Pengaman Sosial. This program involved the largescale provision of SSN health cards to the poor—this was the government’s second health card pro
-gram—to allow them to receive free health treatment from government health centres. Initially, the program was implemented using the JPKM–HMO model, with hundreds of JPKMs established at the provincial and district levels. Yet most of these JPKMs failed to perform, so the Ministry of Health took over the manage
-ment of the program and distributed the funds directly to provincial or district health ofices instead.
Pradhan, Saadah, and Sparrow (2007), from their impact evaluation research, found that approximately 34% of households in the lowest quintile owned SSN health cards and that the use of modern health care among holders of health cards increased. (If we include the secondlowest quintile, 59% of households owned cards.) However, the implementation of the SSN program faced problems, includ
-ing mistarget-ing—leakage to wealthier households was substantial. Wealthier
4. Private health fund schemes existed before 1968, mostly controlled by labour unions or social organisations such as Muhammadiyah or other religious groups. These schemes generally served middleincome earners, were closed to the public, and had only limited coverage.
5. Another form of health insurance is Asabri, which is targeted to the police and the military.
TABLE 1 Milestones of Health Insurance Provision in Indonesia, 1968–2014
Year/s Program Target beneiciaries Responsible party
1968 Askes Active & retired civil servants & their
immediate family (mandatory) Ministry of Health, with Askes Persero 1969–1990s Communitybased health
insurance, Health Fund, & Dana Sehat
Members of communities, informal sector
(voluntary) Cooperation—community leaders responsible for establishing a structure for health activities & for acting on community decisions
1992 Workforce Social Security
(Jamsostek) Private, formalsector employees & their dependents (mandatory) Ministry of Manpower & Transmigration, with PT Jaminan Sosial Tenaga Kerja (PT Jamsostek Persero)
1992 JPKM (communitybased health
insurance scheme) & HMOs Informal sector, civil servants, & military, for their uncovered dependents (voluntary) Bapels, for daily application of JPKMs; government & local professional organisations (Badan Pembina) monitor implementation 1994 Health Card (Kartu Sehat) Targeted poor households Ministry of Health
1998 Social Safety Net (JPS)a Targeted poor households Ministry of Health took over the program in 1999,
after most JPKMs set up to support JPS failed 2001 Law 22/1999 on Regional Governance implemented
2004 Askeskin Identiied poor, based on individual &
household targeting PT Askes, until 2007 2004 Law 40/2004 on the National Social Security System issued
2008 Jamkesmas and Jaminan
Kesehatan Masyarakat replaced Askeskin
Targeted poor and near-poor households
(a larger target than that of Askeskin) Ministry of Health took over full management of the program; PT Askes still responsible for managing membership
2011 Law 24/2011 on the Social Security Management Agency mandated that the agency would be operational by 1 January 2014 2014 Universal National Health
Insurance launched Aims to cover everyone by 2019 Social Security Management Agency
Sources: Data from Brodsky, Habib, and Hirschfeld (2003, 146); Johar (2009, 2010); Rokx et al. (2009, table 3.1); ScheilAdlung (2004); Sparrow (2011); Suryahadi, Suharso, and Sumarto (2001); and Soors et al. (2010).
Note: JPKM = Jaringan Pemeliharaan Kesehatan Masyarakat. HMOs = health maintenance organisations. Bapels = managed care organisations.
aJPS (Jaring Pengaman Sosial) was not limited to health subsidies; it covered workfare, subsidised rice sales, targeted scholarships, and village block grants. The program was implemented using the JPKM–HMO model as the ‘carrier’ at the provincial and district levels.
398 Yogi Vidyattama, Riyana Miranti, and Budy P. Resosudarmo
households, in the fourth and ifth quintiles, held about 20% of the health cards (Pradhan, Saadah, and Sparrow 2007). Further, the issue of transportation (such as the availability of road infrastructures and public transport between the loca
-tion of the poor and the nearest health service provider) and its related cost hin
-dered participation in the program by the poor.
In 2004, the Health Card program was replaced by a health insurance program for the poor, Asuransi Kesehatan Masyarakat Miskin (Askeskin). The main objec
-tive of this scheme was to expand socialsecurity program coverage to the infor
-mal sector. Sparrow, Suryahadi, and Widyanti (2013) argued that Askeskin can be
considered successful in targeting the poor and increasing the use of outpatient
services by the poor. Nevertheless, there is evidence for a slight increase in outof pocket expenditure in urban areas, probably because of an increase in relatively more expensive hospital care—an increase that Askeskin has not fully covered (Sparrow, Suryahadi, and Widyanti 2013).
Askeskin was then expanded into Jamkesmas (Jaminan Kesehatan Masyarakat) in 2008, to cover (some of) the nearpoor.6 The program was fully inanced by
the central government and administered by the Ministry of Health, with both public and private health providers involved. Despite Jamsekmas covering more of the nearpoor than previous programs, Harimurti et al. (2014) argued that it covered only approximately 47% of Indonesia’s poor and nearpoor households. Although it has increased utilisation rates, particularly for outpatient services, it has faced challenges. These include evidence of substantial mistargeting and leakages to the nonpoor (20% of Jamkesmas beneiciaries in 2010 were in the top three deciles); low levels of socialisation and awareness of beneits; inconsisten
-cies across regions in applying targeting criteria and providing basic beneits; and poor accountability and relatively low levels of inancial protection (Harimurti et al. 2014).
In addition to Jamkesmas, several regional governments established a regional health insurance program called Jamkesda, designed mostly as an extension of Jamkesmas, with the objective of covering a population of nearpoor on top of that covered by Jamkesmas.7 By the late 2000s, various private health insurance
programs had also been established in Indonesia. Major Indonesian banks, such as BNI, Mandiri, and BCA offered such programs to their clients. Private health insurance can also be obtained from several private Indonesian insurance compa
-nies, such as PT Sinarmas, PT Adisarana Wanartha, and PT Tugu Mandiri. Multi
-national insurance companies, such as Prudential, Allianz, and Commonwealth Life, also entered the Indonesian health insurance market in the 2000s.
Based on data from the Ministry of Health (2013), by December 2012 more than 163 million people, or 69% of the population, were covered in one way or another
6. Some of the nearpoor were covered because targeting the nearpoor is dificult, and because many people are living just above the poverty line, so a slight change in the deini -tion of ‘nearpoor’ means that a lot of people fall either in or out of the nearpoor group. To give an idea of the numbers of people missing out, an assessment by the World Bank (2011) claimed that approximately 52% of the poorest 30% of the population were still without health insurance in 2010.
7. We include these different health care programs in our deinition of health insurance, since health care is considered to be fully subsidised health insurance.
The Role of Health Insurance Membership in Health Service Utilisation 399
by health insurance. Jamkesmas, which covered more than 76 million people in 2010, is the largest health insurance scheme. Nevertheless, at least 30% of Indone
-sians—mostly the poor and the nearpoor—were still not covered by any kind of medical insurance at the end of 2012.
On 1 January 2014, the Indonesian government launched the irst stage of the new Universal National Health Insurance scheme organised by the newly estab
-lished Social Security Management Agency (Badan Penyelenggara Jaminan Sosial [BPJS]). This new scheme will integrate Jamkesmas with all other health insurance programs, including Askes, Jamsostek, and some of the Jamkesda schemes. Its
launch was based on two pieces of legislation: Law 40/2004 on the National Social
Security System and Law 24/2011 on the Social Security Management Agency. BPJS has set a irststage target of insuring at least 121.6 million people by the end of 2014, while the inal target of the scheme is to insure the whole population by 2019 (around 268 million people). It aims to provide a comprehensive package, which includes not only curative services but also preventive and rehabilitative services, and to cover all types of natural illness. Yet the calculation of insurance premiums is complex and depends on the employment status of the recipients. For example, the government will provide a monthly subsidy for people catego
-rised as poor. However, employers and employees will need to share 5%–6% of wages to pay the insurance premium, while those who work in the informal sec
-tor will need to contribute 5%–6% of their monthly income (Simmonds and Hort 2013).
CONCEPTUAL FRAMEWORK
This article develops a reduced demand function of health services—that is, a demand function that takes into account various conditions on the supply side, paying particular attention to membership and the types of health insurance held. The most widely cited model in the research on the demand for health services is the behavioural model (BM) developed in 1968 by Ronald M. Andersen, an American medical sociologist (Andersen 1968). The latest iteration of this BM (in Babitsch, Gohl, and Von Lengerke 2012) includes three groups of factors: predis
-posing factors, which include individual characteristics such as age, sex, ethnicity, and family type, as well as cultural norms and the demographic and social com
-position of communities; enabling factors, which include the income and wealth of an individual and whether they have health insurance, as well as factors repre
-senting the supply side of health services, such as the availability of health service facilities and personnel, their travel time, and the means of transportation; and need factors, including the perceived need for health services, individuals’ per
-ceptions of their need to utilise health care, and the evaluated need (that is, profes
-sional assessments of patients’ health status and the need for care).
In implementing this BM, researchers often modify the model or add deter
-minants such as the spatial location of residence. Pradhan, Saadah, and Sparrow (2007) argued the importance of this determinant, owing to, in their case, system
-atic differences between regions in the allocation of health insurance coverage (the Health Card) and health care funding. The importance of spatial location is also the focus of Erlyana, Damrongplasit, and Melnick’s (2011) study of health service utilisation.
400 Yogi Vidyattama, Riyana Miranti, and Budy P. Resosudarmo
LopezCevallos and Chi (2010) developed a modiied version of the BM for Ecuador. The need factors in this model are based on the responses of individuals with health problems during a certain period and on how many health problems individuals mentioned in the past. They also divided the utilisation of health care services into preventive care (for example, if an individual has visited a physician for a preventive appointment in the last 30 days) and curative care (for example, whether an individual has visited a physician for a curative appointment in the last 30 days or has been hospitalised in the last 12 months).
Another modiication made by researchers involves extending the implemen
-tation of the model, for further analysis. Jütting (2003), for example, who analysed the impact of a communitybased health insurance scheme for the poor in rural Senegal, used a similar approach to Andersen’s (1968) BM, not only for health care utilisation but also for health care expenditure. Sparrow, Suryahadi, and Widyanti (2013) conducted a similar extension, for an Indonesian case. They observed the determinants of utilisation of outpatient facilities (the number of visits in the last month) at public and private health care providers, outofpocket health spend
-ing, and the incidence of catastrophic spending (deined as health spending that exceeds 15% of total household spending).
Ensor and Cooper (2004), in contrast, indirectly examined the determinants of the utilisation of health care by identifying its barriers from the supply and demand sides of health services. The supply side includes input prices such as the cost of staff, capital equipment, and buildings; knowledge of treatment tech
-nology; and management eficiency. The demand side includes coverage costs (oficial and unoficial charges, travel costs, and opportunity costs of lost work); household characteristics (including incomes and level of education); cultural characteristics; and knowledge of available health care.
In estimating these models of health service utilisation, the most common com
-plications involve selfselection and endogeneity. The irst arises from nonsick people not being included in the regression sample (Jütting 2003); the second arises from a possible reverse causality direction between insurance holders and the demand for health care services (Sparrow, Suryahadi, and Widyanti 2013). The second relates to the possibility that people have health insurance because they expect to get sick, so growing numbers of insurance holders increase the demand for health care services. In addition, people who join a health insurance program might have other unobservable characteristics that make them more likely to join and might inluence their decision to use a health care service (Waters 1999).
MODEL SPECIFICATION AND DATA SOURCES
To research the role of health insurance membership in the decision to seek treat
-ment at a health facility when people feel sick, this article uses a version of the BM speciied in the following conditional probit model:
Pr
(
Yi=1|Xi=1)
=α+βHHi+Piβp+Eiβe+ei (1)
where Pr
(
Yi=1|Xi=1)
is whether a person utilised a formal health service, Pr(
Yi=1)
, given he or she felt sick,Xi=1, last month. Being an outpatient (berobatjalan) in the previous month is the binomial variable representing the utilisation
The Role of Health Insurance Membership in Health Service Utilisation 401
of formal health services. To estimate equation (1), this article limits its sample to include only those who reported that they felt sick in the previous month.
The binomial variable Hi , the main variable of interest in this article, denotes whether individual i has health insurance or is covered by a health care program.
The variables in Pi represent predisposing factors such as age, sex, marital status, number of family members, and education level, while the variables in Ei denote enabling factors such as employment status, household food expenditure as a proxy of income, and variables representing physical access and the condition of the supply sides of health services. In an effort to control the quality of the supply side of health services in the area, we include several geographical variables in this vector, such as the time needed to get to the nearest medical centre, the gross regional product per capita in the resident’s district, the local government health budget per capita, the distance from the district to provincial capital cities, and dummies for the island of the resident.
This article is also interested in observing the role of health insurance member
-ship in a nonsick person’s decision to use health services for preventive activities such as vaccinations. If information on whether a person utilised a formal health service in the previous month—even if he or she did not feel sick—had been avail
-able in the 2007 Susenas and Riskesdas datasets, the model to be estimated, using the whole sample, would be as follows:
Pr
(
Yi=1)
=α+βHHi+Piβp+Eiβe+ei (2)
However, Susenas and Riskesdas asked whether a person used a formal health service in the previous month only if that person reported that he or she felt sick. We overcome this lack of information in two ways. First, we correct the selection bias by estimating equation (1) using only the cases of those who reported feeling sick in the previous month, applying the Heckman (1979) correction procedure to the whole sample. We use the widespread outbreak of an infectious disease in a vil
-lage as the main instrument to predict whether someone in the vil-lage will report that they felt sick in the previous month.8 If the instrument is strong, this should be
a good enough parameter to represent the impact of health insurance membership in the decision to use health services regardless of whether one feels sick. Second, we reestimate equation (1) with the whole sample; that is, we include those who did not report that they felt sick in the previous month. This procedure is equal to estimating the following joint probit model using the whole sample:
Pr
(
Yi=1∩Xi=1)
=α+βHHi+Piβp+Eiβe+ei (3)Assuming that Pr
(
Xi=1|Yi=1)
≈1(that is, if a person used health services inthe previous month, he or she most likely reported feeling sick in that month) implies that Pr
(
Yi=1∩Xi=1)
≈Pr(
Yi=1)
.9 This is a plausible assumption, sincevisiting a health centre for preventive care is not yet common in Indonesia.
8. The empirical results of this article show that a widespread outbreak of an infectious disease is a valid instrument, as its correlation with the error term of the main equation estimated is relatively insigniicant ( that is, less than 1%).
9. Note that Pr
(
Yi=1∩Xi=1)
=Pr(
Xi=1|Yi=1)
⋅Pr(
Yi=1)
.402 Yogi Vidyattama, Riyana Miranti, and Budy P. Resosudarmo
The main dataset for this article is Susenas, a household survey conducted since 1963 and annually since 1989. It includes data on households (such as household size, household expenditure, and type of housing and amenities) and individuals (such as education level, employment status, sex, and age). This article uses data from the core Susenas module of 2007, since its sample of 280,000 households was also the sample used in the 2007 round of Riskesdas, which was based on interviews with the heads of households (Ministry of Health 2008). Together these databases provide a comprehensive picture of the condition of Indonesian house
-holds and individuals, especially in relation to health. At the individual level, the database for this article contains 856,592 observations. Considering the size and construction of the sample used in the 2007 rounds of Susenas and Riskesdas, it can be argued that the dataset that we use in this article is representative of the country’s general population.
The ability to merge the 2007 Susenas and Riskesdas datasets is the main reason not to use the latest Susenas dataset, for 2012. The merged dataset provides more information on the health status of individuals and is also more reliable than the single 2012 survey.10 Another reason not to use Susenas alone is that this article
would have to rely on a smaller dataset. In 2012, Susenas was conducted quarterly and much of the information is not very comparable, owing to seasonal changes across the quarters. This article would have to limit its data to information from one of these quarterly surveys, which contains fewer observations (approximately 270,000 individuals). Nevertheless, a brief analysis of these data suggests that the results from the 2012 Susenas dataset do not differ much from the results from the 2007 Susenas–Riskesdas dataset.
Among the many variables in the 2007 Susenas–Riskesdas dataset, the main information of interest here is on ownership of health insurance (including being covered by a health care program). The dataset provides information on owner
-ship of insurance policies or coverage by seven health insurance groups: (a) health insurance for civil servants (Askes); (b) social insurance for workers (Jamsostek); (c) private health insurance; (d) reimbursement of health costs by a company; (e) health care for the poor; (f) community health funds; and (g) JPKM and other regional insurance schemes. The Askes group also includes insurance for military veterans and civilservice retirees. The health care for the poor group includes several different schemes targeting people with low incomes—such as Askeskin and Jamkesmas, JPKMM (Jaminan Pemeliharaan Kesehatan Masyarakat Miskin), JPK Gakin (Jaminan Pemeliharaan Kesehatan Keluarga Miskin), and the Health Card program (Kartu Sehat). Furthermore, the dataset provides details on eight types of illnesses: fever, cough, lu or cold, asthma or breathing dificulties, diar
-rhoea, headache, toothache, and other unspeciied illnesses. As mentioned before, the proxy for health service utilisation is whether an individual was in outpatient care in the previous month. By observing different types of health insurance pro
-grams and illnesses, we can investigate the impact of different types of health insurance and health care programs on health service utilisation in response to
10. Please note that although information on selfreported illness and different types of symptoms is also available in Susenas, this article uses those available in Riskesdas. We believe that the information in Riskesdas is more reliable. Nevertheless, we acknowledge the potential problems of using selfreported information.
The Role of Health Insurance Membership in Health Service Utilisation 403
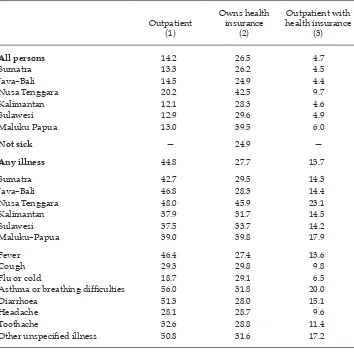
different types of illness; the response regarding being an outpatient, for example, could differ depending on the type of illness and the type of health insurance coverage that one has. Table 2 shows the percentage of outpatients by illness and
region in Indonesia and the percentage of health insurance ownership in 2007.
The irst row of table 2 shows that in 2007 approximately 14% of people had been outpatients in the previous month and that 27% of people had some kind of
health insurance. Nusa Tenggara reported the highest proportion of outpatients,
20%, and also the highest proportion covered by health insurance, 43%. The ‘Not sick’ row shows the proportion of people who were not affected by any illness in the previous month, while the ‘Any illness’ row shows those who reported feeling sick and were affected by any illness in the previous month. This row shows that 45% who reported sick in the previous month sought medical treatment and were treated as outpatients. Among those who reported being sick, only 28% had any
TABLE 2 Outpatients and Health Insurance Ownership, 2007 (%)
Outpatient (1)
Owns health insurance
(2)
Outpatient with health insurance
(3)
All persons 14.2 26.5 4.7
Sumatra 13.3 26.2 4.5
Java–Bali 14.5 24.9 4.4
Nusa Tenggara 20.2 42.5 9.7
Kalimantan 12.1 28.3 4.6
Sulawesi 12.9 29.6 4.9
Maluku Papua 13.0 39.5 6.0
Not sick — 24.9 —
Any illness 44.8 27.7 13.7
Sumatra 42.7 29.5 14.3
Java–Bali 46.8 28.3 14.4
Nusa Tenggara 48.0 45.9 23.1
Kalimantan 37.9 31.7 14.5
Sulawesi 37.5 33.7 14.2
Maluku–Papua 39.0 39.8 17.9
Fever 46.4 27.4 13.6
Cough 29.3 29.8 9.8
Flu or cold 18.7 29.1 6.5
Asthma or breathing dificulties 56.0 31.8 20.0
Diarrhoea 51.3 28.0 15.1
Headache 28.1 28.7 9.6
Toothache 32.6 28.8 11.4
Other unspeciied illness 50.8 31.6 17.2
Source: Authors’ calculations based on data from the 2007 Susenas.
Note: Percentages calculated as proportions of the sets of populations in the stub column.
404 Yogi Vidyattama, Riyana Miranti, and Budy P. Resosudarmo
kind of health insurance. The rows below the ‘Any illness’ row show those who reported being sick in the previous month in each region. The last group of rows in this table shows those who reported being sick and affected by a certain type of illness. For example, approximately 46% of those who reported having a fever in the previous month received outpatient treatment.
RESULTS AND DISCUSSION Regression Quality
Table 3 shows the results from the main estimations conducted for this article, all of which used probit regression as the estimation technique. One of the most eficient unbiased regression techniques available, probit regression uses the max
-imum likelihood to cumulative distribution function of normal distribution to estimate the coeficients in the regression.
Our main concern about the results in table 3 is whether our estimation has an endogeneity bias. There are two possible sources of bias: (a) that having health insurance is due to the fact that one expects to get sick (that is, reverse causal
-ity), and (b) that we have omitted important variables determining health service utilisation that are correlated with health insurance ownership. We argue against the irst potential source of bias, for two reasons. First, the proportions of outpa
-tients are relatively smaller among those with health insurance than among those without it, as the second and third columns of table 2 show.11 The proportion of
outpatients would be much larger if there were an endogeneity bias: people take out some form of health insurance if they know that they are going to use health services. Second, the majority of those with health insurance have it by default (or mandatorily) rather than choice—that is, because they are civil servants, or poor or nearpoor. Private health insurance is the only scheme under which we suspect that those taking out a policy might do so because they expect to be sick in the future. However, the proportion of those with private health insurance is relatively small.
To counter the second possible source of bias, this article added as many deter
-minants as possible to the regressions as control variables. This strategy does not prevent unobserved heterogeneity: a panel data analysis would have been a better approach. However, the dataset used in this article does not allow such an analysis. Our models comprise many variables—including age, education, income, employment status, sector of employment, and household size—which should minimise any bias caused by omitting important determinants.12 Hence,
we argue that the results in table 3 are relatively unbiased.13
11. By subtracting the second and third columns from the ‘All persons’ row in table 2, the proportion of people who had health insurance but who did not use health services was 21.8% of the population—much larger than the 4.7% of the population who had health insurance and used health services.
12. To further reduce this issue, one needs to use a longitudinal dataset (unlike the Susenas– Riskesdas dataset).
13. To ensure the robustness of our results, we applied an alternative method—the aver -age treatment effect to those who used health services—and used a different degree of
The Role of Health Insurance Membership in Health Service Utilisation 405
Models (1a) and (1b) in table 3 show the determinants of health utilisation among those reporting having been sick in the previous month. Models (1c) and (1d) show the results of the Heckman correction procedure, which aimed to esti
-mate the determinants of health utilisation among all individuals—that is, those reporting and not reporting feeling sick in the previous month. Models (3a) and (3b), by estimating equation (3), also aim to estimate the determinants of health utilisation among all individuals.
If having health insurance has a high correlation with being sick, Heckman’s (1979) correction estimation procedure will produce relatively unbiased estima
-tion results. In this article, however, the correla-tion coeficient between health insurance ownership and being sick is only 4.9%. Furthermore, applying Heck
-man’s procedure produces less eficient estimation results than the pure probit model in models (3a) and (3b), as indicated by much lower numbers of log likeli
-hood. Hence, it seems reasonable to conclude that models (3a) and (3b) provide a more accurate estimation than models (1c) and (1d).
The Impact of Health Insurance
Table 3 presents the marginal effects calculated from the results of the probit regressions. Models (1a), (1b), (3a), and (3b) show that the impact of health insur
-ance ownership on health service utilisation is positive and statistically signii
-cant. Model (1a), for example, shows that having health insurance increases the probability of using health services by 7.5 percentage points when one feels sick. And, as model (3a) shows, the results for the whole sample suggest that having health insurance increases the probability of using health services by 4.8 percent
-age points, regardless of whether one feels sick.
Different health insurance programs, however, induce different impacts on health service utilisation, as the estimations of models (1b) and (3b) reveal. Among those who reported being sick—and for the whole population—private health insurance, health cost reimbursement by a company, and Jamsostek increase the use of health services less than other types of insurance. This is logical, since peo
-ple covered by private health insurance, company reimbursement, or Jamsostek are, in general, better off than civil servants, informalsector workers, and the poor. This result highlights the importance of providing subsidised health insur
-ance to encourage people to seek health services when they feel sick or for preven
-tive care—thus contributing to a healthier society.14
The results cannot conirm, however, whether there are likely to be concerns about the uptake of health insurance in Indonesia. In his assessment of the imple
-mentation of universal health insurance in Asian countries, Wagstaff (2014) points
matching (Rosenbaum and Rubin 1983; Heckman, Ichimura, and Todd 1997). The results of this method conirmed that the results in table 3 are relatively robust. The results of the average treatment effect are available from the authors on request.
14. In 2007, the year of this article’s dataset, the owners of health insurance for civil serv -ants, health care for the poor, and community health funds could, in most cases, use these programs only when visiting public health providers. The results of this article could be different if the insured were allowed to use these programs to seek private health services, because private health providers in Indonesia typically provide better services and have better facilities than public health providers.
TABLE 3 Marginal Effect on Health Utilisation
Probit estimation of
those who are sick Heckman selection
Probit estimation
dy/dx
(1a) dy/dx (1b) dy/dx (1c) dy/dx (1d) dy/dx (3a) dy/dx (3b)
Ownership of any health insurance 0.075*** 0.056*** 0.048***
Health insurance for civil servant (Askes), veteran, or retiree 0.099*** 0.074*** 0.031***
Financial aid reimbursement by company 0.062*** 0.046*** 0.026***
Health care for the poor (JPKMM, Health Card, JPK Gakin, or Askeskin) 0.065*** 0.049*** 0.053***
Social insurance for workers (Jamsostek) 0.066*** 0.05*** 0.031***
Private health insurance 0.04*** 0.031*** 0.023***
Health fund 0.102*** 0.077*** 0.066***
JPKM and other regional health insurance schemes 0.081*** 0.06*** 0.049***
Travel time to nearest health service provider (days) –0.013*** –0.013*** –0.010*** –0.010*** –0.005*** –0.005*** Distance to provincial capital (100 km) –0.015*** –0.015*** –0.011*** –0.012*** –0.004*** –0.004*** Region (base: Java–Bali)
Sumatra –0.049*** –0.048*** –0.036*** –0.036*** –0.004*** –0.004***
Kalimantan –0.115*** –0.114*** –0.084*** –0.086*** –0.03*** –0.029***
Sulawesi –0.100*** –0.100*** –0.073*** –0.074*** –0.007*** –0.007***
Maluku–Papua –0.076*** –0.076*** –0.055*** –0.056*** –0.010*** –0.01***
Nusa Tenggara 0.017*** 0.017*** 0.014*** 0.014*** 0.056*** 0.054***
Log likelihood –186,042 –186,030 –724,806 –724,794 –331,223 –331,133
Observations 277,921 277,921 848,585 848,585 848,585 848,585
Note: All equations include control variables for sex, age, household size, education, employment status, sector of employment, gross regional product per capita, and district health budget, and use food expenditure as a proxy for income.
* p< 0.1; ** p< 0.05; *** p< 0.01.
The Role of Health Insurance Membership in Health Service Utilisation 407
out that the the uptake of health insurance among middleincome households is often low because the beneits are perceived to be low. He conirms, however, that
this issue is less pronounced in Indonesia than in other Asian countries, such as
the Philippines and Vietnam. Before the implementation of universal health care in Indonesia, most of the enrolments in the schemes that involve middleincome groups (that is, Askes and Jamsostek) were arranged and paid for by employers or the institution that employed them. The relatively high impact of Askes and Jamsostek in our study indicates that the middleincome group in Indonesia is willing to use health insurance. The government needs to ensure, however, that the reduction in outofpocket spending is signiicant (Wagstaff 2014). However, even if the subsidy does not have a signiicant and direct impact on middle income spending, at least the payment from the insurance could be an incentive for the provider to improve its services (Perrot et al. 2010).
Other Determinants of Health Service Utilisation
The impact of predisposing factors on health service utilisation in Indonesia is arguably smaller than the enabling factor of the ownership of health insurance. The impact of age is small, and single people are less likely to use health services or seek medical treatment than those who are married, widowed, or divorced.15
One explanation could be that single people, who are mostly young, are less inclined to seek treatment when they are sick, believing that they can recover by using overthecounter medicines. In general, females are also less likely than males to seek medical treatment. Yet there is no signiicant difference between females and males in seeking medical treatment when they feel sick. This could be due to females experiencing a higher opportunity cost than males, or due to females being more careful in managing their money. In any event, females tend to seek health treatment only when they are really sick, otherwise using overthe counter medicines.
In estimating the impact of education, we use as a comparison base those who have no school education. The estimation shows that the more education a person has, the less likely they are to use health services when they are sick. A possible explanation is that most individuals in the sample who have no school education are predominantly children aged ive years or below. In Indonesian culture, parents would give such children priority in seeking medical treatment. Other explanations could be that the opportunity cost of using health services rises in proportion to the education level or that those with little education are more conident that they can treat their illness themselves with overthecounter medicines. These results are in line with the negative impacts of all employment statuses (with not working as a comparison base). This may indicate that there is a high opportunity cost of not going to work because of illness and using health services for consultation.
Household income, which is proxied by food expenditure, is signiicant in determining health service utilisation. The richer the person, the more he or she uses health services when sick. This indicates that there could still be budget con
-straints to health service utilisation—even among the poor, who receive free health
15. Among those who reported being sick, there was not much difference in health service utilisation between single and divorced people.
408 Yogi Vidyattama, Riyana Miranti, and Budy P. Resosudarmo
services but still have to cover the travel costs of reaching health facilities. That this could be a problem is borne out by table 3, which shows that the farther a person is from a health centre, the less likely he or she is to use the health centre when sick. The quality of health services also seems to matter. The farther a person is from a provincial capital (that is, if a person has to go to a local health centre, which most likely provides a lower quality of service than those in the provincial capital), the less likely they are to use health services when sick. Those living outside Java–Bali, except those in Nusa Tenggara, are also less likely to use health services—probably because the availability and quality of health services are better in Java–Bali than elsewhere in Indonesia, or because information about the importance of seeking accredited medical treatment is more readily available in Java–Bali. It is puzzling, however, that those living in Nusa Tenggara tend to use health services more often than those in Java–Bali when they are sick. Perhaps the types of illnesses suffered by those in Nusa Tenggara in 2007 required more frequent professional medical treatment than those elsewhere (Pakasi et al. 2009, Soenarto et al. 2009).
Users of Health Insurance
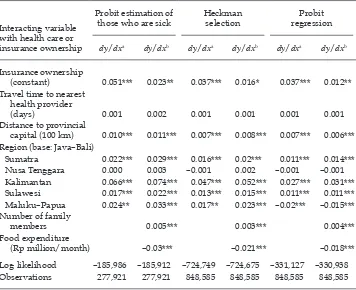
In seeking to understand who uses health insurance in Indonesia, we add inter
-action variables between having health insurance and different individual and location characteristics and then observe the coeficients of the variables. Table 4 shows the marginal effects of the interaction variables. Except for health insur
-ance, the marginal effects of the original variables are hardly affected by including these additional variables.
We focus here on understanding the situation in regions where people generally use health services when they are sick and have health insurance. The absence of the Java–Bali dummy variable indicates that Java–Bali is the based variable in this equation. This means that the marginal effects of different regions have to be seen relative to the condition in Java–Bali (for example, the 0.02 in Sulawesi means that the impact of health insurance in Kalimantan is two percentage points higher than the impact in Java–Bali). The result indicates that having health insurance in Sumatra, Kalimantan, and Sulawesi tends to encourage the owners to use health services more frequently than in Java–Bali—that is, health insurance companies and schemes tend to ‘better help’ people on those islands to access health ser
-vices than they do people in Java–Bali. This is not the case in Nusa Tenggara; the effectiveness of health insurance in increasing health in those regions is not better than in Java–Bali. In Maluku–Papua, people who have health insurance tend to use health services more when they feel sick than do those in Java–Bali. Yet this is not the case when we include those who do not feel sick; having health insurance does not encourage people in Maluku–Papua to seek preventive care.
Table 4 shows an insigniicant positive coeficient of interaction between hav
-ing health insurance and the time needed to reach the nearest health centre. It means that having health insurance encourages the use of health services the far
-ther the person is from a health centre, but the effect is small. Having health insur
-ance does help those whose travel costs are high to come to a health centre when they are sick. A positive and signiicant coeficient for distance to the provincial capital and health insurance could mean that having health insurance encourages people far from the provincial capital to use a local health centre, even though the services are not as good as those in the provincial capital.
The Role of Health Insurance Membership in Health Service Utilisation 409
On education, table 4 shows that the higher the level of education a person has when sick, the more that having health insurance encourages them to use health services. On household income, table 4 reveals that having health insur
-ance encourages people with low incomes to use health services. Hence, health insurance does relax the budget constraints of individuals.
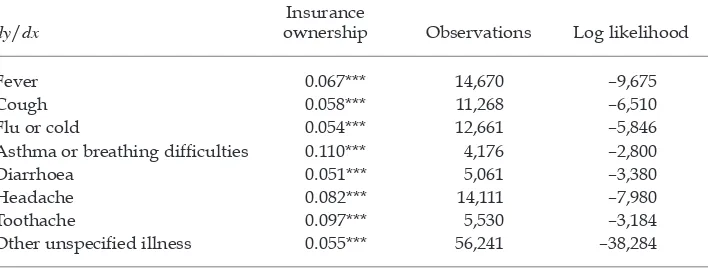
Kinds of Illness
To understand the kinds of illnesses that encourage people to use health services when they have health insurance, we estimate model (1a) for those reporting simi
-lar illnesses (table 5). The highest impact of having health insurance on health ser
-vice utilisation is from asthma attacks or breathing dificulties, while the lowest impact is from diarrhoea. This is understandable, since Indonesians tend to treat asthma attacks and breathing dificulties as more serious illnesses than diarrhoea.
TABLE 4 Partial Marginal Effect of Variables Interacting with Health Insurance Ownership
Interacting variable with health care or insurance ownership
Probit estimation of
those who are sick Heckman selection
Probit regression
dy/dxa dy/dxb dy/dxa dy/dxb dy/dxa dy/dxb
Insurance ownership
(constant) 0.051*** 0.023** 0.037*** 0.016* 0.037*** 0.012**
Travel time to nearest health provider
(days) 0.001 0.002 0.001 0.001 0.001 0.001
Distance to provincial
capital (100 km) 0.010*** 0.011*** 0.007*** 0.008*** 0.007*** 0.006*** Region (base: Java–Bali)
Sumatra 0.022*** 0.029*** 0.016*** 0.02*** 0.011*** 0.014***
Nusa Tenggara 0.000 0.003 –0.001 0.002 –0.001 –0.001
Kalimantan 0.066*** 0.074*** 0.047*** 0.052*** 0.027*** 0.031***
Sulawesi 0.017*** 0.022*** 0.013*** 0.015*** 0.011*** 0.011*** Maluku–Papua 0.024** 0.033*** 0.017** 0.023*** –0.02*** –0.015*** Number of family
members 0.005*** 0.003*** 0.004***
Food expenditure
(Rp million/month) –0.03*** –0.021*** –0.018***
Log likelihood –185,986 –185,912 –724,749 –724,675 –331,127 –330,938
Observations 277,921 277,921 848,585 848,585 848,585 848,585
aEquations include control variables for sex, age, household size, education, employment status, sec
-tor of employment, gross regional product per capita, and district health budget, and use food expend
-iture as a proxy for income (but not the interacting variables).
bEquations include both control variables and interacting variables for sex, age, household size,
education, employment status, sector of employment, gross regional product per capita, and district health budget, and use food expenditure as a proxy for income.
* p < 0.1; ** p < 0.05; *** p < 0.01.
410 Yogi Vidyattama, Riyana Miranti, and Budy P. Resosudarmo
CONCLUSION
The main result of this article is that having health insurance increases the prob
-ability of people using health services by approximately eight percentage points when they feel sick or by approximately ive percentage points if we include those who do not feel sick. A loose interpretation of this result is as follows. In 2007, 27% of Indonesia’s population had health insurance. Providing the other 73% of the population with health insurance means that an additional 4% of the population will use health services—that is, that the number of people who had been out
-patients in the previous month will increase from 14% of the population to 18%, or that the number of people who were outpatients in the previous month will increase by 29%.
We estimate that private health insurance, health cost reimbursement by a company, and Jamsostek have a lower impact on increasing the use of health ser
-vices than other health insurance schemes. The poor are less likely than other groups to have one of these three types of health insurance. If they have health insurance, the poor mostly have one of the other types of health insurance—the impacts of which are higher. This result indicates that the poor beneit most from the provision of health insurance. In addition, the lower the household income, as proxied by household food expenditure, the greater the impact of having health insurance on health service utilisation.
Having health insurance does encourage the use of health services by those who live far from health facilities, especially those who live far from the provin
-cial capital and do not have health facilities nearby that are as good as those in the provincial capital. Although some budget constraints remain, having health
insurance does help to relax household budget constraints: people with health
insurance tend to seek professional medical treatment when a member of the household is sick. Hence, if the goal of providing health insurance is to encourage sick people to seek professional medical treatment—to be an enabling factor, as discussed in the literature review—this goal is likely to be achieved.
TABLE 5 Marginal Effects on Health Utilisation for Each Case of Illness
dy/dx
Insurance
ownership Observations Log likelihood
Fever 0.067*** 14,670 –9,675
Cough 0.058*** 11,268 –6,510
Flu or cold 0.054*** 12,661 –5,846
Asthma or breathing dificulties 0.110*** 4,176 –2,800
Diarrhoea 0.051*** 5,061 –3,380
Headache 0.082*** 14,111 –7,980
Toothache 0.097*** 5,530 –3,184
Other unspeciied illness 0.055*** 56,241 –38,284
Note: All equations include control variables for sex, age, household size, education, employment sta
-tus, sector of employment, gross regional product per capita, and district health budget, and use food expenditure as the proxy for income.
* p < 0.1; ** p < 0.05; *** p < 0.01.
The Role of Health Insurance Membership in Health Service Utilisation 411
The question remains whether increasing the probability of using health ser
-vices by ive to eight percentage points is good enough, considering the large cost to the government of providing health insurance— particularly subsidised
insurance. This question is not within the scope of this article, and further studies
are needed. This article does, however, indicate the importance of other factors in encouraging the use of health services; its policy implications include the need to have more health centres, particularly in remote areas, and to provide better quality health services. To encourage higher utilisation of health services and to promote the health of the population, the government needs programs that relax household budget constraints and improve the supply side of health services.
Indonesia’s health care system has been relatively well developed to overcome challenges of increasing demand for health service utilisation (such as during the 1997–98 Asian inancial crisis). Nevertheless, stronger commitment—not only from the central government but also from local governments—is required to respond to the dificulties of providing health services for everyone. This commit
-ment may involve developing incentives for the private sector to provide more health services, particularly in remote areas. Balancing priorities among those programs is only one of the challenges faced by the Indonesian government in encouraging greater health service utilisation; the government might beneit from improving its programs incrementally and implementing strong monitoring and evaluation processes.
REFERENCES
Aji, Budi, Manuela De Allegri, Aurelia Souares, and Rainer Sauerborn. 2013. ‘The Impact of Health Insurance Programs on OutofPocket Expenditures in Indonesia: An Increase or a Decrease?’. International Journal of Environmental Research and Public Health 10 (7): 2995–3013.
Andersen, Ronald M. 1968. ‘A Behavioral Model of Families’ Use of Health Services’. Research Series 25, Center for Health Administration Studies, University of Chicago. Babitsch, Birgit, Daniela Gohl, and Thomas von Lengerke. 2012. ‘Rerevisiting Andersen’s
Behavioral Model of Health Services Use: A Systematic Review of Studies from 1998– 2011’. GMS Psycho-Social-Medicine 9: Doc11.
Brodsky, Jenny, Jack Habib, and Miriam Hirschfeld (eds). 2003. Long-Term Care in Develop-ing Countries: Ten Case-Studies. Geneva: World Health Organization.
Ekman, Björn. 2004. ‘CommunityBased Health Insurance in LowIncome Countries: A Systematic Review of the Evidence. Health Policy and Planning 19 (5): 249–70.
Ekman, Björn, Nguyen Thanh Liem, Ha Anh Duc, and Henrik Axelson. 2008. ‘Health Insur -ance Reform in Vietnam: A Review of Recent Developments and Future Challenges’.
Health Policy and Planning 23 (4): 252–63.
Ensor, Tim, and Stephanie Cooper. 2004. ‘Overcoming Barriers to Health Service Access: Inluencing the Demand Side’. Health Policy and Planning 19 (2): 69–79.
Erlyana Erlyana, Kannika Kampanya Damrongplasit, and Glenn Melnick. 2011. Expanding Health Insurance to Increase Health Care Utilisation: Will It Have Different Effects in Rural vs Urban Areas?’. Health Policy 100: 273–81.
Harimurti, Pandu, Eko Pambudi, Anna Pigazzini, and Ajay Tandon. 2013. The Nuts and Bolts of Jamkesmas: Indonesia’s Government-Financed Health Coverage Program for the Poor and Near-Poor. UNICO Studies Series 8. Washington, DC: World Bank.
Heckman, James J. 1979. ‘Sample Selection Bias as a Speciication Error’. Econometrica 47 (1): 153–61.
412 Yogi Vidyattama, Riyana Miranti, and Budy P. Resosudarmo
Heckman, James J., Hidehiko Ichimura, and Petra E. Todd. 1997. ‘Matching as an Econo -metric Evaluation Estimator: Evidence from Evaluating a Job Training Programme’. The Review of Economic Studies 64 (4): 605–54.
Hidayat, Budi, and Subhash Pokhrel. 2009. ‘The Selection of an Appropriate Count Data Model for Modelling Health Insurance and Health Care Demand: Case of Indonesia’.
International Journal of Environmental Research and Public Health 7 (1): 9–27.
Hidayat, Budi, Hasbullah Thabrany, Hengjin Dong, and Rainer Sauerborn. 2004. ‘The Effects of Mandatory Health Insurance on Equity in Access to Outpatient Care in Indo -nesia’. Health Policy and Planning 19 (5): 322–35.
Hotchkiss, David R., and Samsi Jacobalis. 1999. ‘Indonesian Heath Care and the Economic Crisis: Is Managed Care the Needed Reform?’. Health Policy 46 (3): 195–216.
Johar, Meliyanni. 2009. ‘The Impact of the Indonesian Health Card Program: A Matching Estimator Approach’. Journal of Health Economics 28 (1): 35–53.
———. 2010. ‘The Effect of a Public Health Card Program on the Supply of Health Care’.
Social Science & Medicine 70 (10): 1527–35.
Jütting, J. P. 2003. Do CommunityBased Health Insurance Schemes Improve Poor People’s Access to Health Care? Evidence from Rural Senegal’. World Development 32 (2): 273–88.
Kristiansen, Stein, and Purwo Santoso. 2006. Surviving Decentralisation? Impacts of Regional Autonomy on Health Service Provision in Indonesia’. Health Policy 77 (3): 247–59.
LópezCevallos, Daniel F., and Chunhuei Chi. 2010. ‘Health Care Utilization in Ecuador: A Multilevel Analysis of Socioeconomic Determinants and Inequality Issues’. Health Policy and Planning 25 (3): 209–18.
McIntyre Diane. 2007. Learning from Experience: Health Care Financing in Low- and Middle-Income Countries. Geneva: Global Forum for Health Research.
Ministry of Health. 2008. Riset kesehatan dasar (RISKESDAS) 2007: Laporan nasional 2007
[The national report of the 2007 Riskesdas]. Jakarta: Ministry of Health.
———. 2013. Proil kesehatan Indonesia 2012 [Indonesia health proile 2012]. Jakarta: Minis -try of Health.
Nugroho, G., and Katherine Elliott. 1977. ‘The Dana Sehat Programme in Solo, Indonesia’.
Proceedings of the Royal Society of London B. Biological Sciences 199 (1134): 145–50.
OECD and World Health Organization. 2012. Health at a Glance: Asia/Paciic 2012. Paris: OECD Publishing. doi:10.1787/9789264183902en.
Pakasi, T. A., E. Karyadi, Y. Wibowo, Y. Simanjuntak, N. M. D. Suratih, M. Salean, N. Dar -mawidjaja, J. W. M. van der Meer, K. van der Velden, and W. M. V. Dolmans. 2009. ‘Vitamin A Deiciency and Other Factors Associated with Severe Tuberculosis in Timor and Rote Islands, East Nusa Tenggara Province, Indonesia’. European Journal of Clinical Nutrition 63 (9): 1130–35.
Perrot, Jean, Eric de Roodenbeke, Laurent Musango, and György Fritsche. 2010. ‘Perfor -mance Incentives for Health Care Providers’. Discussion Paper 12010, World Health Organization, Geneva.
Pradhan, Menno, Fadia Saadah, and Robert Sparrow. 2007. ‘Did the Health Card Program Ensure Access to Medical Care for the Poor during Indonesia’s Economic Crisis?’. The World Bank Economic Review 21 (1): 125–50.
Rokx, Claudia, George Schieber, Pandu Harimurti, Ajay Tandon, and Aparnaa Somana -than. 2009. Health Financing in Indonesia: A Reform Road Map. Washington, DC: World
Bank.
Rosenbaum, Paul R., and Donald B. Rubin. 1983. ‘The Central Role of the Propensity Score in Observational Studies for Causal Effects’. Biometrika 70 (1): 41–55.
ScheilAdlung, Xenia. 2004. ‘Sharpening the Focus on the Poor: Policy Options for Advanc -ing Social Health Protection in Indonesia’. Extension of Social Security Paper 19, Inter -national Labour Organization, Geneva.
The Role of Health Insurance Membership in Health Service Utilisation 413
Simmonds, Amanda, and Krishna Hort. 2013. ‘Institutional Analysis of Indonesia’s Pro -posed Road Map to Universal Health Coverage’. Health Policy and Health Finance Knowledge Hub Working Paper 33, The Nassal Institute for Global Health, University of Melbourne.
Soedjono, Imam. 1956. Dana sakit dan djaminan sosial untuk buruh [Health insurance and
social security for workers]. Bandung: Masa Baru.
Soenarto, Yati, Abu. T. Aman, Achirul Bakri, Herman Waluya, Agus Firmansyah, Muzal Kadim, Iesje Martiza, Dwi Prasetyo, Nenny S. Mulyani, Titis Widowati, Soetjiningsih, I. Putu Gede Karyana, Wayan Sukardi, Joseph Bresee, and MarcAlain Widdowson. 2009. ‘Burden of Severe Rotavirus Diarrhea in Indonesia’. Journal of Infectious Diseases
200 (Supplement 1): S188–94.
Soors, Werner, Narayanan Devadasan, Varatharajan Durairaj, and Bart Criel. 2010. Com -munity Health Insurance and Universal Coverage: Multiple Paths, Many Rivers to Cross’. World Health Report, Background Paper 48, World Health Organization, Geneva.
Sparrow, Robert. 2011. ‘Social Health Insurance: Towards Universal Coverage for the Poor’. In Employment, Living Standards and Poverty in Contemporary Indonesia, edited by
Chris Manning and Sudarno Sumarto, 221–44. Singapore: Institute of Southeast Asian Studies.
Sparrow, Robert, Asep Suryahadi, and Wenefrida Widyanti. 2013. ‘Social Health Insurance for the Poor: Targeting and Impact of Indonesia’s Askeskin Programme’. Social Science & Medicine 96 (November): 264–71.
Suryahadi, Asep, Yusuf Suharso, and Sudarno Sumarto. 2001. ‘Coverage and Targetting in the Indonesian Social Safety Net Programmes’. ASEAN Economic Bulletin 18 (2): 161–75.
Thabrany, Hasbullah, Ascobat Gani, Pujianto, Laura Mayanda, Mahlil, and Bagus Satria Budi. 2003. ‘Social Health Insurance in Indonesia: Current Status and the Proposed National Health Insurance’. Paper presented at the World Health Organization SEARO Social Health Insurance Workshop, New Delhi, 13–15 March.
Vidyattama, Yogi. 2013. ‘Regional Convergence and the Role of the Neighborhood Effect in Decentralised Indonesia’. Bulletin of Indonesian Economic Studies 49 (2): 193–211.
Wagstaff, Adam. 2007. ‘Health Insurance for the Poor: Initial Impacts of Vietnam’s Health Care Fund for the Poor’. World Bank Policy Research Working Paper 4134, World Bank, Washington, DC.
———. 2014. ‘We Just Learned a Whole Lot More about Achieving Universal Health Cover -age’. Let’s Talk Development, 25 August. http://blogs.worldbank.org/developmenttalk/
wejustlearnedwholelotmoreaboutachievinguniversalhealthcoverage.
Wagstaff, Adam, Magnus Lindelow, Gao Jun, Xu Ling, and Qian Juncheng. 2009. ‘Extend -ing Health Insurance to the Rural Population: An Impact Evaluation of China’s New Cooperative Medical Scheme’. Journal of Health Economics 28 (1): 1–19.
Wagstaff, Adam, and Menno Pradhan. 2005. ‘Health Insurance Impacts on Health and Nonmedical Consumption in a Developing Country’. World Bank Policy Research Working Paper 3563, World Bank, Washington, DC.
Waters, Hugh R. 1999. ‘Measuring the Impact of Health Insurance with a Correction for Selection Bias—a Case Study of Ecuador’. Health Economics 8 (5): 473–83.
World Bank. 2011. ‘Does Jamkesmas Protect the Population from Health Expenditure Shocks?’. Indonesia Health Sector Review: Policy and Discussion Notes. Washington, DC: World Bank.
———. 2012. ‘Indonesia Health Sector Review: Overview; Data, Graphs and Tables’.
http://www.worldbank.org/content/dam/Worldbank/document/EAP/Indonesia/ HSROverview.pdf.
———. 2013. World Development Indicators 2013. Washington, DC: World Bank.