NETWORK SNAKES FOR ADAPTING GIS ROADS TO HEIGHT DATA OF DIFFERENT
DATA SOURCES – PERFORMANCE ANALYSIS USING ALS DATA AND STEREO
IMAGES
J. Göpfert, F. Rottensteiner, C. Heipke
Institute of Photogrammetry and GeoInformation, Leibniz Universität Hanover, Germany -
(goepfert, rottensteiner, heipke)@ipi.uni-hannover.de
Commission III, WG III/4
Keywords: registration, 2D vector data, height information, ALS data, stereo images
ABSTRACT:
In order to tackle the problem of consistently integrating 2D vector data and a DTM, we presented an approach for the adaptation of 2D GIS road objects to airborne laser scanning (ALS) data using active contours (snakes) in (Göpfert et al., 2011). In this paper the algorithm is modified for the integration of stereo images as an alternative data source for area-wide height information. For that reason, a new image energy is developed that exploits geometric and radiometric features derived from the image data. Afterwards, we compare the applicability of our method with respect to the ALS data and stereo images as input. In addition, a new approach is suggested that analyses the different energy terms of active contours after the optimisation process in order to automatically detect contour parts that did not reach a suitable position in the sensor data. This concept of an internal evaluation is able to guide the user during post processing. Experiments show that the snake approach with an image energy based on stereo images is generally able to adapt GIS road centrelines to the sensor data and thus to improve the quality of the 2D vector data. However, the comparison to the results for ALS data demonstrates that the algorithm perform slightly worse for image data in the high precision level.
1. INTRODUCTION 1.1 Motivation
Topographic information systems such as the German Authoritative Topographic Cartographic Information System (ATKIS®), usually consist of object-based 2D vector data and a digital terrain model (DTM). The vector data describe the objects on the Earth’s surface and additional attributes, whereas the DTM is a continuous 2.5D representation of the terrain. For applications such as flood risk assessment, 3D modelling of the topographic objects is necessary, which requires the integration of the 2D vector data and the DTM. However, there are discrepancies between the vector data and the DTM due to different methods of acquisition, processing, and modelling. As a consequence, integration without matching the data sets leads to semantically incorrect results, e.g. road surfaces having large gradients in the DTM. Thus, the two data sets have to be adapted for accurate combined visualization and processing.
In (Göpfert et al., 2011), road centrelines from topographic data bases (as linear features) were adapted to airborne laser scanning (ALS) data by means of network snakes (Butenuth & Heipke, 2012). The road centrelines were used to initialise the snakes, defining their topology and their internal energy, whereas features in the ALS data exert external forces to the snake via the image energy. ALS delivers a 3D point cloud, from which the digital surface model (DSM) is interpolated. A DTM can be generated by filtering methods. The DSM also contains information about objects situated on the terrain, such as buildings and bridges. In addition, ALS intensity data contain reflectance information of the illuminated objects. We have shown that suitable image energies for the adaptation of road centrelines can be composed using these ALS features (Göpfert et al., 2011). However, ALS flights are expensive and thus many providers of topographic data acquire nation-wide height information by means of stereo images, which are often
gathered in periodic flights for the purpose of map updating. To make use of these data in our framework, a new formulation of the image energy is proposed for the adaptation process. It is exclusively based on geometric and radiometric information from stereo images, whereas the general geometric object model of the snakes is not changed. The quality of the adaptation results is compared for the two different sensor data, i.e. ALS data and stereo images.
One major disadvantage of our previous adaptation approach and of active contour models in general results from the lack of a suitable internal evaluation. Thus, in this paper a strategy for the interpretation of the different energy terms of the snake nodes is suggested in order to detect contour parts that did not reach a suitable position in the sensor data.
It is the general goal of this paper to present a new algorithm for improving 2D road vector data using stereo images. The approach is tested using road centrelines from different GIS data bases, namely ATKIS and OpenStreetMap (OSM). ATKIS roads typically have an accuracy of 3-5 m, with local deviations that may reach 10 m. Roads from OSM have a very inhomogeneous accuracy due to the patchwork characteristic of this data set, which may disturb the local geometry of the road network and makes the adaptation process more challenging.
1.2 Related Work
Pilouk (1996) as well as Lenk and Heipke (2006) investigated the incorporation of the 2D geometry of the vector objects into a DTM modelled by a TIN, but the inconsistencies between the vector data and the DTM were not considered. Rousseaux and Bonin (2003) model 2D linear objects such as roads and dikes as 2.5D surfaces by using attributes of the GIS data base and the DTM heights with the goal of generating an improved DTM. They use slopes and regularization constraints to check the semantic correctness of the objects, but they do not adapt the ISPRS Annals of the Photogrammetry, Remote Sensing and Spatial Information Sciences, Volume I-3, 2012
objects if this check fails. Koch and Heipke (2006) extend the integration methods based on TIN structures by a least squares adjustment using equality and inequality constraints in order to incorporate the semantics of the objects. However, the approach is rather sensitive to the definition of the weights. Furthermore, the implicit information about the vector objects in the height data such as structure lines at road embankments is not considered. We tackle these deficits by using image energies for active contours based on stereo images in order to correct the positions of the objects considering their height information.
Snakes or parametric active contours are a well-known concept for combining feature extraction and geometric object representation (Kass et al., 1988; Blake & Isard, 1998). Snakes explicitly represent a curve parameterized by its arc length. The concept is widely used in image and point cloud analysis as well as GIS applications. For example, Burghardt and Meier (1997) suggest an active contour algorithm for feature displacement in automated map generalisation, and Cohen and Cohen (1993) introduce a finite elements method for 3D deformable surface models. Borkowski (2004) shows the capabilities of snakes for break line detection in the context of surface modelling. Laptev et al. (2001) extract roads using a combined scale space and snake strategy. In the standard formulation, snakes cannot handle changes in the topology such as splitting and merging of entities (McInerny & Terzopoulos, 1995). This is not a problem for the adaptation of the 2D vector data to height information, because the initial topology is taken from the GIS data base and should be kept fixed during the process.
In order to extract roads from height data, Rieger et al. (1999) propose twin snakes to model roads as parallel edges. This integration of model knowledge stabilises the extraction and is able to bridge gaps in the structure lines in the vicinity of roads, which are often not continuous in nature. Road extraction can also be improved by fusing height and image data (Zhu et al., 2004) as well as GIS data (Oude Elberink & Vosselman, 2006).
In our previous work we used network snakes, which preserve and exploit topology (Butenuth & Heipke, 2012), for adapting 2D road vector data to ALS intensity and height data (Göpfert et al., 2011). The image energies consisted of a combination of the ALS intensity, DTM features, such as terrain roughness and slope, and information about extracted bridges and buildings. However, due to the high cost of ALS flights many providers of topographic data derive their area-wide height information from stereo images. Therefore, it is one goal of this paper to design a new image energy that integrates not only the height information but also radiometric features provided by aerial stereo images. Furthermore, the quality of the image energy derived from ALS data and stereo imagery is compared with respect to the adaptation task.
Förstner (1996) emphasised that empirical testing is not enough for performance characterisation of a computer vision algorithm; it should be assisted by an evaluation based on the theory underlying the algorithm. However, existing approaches of parametric active contours usually do not provide such an
internal evaluation, which could be used to detect snake parts where the optimisation does not converge to a satisfactory solution. Kerschner (2003) analysed the change of the width of the twin snake model for that purpose. However, a strategy for the general snake model is not available. Thus, the second goal of this paper is to present an automatic self-diagnosis of the optimisation results by analysing the different energy terms of the snake nodes. This concept should be able to detect contour parts that did not reach a suitable position in the sensor data and to guide the user during post processing.
2. METHOD 2.1 General work flow
We propose a top-down method using the concept of network snakes for adapting road networks from a topographic data base to stereo images. The initialization of the snake and therefore the internal energy are obtained from the vector data, whereas stereo images define the new image energy forcing the snake to salient features (Section 2.3). Compared to our previous work (Göpfert et al., 2011), where ALS features are exploited to design the image energy, here we use geometric and radiometric features derived from colour infrared (CIR) stereo images. Image matching algorithms are used to derive a DSM, from which the DTM is generated by filtering methods. Buildings are extracted in the DSM and integrated into the image energy as context objects to act as repulsion forces for road parts. After defining and weighting the different terms of internal and image energies the iterative optimisation process is started, modifying the position of the network snake. The change of the position of the contour in the current iteration is used to determine the convergence of the algorithm. Afterwards, the new position of the contour should match the corresponding features for the road network in the image data. In order to detect contour parts that did not reach a suitable position in the sensor data, a strategy for an internal evaluation based on the analysis of the different energy terms of the snake is suggested (Section 2.4).
2.2 Snakes and network snakes
In this section a short introduction about snakes and some extensions used in our method is given; cf. (Göpfert et al., 2011) for details. It is the general idea of snakes to determine the position of the contour in an image in an iterative energy optimisation process. An initialisation of the contour is required. Three energy terms are introduced by Kass et al. (1988). The internal energy Eint defines the elasticity and rigidity of the curve or more generally the geometric object model. The image energy Eimage represents the features of the object of interest in order to attract the contour to the desired position. Additional terms (constraint energy Econ not used in our approach) can be integrated in the energy functional, forcing the contour to model predefined external constraints:
(1)
In (1), v(s) = (x(s), y(s))is the parametric curve with arc length
s. In order to obtain the optimal position of the snake in the image, the energy functional in Eq. 1 has to be minimised, e.g. by variational calculus. The original model of the internal energy (Kass et al., 1988) favours a smooth and straight shape of the snakes, but this model is not well-suited for roads that are not straight. Therefore, we prefer another approach, firstly introduced by Radeva et al. (1995). Rather than the deviations from a smooth and straight shape, the new internal energy penalises the differences between the current and the initial shape of the snakes:
0.5 · · | | | | · | | | |
(2)
In (2) , and , are the derivatives of contour v and its initialisation v0 with respect to s, and α andβ are weights. The first order term, weighted by α, is responsible for the elasticity of the curve. High values of α preserve the initial node distances, whereas a small weight α allows for stretching and contraction. The second order term, weighted by β, controls the curvature of the snake. High values of β preserve the initial curvature in the corresponding nodes, while contour parts with a ISPRS Annals of the Photogrammetry, Remote Sensing and Spatial Information Sciences, Volume I-3, 2012
Plane NDVI
gen
a
E
b
E
E
=
⋅
+
⋅
small β are able to change their curvature during the optimisation process. The use of the initial geometry of the contour as geometric object model supports the adaptation process. The concept of network snakes additionally allows exploiting the initial topology of a network of contours during energy minimisation. The individual contours of the network are connected via nodes of an order higher than two at the junctions. The internal energy is modified so that the initial topology is preserved in the resulting line network. This means that at junctions, the elasticity term in (2) is disregarded (α = 0), while there is a smoothness term (weighted by β) per line intersecting at the junction node (Butenuth & Heipke, 2012).
2.3 Image energy
The image energy has to be defined in a way to ensure that the snake is attracted to image features that are characteristic for the object to be extracted. Thus, model knowledge is also incorporated into the image energy. The design of the image energy is very similar to our previous approach (Göpfert et al., 2011). There are two main differences due to the replacement of the ALS data by stereo images as primary sensor data: the DSM and all derived products (DTM, extracted buildings and bridges) are based on 3D point clouds generated by matching, and the ALS intensity is substituted by the Normalised Differenced Vegetation Index (NDVI) derived from the CIR images. The image energy Eimage consists of three components, namely a general image energy Egen, a building term Ebuild that repulses the snakes from buildings, and a bridge term Ebridge attracting the snake to bridges detected in the height data:
Eimage = κI • [λ(x,y) • Egen + μ(x,y) • Ebuild + ν(x,y) • Ebridge] (3)
In (3), κI is a weight for the entire image energy term, and
λ(x,y), μ(x,y), and ν(x,y) are weight functions for the individual terms that may vary across the image. More specifically, our method requires the detection of buildings and bridges. Let
Build(x,y) be a binary image that takes a value of 1 to indicate the presence of a building and 0 otherwise. Analogously, let
Bridge(x,y) be a binary image indicating the presence of a bridge. Then we define
λ(x,y) = λ0• [1 - Build(x,y)] • [1 - Bridge(x,y)]
μ(x,y) = μ0• Build(x,y) (4)
ν(x,y) = ν0• Bridge(x,y)
with λ0 = μ0 = ν0 = 1 = const. In other words, in regions classified as a building, only Ebuild is taken into account, in regions classified as a bridge only Ebridge is considered, and in all other areas only Egen is used. In the subsequent sections, we will briefly describe the calculation of the image energy starting with the pre-processing of the sensor data.
2.3.1 Pre-processing: The image energy Eimage requires an image with radiometric information, a DTM, and extracted buildings and bridges as context objects. All the information required can be generated from stereo images in several pre-processing steps. In the first step, 3D points corresponding to the DSM are generated by image matching. For DTM generation, the 3D points have to be classified as terrain or off-terrain points. We use a simple method that is based on the classification of connected segments of points having a low local surface roughness as terrain segments (Niemeyer et al., 2010). This method has the advantage that it classifies points on bridges as ground points, which is necessary to detect bridges and to avoid large repulsive forces of the image energy at the end points of bridges to the road centre lines. The DTM is interpolated from the terrain points by kriging (Cressie, 1990).
Buildings are detected in the ALS data using the method of Rottensteiner et al. (2007). For the definition of the image energy, we only need a binary building mask. Bridge detection is carried out using the method described in (Göpfert et al., 2011). The approach requires a DTM including bridges and the approximate positions of bridges. The latter information is assumed to be contained in the GIS database, be it explicitly, e.g., in the form of bridge objects, or implicitly, e.g. by the fact that a road segment intersects a river in 2D. The approach is able to determine the centre position, direction, width and length of the bridge. This information is exploited to design an image energy term for snake nodes on and under the bridge.
2.3.2 General image energy: The general image energy Egen is composed of the weighted sum of the NDVI and plane parameters in the DTM:
(5)
In (5), ENDVI is an energy term derived from the NDVI, EPlane is an energy term related to the DTM slopes, and a, b are weights.
ENDVI exploits the reflectance properties of the visible objects. Road surfaces such as asphalt generally have a low NDVI, and consequently, the snake should be forced to move to areas with small NDVI values. High NDVI values usually highlight active vegetation. Thus, trees hanging across the roads may disturb this part of the image energy. Furthermore, some other objects such as building roofs show properties similar to roads and thus influence the optimization process related to ENDVI. The term
EPlane in (5) exploits the fact that roads are usually situated on smooth and flat surfaces. Therefore, a plane is estimated in a 5 m x 5 m window for every grid point in the DTM, assuming a constant value of the minimal road width for the whole scene. The term EPlane is defined as the sum of the absolute values of the plane slope in x- and y-direction. EPlane thus highlights strong slopes in every direction in the image energy. This energy part should prevent the snakes representing the roads from moving to areas which have invalid height gradients. The weights (a, b) of the energy terms in (3) are determined empirically, supported by the histograms of the images.
2.3.2 Building Energy: The second energy term in (3), Ebuild, is related to buildings. Due to different roof orientations and materials, the appearance of buildings in stereo images varies considerably, which results in many undesired edges and local minima in the energy term derived from the NDVI. In addition, buildings cause strong edges in the DSM, and even in the DTM some artefacts remain, disturbing a suitable energy definition for the adaptation of roads. On the other hand, buildings have strong relations to the adjacent road segments: they can be treated as forbidden areas and thus act as a repulsion force. We generate this repulsion force by a distance transform using the outlines of the buildings detected in the pre-processing stage. That is, Ebuild is zero outside the building area described by
Build(x,y), whereas in the interior of a building it is identical to the distance to the nearest non-building pixel. The skeletons of the building areas act as decision boundaries. If the initialisation of the snake is on the correct side of the building skeletons, it will slide to the correct urban “valley”.
2.3.3 Bridge energy: Bridges indicate the course of a road with high confidence. Thus, the information about bridges should guide the evolution of the snake in the corresponding areas. The bridge position and direction detected in the pre-processing stage are exploited in order to design Ebridge. For the central snake node on and under the bridge a distance transform centred in the estimated bridge position is used to determine Ebridge, i.e.
Ebridge increases with the distance from the detected centre of the
bridge. This distance transform considers the uncertainty of the bridge detection and creates smooth image energies which are consistent with the other parts of Eimage. For the other nodes on the bridge, Ebridge is shifted along the bridge direction taking into account the node distance.
2.4 Internal evaluation
In general high values of the image energy indicate inappropriate image features and probably a wrong position of the contour if the image energy is suitably designed for the desired object class. Thus, a large image energy is a valuable cue for the detection of errors. A comparison of the image energies of a particular snake node with Eimage of all nodes of the contour reliably indicates outliers. Thus, assuming a normal distribution of the image energy values of all nodes the parameters of this distribution are calculated. The first detector of outliers, d1 (green circles in Fig. 1 right), uses a simple threshold determined from the mean and the standard deviation of this distribution:
: 2 ·
(6)
Generally, a high internal energy Eint (2) after the optimisation process indicates strong changes of the prior shape of the contour, i.e. the geometric object model does not fit well to the final shape of the corresponding contour part. There are two possible reasons for this situation: Either the incorrect initial shape was improved during the optimisation process based on
Eimage or the new shape is incorrect (wrong contour part).
In the first situation, Eimage should be low (correct position in
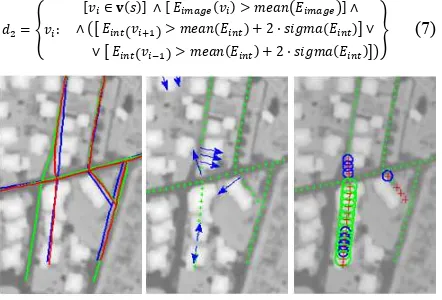
Eimage). As we want to detect the second case, the second detector d2 (blue circles in Fig. 1 right) has to consider high values for Eint as well as for Eimage. Furthermore, the data analysis shows that the gradients of the internal energy (equal to the gradients of the image energy) will often be high if the contour leaves the object outlines. Therefore, the absolute values of the image energy should be low at one side of the corresponding nodes and high at the other side. Thus, d2 searches for nodes with high Eimage and among their two neighbouring nodes for high Eint. The two thresholds are again determined automatically from the corresponding distributions:
:
2 ·
2 ·
(7)
Figure 1. Optimised road network (detail). Left: blue: initialisation; green: reference; red: final solution. Centre: green crosses: snake nodes; blue arrows: corresponding gradients of the internal energy (> twice the standard deviation of the distribution for all nodes). Right: crosses: image energy lower (green) or higher (red) than the mean value of all nodes; green circles: result of the first detector; blue circles: result of the second detector.
The second detector often finds only the two ends of wrong contour parts, because the image and the internal energies are both relatively high if the contour leaves the object outlines. If the contour part in between additionally converges to a wrong minimum in the image energy (e.g., a parallel road), the first detector does not help either. Unfortunately, these contour parts often have the largest distance to the reference. However, the beginning and the end of wrong contour parts are usually sufficient in order to guide the user during manual post processing. It should be noted that the two detectors are applicable only if the majority of the contour nodes are located inside the object boundaries. This is necessary in order to determine suitable parameters of the energy distributions.
3. EXPERIMENTS 3.1 Data
The experiments were carried out using two different data sets. The first data set, covering an area of 1 km2 of the city of Hameln (Germany), is characterized by flat terrain. The CIR images used for the generation of Eimage were acquired with an UltraCamXP camera and have a ground sampling distance (GSD) of approximately 0.2 m. The nominal forward and side laps of the images are 60% and 30%, respectively. The 3D points of the data set were derived with the commercial software package MATCH-T DSM (Heuchel et al., 2011). No ALS data were available. We test the applicability of our method with two different road databases, namely ATKIS (from the surveying authority of Lower Saxony, who also provided the orthorectified images and the DSM) and OSM (data provided by Geofabrik GmbH), and compare the results. Whereas ATKIS road centrelines have a homogeneous accuracy of 3-5 m, OSM shows an inhomogeneous accuracy due to the patchwork characteristic of this data set with local deviations that reach more than 20 m.
The second test data set (area: 0.7 km2) is situated close to the town of Vaihingen (Germany; Cramer 2010). Some agricultural areas and vineyards are located in the surroundings of the town. The ALS data set was acquired by the company Leica Geosystems using a Leica ALS50 system in 2008 (Haala et al., 2010). The ALS data has a high point density of 4-6 pts/m2 and a vertical and horizontal accuracy of 0.15 m and 0.5 m, respectively. The acquisition time in the leaf-on period decreases the proportion of ground points in vegetated areas. The CIR images were acquired with a DMC camera and have a GSD of approximately 0.08 m. The nominal forward and side laps of the images are 65% and 60%, respectively. The 3D point cloud (CIR images) was generated using the OpenCV implementation (OpenCV, 2012) of semiglobal matching (Hirschmüller, 2008) with the cost function of (Birchfield & Tomasi, 1998). The initialisation for the snakes was taken from OSM only. For both data sets reference roads were manually digitised in orthophotos, the GSD of the image energy is chosen to be 0.5 m. Thus, the relatively high uncertainty of the 3D points from matching does not overly affect the energy minimization process, because a smoothed version of the DTM can be used.
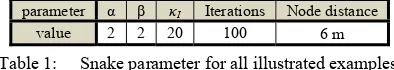
3.2 Results for stereo images with different vector data The tests in this section were carried out using the first data set. The main parameters for all tests in this paper can be found in Tab. 1. The general applicability of the method using stereo images is evaluated by two different road data sets with a different initial accuracy, namely ATKIS and OSM (cf. Tab. 2, ISPRS Annals of the Photogrammetry, Remote Sensing and Spatial Information Sciences, Volume I-3, 2012
column Init). The results are depicted in Fig. 2 and Tab. 2. For both road networks an improvement of the geometric accuracy can be observed. Whereas the root mean square (R.M.S.) value of the ATKIS roads, having already a high quality before the optimisation, only decreases by 0.2 m, an improvement of 1.2 m can be noticed for the OSM data set. The analysis of the cumulative histogram of the errors shows similar results. Of the initial nodes of the ATKIS roads, 57% and 85% are situated within a distance of 1 m or 2 m from the reference, respectively. These values increase to 62% and 92%. In contrast, for the OSM roads these values are increased significantly by 12% and 20%, respectively. These observations support the statement that our image energy derived from stereo images is generally significant enough to correct road parts that are situated outside the road surface (having larger errors). For contour parts already located inside the road surface the improvement is small. The largest errors occur in the vicinity of trees hanging across the roads. Such trees often disturb the image energy (higher NDVI and DTM roughness) and sometimes were also detected as (false positive) buildings generating a repulsion force for the corresponding road contours.
parameter α β κI Iterations Node distance
value 2 2 20 100 6m
Table 1: Snake parameter for all illustrated examples.
Tab. 2 also illustrates that the R.M.S. value of those nodes that were highlighted by the two error detectors is significantly higher than the values of the other nodes and that the number of detected outliers is relatively small (columns d1 and d2, respectively). This shows the general feasibility of our strategy for an internal evaluation. However, the number of detected nodes in these two examples is too small in order to considerably influence the general R.M.S. value after eliminating the wrong nodes (Tab. 2, last column).
Figure 2. Cumulative histogram of the orthogonal point-to-line distances of the snake nodes from the reference for the first data set. Left: ATKIS; right: OSM.
R.M.S. value
(m)
Test site 1 (1576 nodes) Init Result
(before) d1 (nodes) d2 (nodes) Result (after)
ATKIS 1.43 1.23 2.47 (15) 2.25 (35) 1.20 OSM 3.39 2.17 4.53 (22) 3.60 (54) 2.06 Table 2. Evaluation of the results for the first data set.
3.3 Comparison of the results with different sensor data The tests in this section were carried out using the second data set (OSM data only). These tests compare the performance of our method achieved with image energies derived from different sensor data, namely ALS data and stereo images. The results are shown in Fig. 3 and in Tab. 3. The R.M.S. value for both sensor data decreases by approximately 1.3 m. The cumulative histogram in Fig.3 demonstrates that the ALS data perform
better in the high-quality sector (up to a distance of 3 m from the reference) before eliminating outliers. Only 33% and 55% of the initial nodes are situated within a distance of 1 m and 2 m from the reference, respectively. These values increase to 52% and 82% for stereo images and to 64% and 88% for the ALS data. The largest errors occur due to poor initialisation (e.g., up to 20 m in Fig. 1) and again to the disturbing effect of vegetated areas on the proposed image energy. A few outliers in these areas with very large deviations significantly increase the R.M.S. value particularly for the ALS data (Tab. 3 third and fourth column). However, the two error detectors are able to recognise most of the erroneous contour parts for both sensors. This also decreases the R.M.S. value by approximately 0.5 m after eliminating the wrong nodes (Tab. 3 last column). The quality of Eimage and thus also the separability between correct and incorrect contour parts is slightly higher for the ALS data. As mentioned in Section 2.4, the second detector primarily highlights nodes in the transition zone between the road surfaces and the neighbouring areas. Therefore, this detector performs worse in the statistics in comparison to the first one, but nevertheless it is very useful for manual post processing.
Figure 3. Cumulative histogram of the orthogonal point-to-line distances of the snake nodes from the reference (second data set).
R.M.S. value
(m)
Test site 2 (1782 nodes) Init Result Table 3. Evaluation of the results for the second data set.
4. CONCLUSION
This paper is focused on the adaptation of road centrelines to stereo images by means of network snakes. The method described in (Göpfert et al., 2011) is adapted in order to exploit geometric and radiometric information of stereo images in the optimisation process replacing the ALS data as primary data source. Experiments illustrate that our approach using a new definition of the image energy derived from stereo images is generally able to correct larger errors in the road database. However, due to the currently lower geometric accuracy of the height data in comparison to ALS data (especially in vegetated areas), which influences the significance of the derived image energy, the method performs worse for stereo images in the high precision level. More radiometric features have to be integrated in the future, in order to increase the quality of Eimage and thus of the adaptation results. In addition to buildings and bridges, trees also provide valuable context information for the adaptation process of roads and rivers, which have not yet been considered. In different experiments trees and other vegetated areas disturb the design of the image energy. Thus, the explicit
20%
consideration of trees in the image energy may further improve the quality of the results.
The paper also presented an approach for an internal evaluation of the optimisation results. First tests show that the analysis of the energy components of the snake provides valuable information about the correctness of the optimised contour. Two detectors were suggested that are able to highlight erroneous snake parts. These parts can be manually corrected in post processing or optimised with different parameters. The proposed algorithm is only one step in the larger framework developed to solve the inconsistencies between the topographic vector data and sensor data. All objects in the vector data represented by suitable features in the sensor data should be adapted. This process provides a dense network of shift vectors which can be used in addition to prior accuracy knowledge in order to improve the consistency of the vector and sensor data.
ACKNOWLEDGEMENT
This research was supported by the surveying authorities of Lower Saxony (LGLN) and Schleswig-Holstein. We also express our gratitude to LGLN for providing the Hameln data set. The Vaihingen data set was provided by the German Society for Photogrammetry, Remote Sensing and Geoinformation (DGPF) (Cramer, 2010):
http://www.ifp.uni-stuttgart.de/dgpf/DKEP-Allg.html.
REFERENCES
Birchfield, S., Tomasi, C., 1998. A pixel dissimilarity measure that is insensitive to image sampling. IEEE-TPAMI 20(4), pp. 401-406.
Blake, A., Isard, M., 1998. Active contours. Springer, Berlin Heidelberg New York, 351 p.
Borkowski, A., 2004. Modellierung von Oberflächen mit Diskontinuitäten. Habilitation, TU Dresden, Germany, 91p.
Burghardt, D., Meier, S., 1997. Cartographic displacement using the snake concept. In: Förstner, Plümer (eds.), Semantic modeling for the acquisition of topographic information from images and maps, Basel, Birkhäuser Verlag, pp. 59-71.
Butenuth, M., Heipke, C., 2012. Network snakes: graph-based object delineation with active contour models. Machine Vision & Applications, 23:91-109, DOI: 10.1007/s00138-010-0294-8.
Cohen, L. D., Cohen, I., 1993. Finite element methods for active contour models and balloons for 2-D and 3-D images,
IEEE TPAMI 15(11), pp. 1131-1147
Cramer, M., 2010. The DGPF test on digital aerial camera evaluation – overview and test design. Photogrammetrie – Fernerkundung – Geoinformation 2(2010), pp. 73-82.
Cressie, N. A. C., 1990. The origins of Kriging, Mathematical Geology 22, pp. 239-252.
Förstner, W., 1996. 10 pros and cons against performance characterization of vision algorithms. In: Workshop on Performance Characteristics of Vision Algorithms, pp. 13–29.
Göpfert, J., Rottensteiner, F., Heipke, C., 2011: Using Snakes for the Registration of Topographic Road Database Objects to ALS Features. ISPRS J. Photogr. & Rem. Sens. 66(6), 858-871.
Haala, N., Hastedt, H., Wolf, K., Ressl, C., Baltrusch, S., 2010. Digital Photogrammetric Camera Evaluation –Generation of
Digital Elevation Models. Photogrammetrie – Fernerkundung – Geoinformation, Vol. 2, pp. 99-115.
Heuchel, T., Köstli, A., Lemaire, C., Wild, D., 2011. Towards the next level of quality DSM/DTM extraction with MATCH-T. In: Fritsch, D. (ed.), Photogrammetric Week ’11. Wichman Verlag, Berlin and Offenbach, pp. 197-202.
Hirschmüller, H., 2008. Stereo processing by semiglobal matching and mutual information. IEEE TPAMI 30(2):328-341.
Kerschner, M. (2003). Snakes für Aufgaben der digitalen Photogrammetrie und Topographie. PhD-thesis, IPF, Vienna University of Technology, 115p.
Kass, M, Witkin, A, Terzopoulos, D., 1988. Snakes: active contour models. Int. J. Computer Vision 1(4):321-331.
Koch, A., Heipke, C., 2006. Semantically correct 2.5D GIS data - The integration of a DTM and topographic vector data. ISPRS J. Photogr. & Rem. Sens. 61(1), 23-32.
Laptev, I., Mayer, H., Lindeberg, T., Eckstein, W., Steger, C. Baumgartner, A., 2000. Automatic extraction of roads from aerial images based on scale space and snakes, Machine Vision and Applications 12, pp. 23-31.
Lenk, U., Heipke, C., 2006. The radial topology algorithm - a new approach for deriving 2.5D GIS data models.
Geoinformatica 10 (4), 447-468.
McInerney, T., Terzopoulos, D., 1995. Topologically adaptable snakes. Proc. Int. Conf. Computer Vision, pp 840-845.
Oude Elberink, S., Vosselman, G., 2006. Adding the third dimension to a topographic database using airborne laserscanning, IntArchPhRS XXXVI/3, pp. 92-97.
OpenCV, 2012.
http://opencv.itseez.com/modules/calib3d/doc/calib3d.html
Pilouk, M., 1996. Integrated modelling for 3D GIS, PhD Thesis, Enschede, The Netherlands, ITC Publication Series 40.
Radeva, P., Serrat, J., Marti, E., 1995. A snake for model-based segmentation. Proc. Int. Conf. Computer Vision, pp. 816-821.
Rieger, W., Kerschner, M., Reiter, T., Rottensteiner, F., 1999. Roads and buildings from laser scanner data within a forest enterprise, IntArchPhRS XXXII / 3-W14, pp. 185-191.
Rottensteiner, F., Trinder, J., Clode, S., Kubik, K., 2007. Building detection by fusion of airborne laserscanner data and multi-spectral images: Performance evaluation and sensitivity analysis. ISPRS J. Photogr. & Rem. Sens. 62(2): 135-149.
Rousseaux, F., Bonin, O., 2003. Towards a coherent integration of 2D linear data into a DTM, Proc. 21st International Cartographic Conference (ICC). pp. 1936-1942.
Sithole, G., Vosselman, G., 2006. Bridge detection in airborne laser scanner data. ISPRS J. Photogr. & Rem. Sens. 61, 33-46.
Weidner, U. and Förstner, W. 1995. Towards automatic building reconstruction from high resolution digital elevation models, ISPRS J. Photogr. & Rem. Sens. 50(4), 38–49.
Zhu, P., Lu, Z., Chen, X., Honda, K., Eiumnoh, A., 2004: Extraction of city roads through shadow path reconstruction using laser scanning, PE & RS 70 (12): 1433-1440.