Michael Lokshin is a senior researcher at the Development Research Group, World Bank, 1818 H Street NW, Washington, D.C. 20433. The author gratefully acknowledges the financial support of the World Bank’s Gender Board. He thanks Dr. David Blau (UNC-CH), Dr. Martin Ravallion (The World Bank), and two anonymous reviewers of the paper for valuable comments. These are the views of the author, and should not be attributed to the World Bank. The data used in this research may be obtained from Carolina Population Center at University of North Carolina at Chapel Hill at:
http://www.cpc.unc.edu/projects/rlms/data.html
[Submitted October 1999; accepted February 2004]
ISSN 022-166XE-ISSN 1548-8004 © 2004 by the Board of Regents of the University of Wisconsin System
T H E J O U R NA L O F H U M A N R E S O U R C E S ● X X X I X ● 4
Women’s Work Behavior in Russia
Michael Lokshin
A B S T R A C T
The paper models household demand for childcare, mothers’ labor force par-ticipation and mothers’ working hours in Russia. The model estimates the effects of the price of childcare, mother’s wage, and household income on household behavior and well-being. Reduced-form models of the discrete and continuous household choices are estimated jointly using the
Semi-Parametric Full Information Maximum Likelihood method. This method con-trols for the error term correlations across outcomes, and the correlation of the error terms that can result when panel data are used. The estimations indicate that mothers’ labor force participation and working hours are responsive to changes in the price of childcare and hourly wages. The simu-lations presented in this paper show that family allowance transfers— intended as a means of reducing poverty—do not have a significant effect on a household’s choice of childcare arrangements. Replacing family allowances with childcare subsidies may have a strong positive effect on women’s labor force participation and thus can be effective in reducing poverty.
I. Introduction
went to school (Lapidus 1985). Women in the Soviet Union worked full-time the whole year round. Less than 1 percent of the female work force was employed part-time.
Soviet women could not have been involved in the economy to such an extent with-out the existence of a wide range of government-subsidized childcare programs, such as nurseries and preschool, kindergarten, and after-school programs. The number and variety of state-provided childcare facilities increased steadily throughout the Soviet era. By the mid-1980s some 15 million children between one and seven years of age (70 percent of children from that age group) were registered in public childcare institutions (Matthews 1986).
Reforms launched by the Russian government in early 1992 led to a dramatic change in the socioeconomic environment and put a great strain on the existing sys-tem of social protection and state-subsidized institutions. A drop in GNP in the 1990s resulted in an ever-widening budget deficit, shrinking government-funded programs, and a dramatic decline in the number of state-run childcare organizations. According to the Russian government’s national statistics agency (GosComStat 1998), the pro-portion of children in kindergarten and nurseries dropped by 55.1 percent and the number of preschool facilities declined by 35.6 percent between 1989 and 1997.
The sharp decline in the number of kindergartens and nurseries was accompanied by an increase in the cost of government-provided care. In the days of the Soviet Union, childcare costs were partly or totally covered by subsidies from the federal and local governments and/or from employers. But in present-day Russia, virtually all govern-ment child support programs have been eliminated and only a handful of companies can afford to provide daycare services for their employees’ children. The number of enter-prise preschools fell by three-quarters between 1990 and 1996 (Micklewright 2000). A system of private childcare providers has not yet developed to a degree sufficient enough to have a meaningful impact on the total supply of childcare. This affects all families with young children, but low-income families in particular.
The complexity of the problems faced by families with children in a transitional economy and the significant impact that reform of the childcare system can have on the political and economic environment in Russia prompted the research described in this paper. To shed light on the problems, I model household childcare choices, the decisions that Russian mothers make about whether to participate in the labor force, and the number of hours that they work. Using a model of consumer demand for state-provided childcare, I am able to estimate how the price of childcare, mothers’ wages, and household income all affect household behavior and welfare.
The econometric model I use is derived from a theory described in the literature on household decision-making about childcare and women’s participation in the labor market. The theory has several testable predictions. To test these hypotheses, I jointly estimate a reduced-form model of discrete household choices about childcare arrangements and the labor supply of its members and continuous choices about the number of hours the mother works and the children stay in formal care using the method of Semi-Parametric Full Information Maximum Likelihood (SPFIML). This method takes into account the error term correlations across outcomes, and the corre-lation of the error terms that can result when panel data are used.
has a strong positive effect on the labor activity of women with children and on the use of formal childcare. At the same time, family allowance transfers to households with young children do not have a significant effect on whether or how much they use formal (paid, state-provided) childcare or whether and how much the mothers work.
Until recently, little research had been conducted on the economics of childcare outside of the United States. In the last decade, several studies on childcare were car-ried out in Western Europe and Canada, where (as in the United States) growing num-bers of women with young children have been entering the work force (see, for example, Gustafsson and Stafford 1992 in Sweden; Cleveland, Gunderson and Hyatt 1996 in Canada; Van Den Brink and Groot 1997 in the Netherlands). Research on childcare and women’s labor market activity in the developing countries lags far behind. Little exists apart from a paper by Wong and Levine (1992) that focuses on childcare and mothers’ employment in Mexico, and a paper by Connelly, DeGraff, and Levison (1996) that examines the effect of childcare arrangements on the rate of women’s participation in the labor force in Brazil.
This is the first study to analyze the relationships among mother’s employment, choice of childcare, and demand for formal childcare in Russia in a unified frame-work. The paper is based on recent progress in the theory of demand for childcare and women’s labor supply in the United States. Methodologically, the paper follows the work of Blau and Robins (1988), Blau and Hagy (1998), Ribar (1992 and 1995), Connelly (1992), Michalopoulos, Robins, and Garfinkel (1992), Kimmel (1995, 1998), and Averett, Peters, and Waldman (1997), all of whom jointly model house-hold decisions about childcare and mothers’ decisions about entering the work force. The paper is organized as follows. The next section describes the data. Section III discusses the recent trends in female rates of labor force participation, unemployment and wage dynamics in Russia. Section IV develops the theoretical model and gives details about the empirical model. Estimation results and simulations are presented in Section V. Section VI discusses the policy implications. The paper concludes with summary of the findings and suggestions for future research.
II. Data
This research is based on data from the three rounds (December 1994, October 1995, October 1996) of the Russian Longitudinal Monitoring Survey (RLMS). The data are representative at the national level.1There are 1,262 house-holds with children younger than the age of seven in the pooled sample, and these households are represented by 2,169 household-wave observations. The data set includes information about the individual members of these households, about the households themselves, and about the community. It also contains information on the childcare arrangements made for each child in the household, the amount of time each child spent in formal and informal childcare, and the amount of money paid for for-mal childcare during the week of the survey. A part of the survey questionnaire
administered to groups of respondents who represented their local communities yields data about the different forms of childcare available locally.
III. Changes in the Russian Labor and Childcare
Markets in the 1990s
A contracting GNP in Russia during the 1990s caused employment to shrink, but not as much as in the countries of Central and Eastern Europe (CEE). In CEE countries, a 25–30 percent contraction in GNP caused employment to fall by 10–30 percent. In Russia, between 1992 and 1998, GNP dropped by almost 40 per-cent, causing employment to decrease by 14 percent (Kapeliouchnikov 1999). The rate of unemployment has been increasing slowly, from 4.7 percent in 1992 to 9.3 per-cent in 1996. In the early stages of economic transition, women made up a dispro-portionate share of unemployment (Fong 1993). The gap between male and female unemployment rates closed by 1994, and in 1996, 9 percent of women were unem-ployed, compared with 9.6 percent of men (Commander and Yemtsov 1997). However, more women than men dropped out of formal employment between 1992 and 1996. In 1992, 89 percent of prime-age men, and 82 percent of prime-age women worked. In 1996 the rates fell to 81 percent and 72 percent (Glinskaya and Mroz 2000). By comparison, 59.1 percent of women in Germany worked in 1996, 60.1 percent in France, and 75.6 percent in Sweden (ILO 1999).
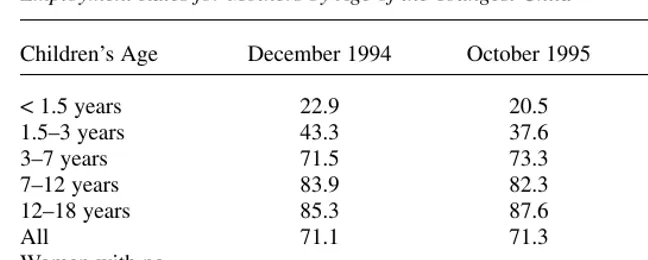
The proportion of working women with preschool aged children was lower; the majority of children enter school at the age of seven (OECD 1998). Table 1 shows employment rates for mothers grouped by the age of the youngest child. Only about 20 percent of infants (children younger than 18 months old) have mothers who are working. Employment rates for mothers increases sharply with the age of the youngest child. More than one-third of the women with the youngest child aged 1.5–3 years are working; this share increases to two-thirds for mothers whose youngest children are 3–7 years old, which is higher than the rate for women without children. Table 2 presents statistics on the use of different forms of childcare grouped by the age of the child.2The demand for different forms of childcare depends on the age of a child. Parents of infants tend to rely on home care. No infants attend state nurseries and most of the mothers with young children stay home. In-home childcare is also the primary type of childcare in households with children 1.5–3 years old. About 13–19 percent of 1.5–3 year-old children attend state kindergartens or nurseries, and a small proportion of toddlers receive their care from nonrelatives. The picture changes for preschool children. Roughly 37 percent of children in this age group attend state-provided childcare facilities, while the proportion of preschoolers in the care of nonrelatives is small.
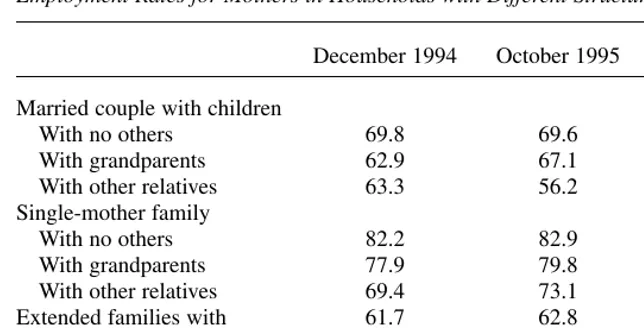
Table 3 shows the employment rates for mothers in different household structures. Approximately 70 percent of the married women who live with only their husbands and children work. Employment rates for mothers in two-parent families that live in
extended households is lower. In families with a single parent, the mother’s involve-ment in the labor market is much higher than the average for all families. For single-mother families living with no other relatives, the level of labor force participation is close to 83 percent. More than half of all Russian children live in extended house-holds, in which several families live together. The share of extended households in Russia is rising (Lokshin, Harris, and Popkin 2000). The living arrangements of households with children could be endogenous to the price and availability of formal childcare. Families with small children may choose to move into extended households where other household members could care for the small children when parents are at work.
Table 1
Employment Rates for Mothers by Age of the Youngest Child
Children’s Age December 1994 October 1995 October 1996
<1.5 years 22.9 20.5 19.6
1.5–3 years 43.3 37.6 34.2
3–7 years 71.5 73.3 72.7
7–12 years 83.9 82.3 80.2
12–18 years 85.3 87.6 86.9
All 71.1 71.3 70.3
Women with no
children 80.3 80.9 79.8
Sample size 1,475 1,395 1,364
Note: Sample of households with children younger than 18 years old.
Table 2
Percentage of Children in Different Forms of Care by Child’s Age
Type of Care
Nursery, Kindergarten
Home Care or Afterschool Nonrelatives
Children’s Age 1994 1995 1996 1994 1995 1996 1994 1995 1996
<1.5 years old 99.9 97.3 93.4 0.0 0.0 0.0 2.6 4.8 6.4 1.5–3 years old 92.9 87.8 85.8 12.5 12.8 19.1 5.9 4.6 7.0 3–7 years old 69.4 73.9 71.6 37.3 36.9 38.2 7.0 5.5 6.2
IV. Theoretical Issues and the Econometric Model
Having discussed the nature of labor force participation, employment of women with children, and types of childcare used in Russia, the next step is to for-mulate a model of the optimal behavior of households with children of preschool age. Russian households have to choose from three forms of childcare: care provided by the mother, informal childcare (at home, free) provided by other household members, and formal childcare.3The theoretical model is based on the assumption that the choices household members make about childcare, market goods, and leisure are sub-ject to budget and time constraints. A household’s decisions about the quality of child-care it wishes to obtain and the amount of time each member of the household can work are motivated by the desire to achieve the highest level of household welfare. The demand for childcare, hours of care, and amount of time the mother works can be derived as a function of the exogenous variables by solving the first-order condi-tions of household utility maximization. As the longer version of this paper shows, there exist several possible corner solutions (the combinations of the work status of the household members and the type of childcare used) of the household utility max-imization problem (Lokshin 2000). Assuming a given corner solution, the household optimizes the labor supply of its members and chooses the optimal quality of child-care. Subsequently the household chooses the corner solution with the highest utility. The analysis in this paper focuses on five corner solutions (shown in Table 4) that are empirically observed in the data.
3. About 6 percent of the households in the sample used nonrelatives as childcare providers for their chil-dren. I classified these households as the household that use paid childcare.
Table 3
Employment Rates for Mothers in Households with Different Structures
December 1994 October 1995 October 1996
Married couple with children
With no others 69.8 69.6 71.5
With grandparents 62.9 67.1 66.3
With other relatives 63.3 56.2 62.1
Single-mother family
With no others 82.2 82.9 82.7
With grandparents 77.9 79.8 72.5
With other relatives 69.4 73.1 67.4
Extended families with 61.7 62.8 56.7
children
Total families with children 71.1 71.3 70.3
Sample size 790 701 678
The utility that the ith household derives from the choice of the jth discrete alternative at time tcan be expressed in linear form as:
( )1 Xijt=Xrijt+fijt=Xitbj+Zijtcj+fijt j=0, . . . ,4
where Ωijtis the utility for household ichoosing state jat time t, Xitis the vector of the household characteristics that affect the choice of the ith household at time
tand that do not vary by state, Zijtis the vector of outcome-specific variables, βand
γare vectors of unknown parameters, and εijtis a random disturbance that reflects, among other things, unobservable attributes of the alternatives. The probability that household ichooses state jat time tis then:
For the 23 percent of households in the sample with no access to formal childcare facilities the conditional contribution of the discrete outcome equation to the likeli-hood function is calculated based on a restricted set of possible forms of care, that is, that there are no formal care arrangements available in the choice set of these households (j = 0, . . . , 2).
The equations for the supply function for mother’s hours at work and for the demand function for hours spent by children in formal care can be specified in linear form as:
( ) H X Z ,where k hours mother works
hours children spend in paid care
3 1
Here, Hitkis the continuous dependent variable associated with household iin state jat time t.In the first continuous outcome equation, Hit1is the number of hours that a
mother supplies to the labor market, and Hit2is the number of hours spent by children in formal childcare facilities. ϕkand αkare vectors of unknown parameters, and ξ
itkis
an error term with mean zero.
The error terms in the discrete (ε) and continuous (ξk) equations may be correlated
across states and among each other. If, for instance, a mother’s participation in the labor force is determined, among other factors, by some unobservable taste for work, this unobserved factor will be part of εijtfor states in which the mother is employed
(j= 1, . . . ,4). In the continuous outcomes, the number of hours that the mother sup-plies to the labor market depends, among other things, on her taste for work. Women with a high preference for work can be expected to work longer hours and are more likely to be employed. In addition, because panel data are used in the model, there exists the possibility of a correlation in the error terms among the multiple observa-tions of the same family (correlation between εijt2and εijt1, t1≠t2and correlations between ξitk1and ξitk 2, t1≠t2).
To account for possible error correlations I impose a factor structure on the distur-bances in Equations 1 and 3:
where µijtis an independent extreme value error, and λit, and γitare independent
nor-mal random variables. V1is a permanent factor (a factor that remains the same for the household at any time point, that is, a household-specific effect) while V2is a transi-tory factor (within a single household, the factor will be different at any two different points in time). The system of Equations 1–3 is estimated by the Semi-Parametric Full Information Maximum Likelihood (SPFIML) method developed by Liard (1978), Heckman and Singer (1984), and Mroz (1999).
A. Dependent Variables
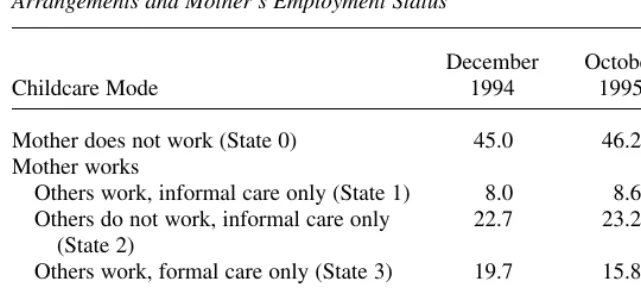
The dependent variable for the discrete outcome equation is defined according to the possible combinations of employment status of household members and the type of childcare chosen. The distribution of households by the mothers’ labor force partici-pation and by the mode of childcare chosen is presented in Table 4. More than 45 per-cent of households with young children have nonworking mothers. The perper-centage of mothers who stayed at home with their children increased slightly from 1994 to 1996. Among the households that use other types of care, the largest single group is formed by families using household members other than the child’s mother as childcare providers. A third of the households with a working mother use this type of care. About 18 percent of households used only formal facilities for childcare. And a small minority of Russian households used both formal and informal childcare.
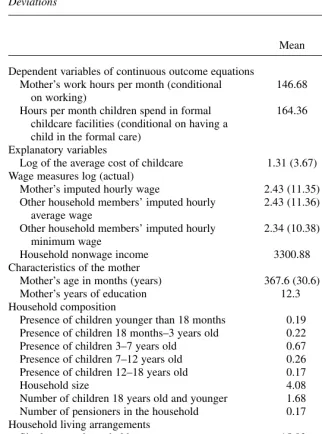
The distribution of the dependent variables for continuous outcome equations, that is, the time that mothers spent working and the time that children spent in formal care is shown in Table 5. Continuous outcomes are observed only among the sample of working mothers or among the sample of children in formal care. Employed mothers work on average 146.6 hours a month. It is lower than the 160 hours per month that constitutes full-time employment in Russia.
Table 4
Distribution of Households with Children 0–7 years old by the Choice of Childcare Arrangements and Mother’s Employment Status
December October October
Childcare Mode 1994 1995 1996
Mother does not work (State 0) 45.0 46.2 47.3
Mother works
Others work, informal care only (State 1) 8.0 8.6 8.8
Others do not work, informal care only 22.7 23.2 18.5
(State 2)
Others work, formal care only (State 3) 19.7 15.8 18.8
Others do not work, formal and informal 4.5 6.2 6.6
care (State 4)
Table 5
Summary Statistics for the Explanatory Variables, the Means and Standard Deviations
Standard
Mean Deviation
Dependent variables of continuous outcome equations
Mother’s work hours per month (conditional 146.68 33.87
on working)
Hours per month children spend in formal 164.36 42.28
childcare facilities (conditional on having a child in the formal care)
Explanatory variables
Log of the average cost of childcare 1.31 (3.67) 1.08
Wage measures log (actual)
Mother’s imputed hourly wage 2.43 (11.35) 0.42
Other household members’ imputed hourly 2.43 (11.36) 0.83 average wage
Other household members’ imputed hourly 2.34 (10.38) 0.85 minimum wage
Household nonwage income 3300.88 855.1
Characteristics of the mother
Mother’s age in months (years) 367.6 (30.6) 94.7 (7.9)
Mother’s years of education 12.3 3.6
Household composition
Presence of children younger than 18 months 0.19 binary
Presence of children 18 months–3 years old 0.22 binary
Presence of children 3–7 years old 0.67 binary
Presence of children 7–12 years old 0.26 binary
Presence of children 12–18 years old 0.17 binary
Household size 4.08 1.43
Number of children 18 years old and younger 1.68 0.89
Number of pensioners in the household 0.17 0.42
Household living arrangements
Single parent household 15.82 binary
Household with two parents 84.18 binary
Type of locality
Metropolitan areas indicator 0.09 binary
Other urban areas indicator 0.66 binary
Rural areas indicator 0.25 binary
Sample size 2169
B. Explanatory Variables
The definitions and descriptive statistics for the explanatory variables in the system of Equations 1.1–1.2 are presented in Table 5. Several key variables of interest are discussed in detail below.
1. Price Per Quality Unit of Childcare (Pq)
I identify the effect of childcare prices on household behavior through district-level differences in these prices. Fees charged by kindergartens depend on the local budg-ets and vary considerably by locality. Most of the preschool facilities are funded from the local budgets and from the limited contributions of local enterprises. Although some nationally established regulations about the quality of care exists, the educa-tional and developmental programs, children-to-teacher ratios, and group sizes differ by locality. Salaries of the childcare workers are determined at the local level and are related to average wage rates in the locality.
In the RLMS, households reported their weekly expenditures on childcare and the time that their children spent in a formal childcare facility during the week of the sur-vey. There is no direct way to relate such information to the quality of childcare pro-vided, because no data were collected on the regional characteristics of childcare facilities (such as the sizes of groups in pre-school establishments, quality of person-nel, etc.). Like Blau and Robins (1988), I assume that the quality of formal childcare is uniform within a locality (that includes about 40 households with young chil-dren) and I use the average per hour price of care as a proxy for the price per unit of childcare quality in 30 localities in Russia.
2. Offered Wage of the Mother (Wm) and Other Household Members (Wo)
The wage rates available to each mother have been imputed using a Mincer (1974) type earnings function regression with a control for selectivity bias (Heckman 1979), estimated on a sub-sample of working women for whom hourly wage data were avail-able.4The hourly wage has been calculated as a ratio of the monthly earnings and the total number of hours individuals worked during the month the survey was administered.
In the wage regression, the following explanatory variables have been used to pre-dict mothers’ hourly earning—the mother’s educational level, her age, details on the region and the type of settlement where she lives (urban-rural), the number of chil-dren she has (as a proxy for work experience), and the amount of time she had been in her current main job. Imputations are made based on women’s predicted hourly wages, with the job tenure of nonworking mothers being equal to zero. Here the
offered wage is assumed to be a wage that a mother could earn if she were to start a new job.
The wage rates available to other household members have been imputed in a sim-ilar way. Six separate regressions were estimated for the subsamples of youth (males and females 18–25 years of age), prime aged individuals (males 26–59 and females 26–54), and individuals of retirement age (male 60+and females 54+). Wage rates for other household members of particular ages and gender were then imputed from the corresponding regressions. To integrate individual wages of other household members into one indicator I use two alternative measures: the average and the minimum level of wages available to household members other than the mother.
3. Other Explanatory Variables
Other explanatory variables for estimation of the system of Equations 1.1–1.2 include some individual characteristics of the mother such as her age and level of education, household demographics and size, the number of children in the household and their ages, the number of pensioners in the household, the household’s geographical char-acteristics, and the household nonwage income that may have included social security transfers, private transfers, in-kind income, and income from home production.
V. Results
Table 6 presents the estimated coefficients for the discrete and con-tinuous outcome equations. According to the likelihood-ratio test criterion, the spec-ification that assumes an independence of the error terms in Equations 1.1–1.2 is rejected in favor of the SPFIML estimation.5
The estimations confirm the main predictions of the theoretical model. For the dis-crete outcome equation, positive and significant coefficients on the mother’s wage variable indicate that higher potential wages of the mother encourage her to work, increasing the opportunity cost of the mother’s time at home. Higher wages of other household members have a positive impact on the probability that households will choose states where other household members work and a significant negative impact on the probability that other household members do not work. Costs of childcare neg-atively and significantly affect the probability that households will choose states where the mother works. Estimation does not reveal any significant effect of house-hold nonwage income on the behavior of househouse-holds with children. More highly edu-cated women with children are more likely to be in the labor force and to use formal care. Households with children younger than three years of age are less likely to have working mothers than households with older children, because the custodial needs of young children place a competitive demand on the use of the mother’s time. Such households are less likely to use formal childcare arrangements. Presence of older sib-lings (12–16 years of age) has a positive and, for two states, significant effect on the probability that the mother works. This result may support the hypothesis that older
Lokshin
1105
Discrete Mode of Childcare and Household Labor Supply
Case when the Mother Does Not Work is a Reference Continuous Outcome Equations
Others Do Not
Others Do Not Work
Others Work Work Others Work Informal and Hours in Formal
Informal Care Informal Care Formal Care Formal Hours of Work Care
Coeffi- Standard Coeffi- Standard Coeffi- Standard Coeffi- Standard Coeffi- Standard Coeffi- Standard cient Error cient Error cient Error cient Error cient Error cient Error
Household composition
Younger than 18 months −3.12** 0.49 −3.64** 0.70 −5.38** 1.00 −5.80** 1.00 −6.57 4.60 −13.90** 2.44
18 months-3 years old −1.45** 0.45 −1.89** 0.62 −4.13** 0.91 −4.73** 1.22 −14.03** 4.06 1.93 2.31
3–7 years old 0.55 0.45 0.73 0.64 −0.80 0.93 −0.90 1.30 −8.15 4.27 0.61 2.44
7–12 years old 0.97* 0.40 0.81 0.54 0.32 0.54 −0.16 0.67 −4.50 3.04 −13.83** 1.59
12–18 years old 1.27** 0.47 0.43 0.64 2.43 0.62 1.95** 0.76 −7.31 2.21 −11.71** 1.70
Household size 7.45** 1.44 −0.40 1.90 2.31 2.04 −3.57 2.34 40.86** 3.26 −3.59 4.72
Number of children ⇐18 −8.87** 2.41 1.43 3.29 −10.98** 3.77 −0.05 4.50 14.58** 4.16 13.13** 1.67
Number of pensioners −3.84 2.23 1.70 3.07 −12.01** 2.88 −10.54** 3.84 10.99** 2.11 −0.42 5.69
Single mother household −0.33 0.50 1.36* 0.62 0.64 0.53 1.92** 0.62 22.27** 2.53 −0.54 1.54
Households with two parents
Reference Household incomes
Household nonwage income −0.15 1.94 2.50 2.43 −0.96 2.10 −0.06 2.56 −32.06** 4.97 −4.10 6.27
Log wage rate of others 0.25 2.21 −8.09** 2.66 7.26* 3.26 −6.36* 3.09 25.12** 3.20 2.33 5.45
Log of cost of childcare −3.19** 1.16 −3.39* 1.52 −2.93* 1.36 −4.45** 1.73 −19.56** 1.44 −3.53 3.95
Household regional dummies
Other urban areas of Russia −0.36 0.36 −0.04 0.47 −2.23** 0.50 −1.70** 0.56 0.85 2.48 0.29 1.19
Moscow and St. Petersburg −1.54 0.67 −1.52 0.88 −1.15 0.87 0.24 1.19 −22.44** 1.70 −0.43 2.51
North and North-West −1.29 0.63 −2.12** 0.80 2.54** 0.71 3.38** 0.94 −21.13** 1.91 1.72 1.97
The Journal of Human Resources
Table 6 (continued)
Discrete Mode of Childcare and Household Labor Supply
Case when the Mother Does Not Work is a Reference Continuous Outcome Equations
Others Do Not
Others Do Not Work
Others Work Work Others Work Informal and Hours in Formal
Informal Care Informal Care Formal Care Formal Hours of Work Care
Coeffi- Standard Coeffi- Standard Coeffi- Standard Coeffi- Standard Coeffi- Standard Coeffi- Standard cient Error cient Error cient Error cient Error cient Error cient Error
Volgo-Vyatskiy −0.44 0.56 −1.51* 0.72 2.34** 0.70 2.29** 0.91 −2.19 2.35 −3.71** 2.07
North Caucasis 0.40 0.52 −0.30 0.71 1.78* 0.79 1.80 1.00 −7.20** 2.68 −2.93 2.23
Ural −0.12 0.57 −1.13 0.73 3.05** 0.72 3.49** 0.90 −19.72** 2.06 0.11 1.94
Western Siberia −0.14 0.55 −1.10 0.73 1.30 0.75 2.11* 0.96 −20.24** 2.38 −1.62 2.01
Eastern Siberia
Reference Time dummies
Round 5 0.03 0.29 −0.06 0.39 −0.81* 0.37 −1.19* 0.50 −11.66** 2.14 −0.08 1.18
Round 6 0.35 0.30 0.21 0.39 −0.63 0.37 −0.66 0.46 3.24 2.05 −2.03 1.24
Round 7
Reference Characteristics of the mother
Mother’s age in years 1.60 1.35 1.05 1.86 −0.70 1.83 −1.49 2.10 10.31** 2.31 1.99 4.51
High school completed −0.46 0.42 −0.28 0.55 −1.31* 0.57 −1.08 0.69 13.93** 1.50 −0.91 1.42
Technical/vocational school 0.26 0.38 −0.19 0.50 −0.17 0.51 −0.17 0.63 17.91** 1.44 −1.87 1.30
University
Reference
Log of mother’s hourly wage 14.18** 4.37 13.24* 6.11 17.98** 6.15 19.67** 6.02 33.18** 3.20 11.89 8.97
Constant −6.82** 1.44 −3.65* 1.82 −14.86** 2.40 −11.05** 2.41 121.55** 4.32 −2.22 4.00
children act as substitutes for the mother in home production and, particularly, in childcare. Or, similar to Connelly, DeGraff, and Levison’s (1996) findings in Brazil, the greater need for income when the teenagers are present in the household may be increasing the probability that mothers will work. The household’s structure does appear to be an important determinant of its choice of childcare. The availability of grandparents and other family members encourages households to use informal types of childcare and minimizes their propensity to use formal care. Estimated coefficients also indicate that there are significant regional differences in household preferences for types of childcare and the extent of labor mothers will supply. Households in the rural areas of Russia are more likely to have working mothers than the families in the urban or metropolitan areas.
Estimates in the hours of work equation show that the mother’s wage rate has a pos-itive and significant effect on the number of hours the mother works. Higher costs of childcare decrease the number of hours mothers work. Controlling for the wage rates, lower educated and older mothers work more. The presence of children younger than three years of age has a negative and significant effect on the hours worked. Relative to women with children in households with both parents, single mothers work more. There are significant regional differences in the number of hours mothers work.
Coefficients of the hours in the formal care equation indicate that the presence of children younger than 18 months significantly decreases the number of hours children aged 3–7 spend in formal care. Once the mother or the relative is watching the infant, she might as well watch older children. If there are older siblings in the household, the number of hours in formal care is also lower. Older siblings could be used in the household as free childcare providers, thus decreasing the time the younger children stay in formal care. Maternal wage rates and costs of care have no significant effects on the hours children spend in formal care.
The Russian results confirm those found in other countries. The elasticity of the mother’s labor force participation with respect to increases in the price of childcare,
−0.12 in Russia, is similar to the elasticity of −0.17 found in the transitional economy of Romania (Lokshin and Fong 2000) and in the United States, where Blau and Hagy (1998), also using the SPFIML approach, report that the elasticity of women’s labor force participation is −0.20. Anderson and Levine (1999) found that the elasticities for women with children younger than 13 range between −0.055 and −0.358 in the United States. The elasticity of the household’s use of formal childcare with respect to the costs of care is −0.11 for Russia and −0.41 for Romania.
VI. Welfare Impact of Three Government Programs
Poverty rates among families with children were increasing in the first half of the 1990s, and by 1996, 44.5 percent of children under age seven were living in poverty.6The proportion of poor nuclear families reached 38 percent, and half of the single parent households were poor. The social protection of households with children became a priority for the Russian government. But when allocating limited
budget funds, policymakers need to decide which policies are most likely to improve the well-being of Russian families. Currently, the main policies that target households with children in Russia involve child and family allowances (Lokshin, Harris, and Popkin 2000). Other possible policies in this area include wage-rate subsidies and childcare subsidies.
The effectiveness and distributional impact of these policies can be determined through simulations. In a given simulation, the value of the variable of interest is assigned to all the households in the sample. The simulated probabilities for the model outcomes are generated for each household at every time point by integrating over the estimated heterogeneity distribution and averaging the probabilities across the sample. Next, the value of the variable of interest is changed, and a new set of simulated probabilities is generated. The effect of changes in a particular variable on the model outcomes is calculated as the difference between the two simulated probabilities.
A significant proportion of Russian households do not have access to formal child-care facilities. One could argue that the effectiveness of various policy measures could depend on the sample of affected households. To discern the sensitivity of the policy simulations I present two set of results. The first set of simulations, shown on the top panel of Table 7 is based on the estimations results for the total sample of household with children. The simulations at the bottom part of Table 7 are derived from the esti-mates based on the restricted sample of those households that have access to formal care (Shown in Table A1 in the appendix).
Suppose the government introduced childcare subsidies that made childcare free. These subsidies are available only to the families that use formal childcare. The total government expenditure on subsidized care would consist of subsidies to those house-holds that were using formal care before the new subsidy was introduced plus subsi-dies to those households switching from informal care to formal care because of the lower price.
Focusing on the simulations based on the total sample, a decrease in the costs of care would encourage households to choose formal childcare arrangements (State 3
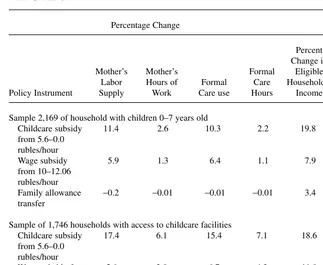
and 4), and also encourage mothers to work. If formal childcare were fully subsidized (in other words, the price was zero), as opposed to the current situation in which the average childcare price is 5.6 rubles per hour, the rate of mothers’ labor force partic-ipation would increase by 11.4 percent from 50.0 percent to 55.7 percent. That num-ber is comparable to the pretransition levels of maternal employment in Russia, when the costs of childcare were small. The proportion of households that use of formal care facilities would increase by 10.3 percent, from 21.4 percent to 23.6 percent of households (this number is a weighted sum of the changes in States 3 and 4). This share is three times lower than the proportion of children in kindergarten in pretran-sition Russia, when almost 70 percent of children 3–6 years of age were in formal care (GosComStat 1998).
not work to enter the labor market. Mothers who were employed before the policy was implemented would work longer hours. The number of households that used formal care would also go up by 6.4 percent. The rate of women’s labor force participation would grow by 5.9 percent and 52.4 percent of households would benefit from this policy.
Childcare subsidies would increase maternal employment by almost twice as much as wage subsidies. Both measures would increase the total income of eligible house-holds. In the case of households using formal childcare before the childcare subsidies were introduced, the increase in income would come from a decrease in the amount of money spent on childcare and an increase in the mother’s wage income because she would be working longer hours. In the case of households that started using formal care because of the lower prices, household income would increase because mothers would be entering the labor market.
The wage subsidies would increase total household income because mothers already in the labor force would spend more time at work and because mothers who had been outside the labor force would bring in income after they became employed. A third policy alternative is a family allowance transfer. Assume again that the
Table 7
Simulation of the Three Possible Scenarios of Government Support for Households with Children
Percentage Change
Percent Who is
Change in Eligible,
Mother’s Mother’s Formal Eligible (Percent
Labor Hours of Formal Care Households’ of All Policy Instrument Supply Work Care use Hours Income Households)
Sample 2,169 of household with children 0–7 years old
Childcare subsidy 11.4 2.6 10.3 2.2 19.8 Formal
from 5.6–0.0 childcare Sample of 1,746 households with access to childcare facilities
Childcare subsidy 17.4 6.1 15.4 7.1 18.6 Formal care
from 5.6–0.0 users (28.4)
rubles/hour
Wage subsidy from 5.6 3.0 6.7 4.3 11.0 Working
10–14.1 rubles/hour mothers
(56.8)
Family allowance 0.3 0.0 0.6 0.7 4.1 All
transfer households
government wants to spend the same amount of money on family transfers as it spent on each of the first two policies. According to the model, the level of labor force par-ticipation of mothers would drop slightly, but total household income would increase because of higher nonwage income. All households with children would benefit from this policy.
These simulations indicate that childcare subsidies are substantially more effective than wage subsidies at increasing employment per ruble of government expenditure. They would also be more effective in inducing households to use formal childcare.
Comparing the effects of the above three policies on the income levels of Russian households with children reveals that childcare subsidies would produce the largest increase in family income, both for the beneficiaries and, if averaged out, for the whole sample. Wage subsidies would produce the next biggest increase, followed by family allowance transfers. Households that use formal care would experience on average a 19.8 percent increase in their incomes as a result of fully subsidized child-care. The effect of wage subsidies would be significantly smaller (yielding a 7.9 percent increase in total household income), but it would affect more families. The uniform family allowances would increase the income level of all households with children by only 3.4 percent.
The relatively greater effectiveness of childcare subsidies under a revenue-neutral experiment stems from the fact that childcare subsidies go to the smallest proportion of households with children, in comparison with other policies. Thus, households with children in formal childcare facilities experience a significantly larger impact on their total income with childcare subsidies (an increase of 1,261 rubles per month) than with wage subsidies (an increase of 472 rubles per month) or with family allowance transfers (198 rubles per month). Larger changes in household income allow more households with children to change the type of childcare they use (to for-mal childcare) and to free their mothers for work. Other policies do not change total household income enough to induce households to switch to a new state. For many households the additional income results only in intra-state adjustments and thus fails to produce a significant impact on household behavior.
The simulations using the restricted sample of the households with access to child-care facilities show a stronger effect on the way childchild-care prices impact maternal employment and use of formal care than do simulations conducted on the whole sam-ple (bottom panel of Table 7). Fully subsidized childcare would lead, for households with access to formal care, to a 17.4 percent increase in the number of working moth-ers and a 15.4 percent increase in the number of households using formal childcare arrangements. This is an expected outcome, as every household in the restricted sam-ple could switch from in-home to formal care, while changes in the price of care would have no effect on the behavior of households without access to formal care facil-ities. The effects of other policies on household behavior are similar for simulations based on the whole and on the restricted sample.
VII. Conclusion
Estimating the joint model of household childcare choices, mothers’ labor supply decisions, and household demand for formal childcare confirms the pre-dictions of the theoretical model used in this paper. The economic incentives are shown to have a powerful effect on the work behavior of women with children in Russia. The level of wages available to them and the costs of childcare can both be expected to affect women’s labor force participation and labor supply decisions. Childcare costs affect which childcare arrangement households choose. When the costs of care are high, this discourages households from using formal childcare and increases the number of households that rely only on informal care.
Government subsidies for childcare may increase the number of mothers who work, thus increasing the incomes of poor households and lifting some families out of poverty. The simulations in this paper have shown that measures such as subsidies aimed at reducing the costs of market childcare are more effective than measures that raise women’s wages in increasing the number of employed mothers and the number of hours that they work.
A significant proportion of Russian households with children use a network of fam-ily members to provide most of their childcare. Those families in which some mem-bers do not work are unlikely to use paid care as informal care is available from the nonworking family members. It would appear that in Russia this kind of informal care has substituted for the care that used to be provided by the Soviet government, which would explain the fact that there is still a relatively high level of participation by women in the labor force despite the sharp drop in the number of kindergarten schools and nurseries in the last 10 years.
Further research is needed in several areas. First, this paper has assumed perfectly elastic demand for labor with respect to an increase in women’s labor supply. However, given Russia’s shrinking economy, it seems unlikely that the market could actually accept a significant influx of women without any wage adjustments. An increase in the women’s labor supply might lead to a drop in real wages, which would mean that the actual effects of the policies simulated in this paper would be quite dif-ferent. This may also be true of the childcare market where an increase in the demand for formal care might cause the market prices of childcare to increase.
The next question that needs further research is the distributional impact of the var-ious potential government policies. Even if childcare subsidies produce, on average, the largest increase in household income (compared with subsidizing wage rates or having a system of family allowances), it is unclear which households would benefit most from these subsidies. The poorest households with children in Russia may not benefit from this kind of subsidy, which means that other policy measures would be needed to improve the well-being of such families.
The Journal of Human Resources
Appendix 1
Table 6(a)
SPFIML Estimation of System of Equations (1.1–1.2)
Discrete mode of childcare and household labor supply
Case when the mother does not work is a reference Continuous outcome equations
Others Do Not
Others Do Not Work
Others Work Work Others Work Informal And Hours in Formal
Informal Care Informal Care Formal Care Formal Hours of Work Care
Coeffi- Standard Coeffi- Standard Coeffi- Standard Coeffi- Standard Coeffi- Standard Coeffi- Standard cient Error cient Error cient Error cient Error cient Error cient Error
Household composition
1.5–3 years old −1.40*** 0.38 −1.38** 0.50 −2.16*** 0.52 −2.18** 0.87 −17.45 12.33 0.50 4.09
3–7 years old −0.59 0.41 −0.01 0.57 −0.26 0.57 −0.25 0.95 −13.64 13.48 6.53 4.83
7–12 years old 0.63* 0.25 0.40 0.33 0.14 0.29 −0.14 0.45 −6.29 6.46 −17.42 3.03
12–18 years old 0.84** 0.30 0.34 0.42 1.05*** 0.33 0.93* 0.51 −6.03 7.60 −12.21 3.39
Household size 0.35*** 0.10 −0.26* 0.13 0.18* 0.11 −0.32* 0.17 3.22 2.80 −0.25 1.33
Number of children⇐18 −0.43* 0.19 0.27 0.26 −0.52** 0.22 0.28 0.35 4.78 5.11 12.63 2.26
Number of pensioners −0.10 0.16 0.35* 0.20 −0.46* 0.19 −0.29 0.32 4.61 4.37 1.54 2.15
Single-mother household −0.44 0.34 1.13*** 0.31 0.18 0.32 1.46*** 0.40 17.94** 7.36 1.15 3.49
Lokshin
1113
Log of cost of childcare −1.79** 0.77 −2.17** 1.04 −1.70** 0.80 −3.60** 1.44 −10.81 8.98 −19.07** 8.96
Household regional dummies
Other urban areas of Russia −0.23 0.22 −0.24 0.28 −0.82*** 0.22 −0.41 0.36 −0.40 4.92 1.97 2.36
Moscow and St. Petersburg −1.32** 0.44 −0.60 0.52 −1.08** 0.48 0.09 0.78 −28.48** 10.73 5.65 4.91
North and North-West −0.30 0.38 −0.47 0.49 0.81** 0.40 1.25* 0.63 −16.27* 8.67 4.75 4.04
Centra 0.03 0.33 −0.37 0.43 0.84** 0.38 0.65 0.65 −9.51 8.26 5.49 4.05
Volgo-Vyatskiy −0.31 0.35 −0.46 0.44 0.85** 0.40 0.18 0.65 3.02 8.85 4.49 4.33
North Caucasis −0.35 0.35 −0.38 0.43 0.24 0.42 −0.04 0.69 −0.05 9.11 2.04 4.49
Ural 0.01 0.35 0.03 0.43 1.39*** 0.38 1.37** 0.62 −14.66** 8.29 8.20** 4.03
Western Siberia −0.56* 0.33 −0.75* 0.44 0.07 0.38 0.45 0.63 −10.24 8.33 5.18 4.04
Eastern Siberia Reference
Time dummies
Round 5 0.05 0.19 −0.23 0.25 −0.22 0.20 −0.46 0.33 −13.57** 4.67 0.18 2.16
Round 6 0.10 0.20 −0.11 0.24 −0.08 0.20 −0.01 0.31 0.79 4.77 0.51 2.19
Round 7 Reference
Characteristics of the mother
Mother’s age in years 0.24 0.96 −1.98* 1.19 −0.71 1.10 −1.41 1.65 22.95 30.42 3.02 13.22
High school completed −0.61* 0.27 −0.50 0.33 −0.63** 0.28 −0.71 0.45 7.91 6.54 2.56 3.07
Technical/vocational school 0.04 0.24 −0.40 0.31 −0.01 0.25 −0.22 0.40 15.39** 5.65 1.58 2.70
University Reference
Log of mother’s wage 6.21** 3.55 5.32 4.13 8.84** 4.83 9.43** 5.35 56.76*** 8.85 43.50 38.16
Constant −1.28 1.11 1.30 1.45 −2.13* 1.23 0.69 1.96 119.37** 29.78 6.15 12.74
References
Anderson, Patricia, and Philip Levine. 1999. “Child Care and Mothers’ Employment Deci-sions.” Working paper # 7058. National Bureau of Economic Research, Cambridge. Averett, Susan, Elizabeth Peters, and Donald Waldman. 1997. “Tax Credits, Labor Supply,
and Child Care.” Review of Economics and Statistics79(1):125–35.
Blau, David, and Philip Robins. 1988. “Child Care Cost and Family Labor Supply.” Review of Economics and Statistics70(3):374–81.
Blau, David. 1999. “The Labor Market Effects of Child Care Subsidies.” University of North Carolina at Chapel Hill. Unpublished.
Blau, David, and Alison Hagy. 1998. “The Demand for Quality in Child Care.” Journal of Political Economy106(1):104–39.
Cleveland, Gordon, Morley Gunderson, and Douglas Hyatt. 1996. “Child Care Costs and the Employment Decision of Women: Canadian Evidence.” Canadian Journal of Economics
29(1):132–51.
Commander, Simon, and Ruslan Yemtsov. 1997. “Russian Unemployment: its Magnitude, Characteristics, and Regional Dimensions.” In Poverty in Russia: Public Policy and Private Responses, ed. J. Klugman. Washington, D.C.: EDI Development Studies, The World Bank.
Connelly, Rachel. 1992. “The Effect of Child Care Costs on Married Women’s Labor Force Participation.” Review of Economics and Statistics74(1):83–90.
Connelly, Rachel, Deborah DeGraff, and Deborah Levison.1996. “Women’s Employment and Child Care in Brasil.” Economic Development and Cultural Change44(3): 619–56. Fong, Monica. 1993. “The Role of Women in Rebuilding the Russian Economy.” Studies of
Economies in Transition10. Washington, D.C.: The World Bank.
Glinskaya, Elena, and Thomas Mroz. 2000. “The Gender Gap in Wages in Russia from 1992 to 1995.” Journal of Population Economics13(1):353–86.
GosKomStat. 1998. “Russia in Numbers.” Moscow, Russia: State Statistical Agency (GosComStat).
Gustafsson, Siv, and Frank Stafford. 1992. “Child Care Subsidies and Labor Supply in Sweden.” Journal of Human Resources27(1):204–29.
Heckman, James. 1979. “Sample Selection Bias as a Specification Error.” Econometrica
47:153–61.
Heckman, James, and Burton Singer. 1984. “A Method of Minimizing the Impact of Distribu-tional Assumptions in Econometric Models for Duration Data.” Econometrica52: 271–320. ILO.1999. “Key Indicators of the Labor Market (KILM).”Geneva: International Labor
Organi-zation.
Kimmel, Jean. 1995. “The Effectiveness of Child Care Subsidies in Encouraging the Welfare-to-Work Transition of Low-Income Single Mothers.” American Economic Review
85(2):271–75.
——— . 1999. “Child Care Costs as a Barrier to Employment for Single and Married Mothers.” Review of Economics and Statistics80(2):287–99.
Lapidus, Gail. 1985. “The Soviet Union.” In Women Workers in Fifteen Countries, ed. James Farley. Ithaca, NY: ILR Press.
Laird, Nan. 1978. “Nonparametric Maximum Likelihood Estimation of a Mixing Distribu-tion.” Journal of the American Statistical Association73(1978):805–11.
Lokshin, Michael. 1999. “Household Child Care Choices and Mother’s Labor Supply in Russia.” Dissertation, University of North Carolina at Chapel Hill, Chapel Hill. Lokshin, Michael, Kathy Harris, and Barry Popkin. 2000. “Single Mothers and Poverty in
Lokshin, Michael, and Barry Popkin. 1999. “The Emerging Underclass in the Russian Federa-tion: Income Dynamics 1992–1996.” Economic Development and Cultural Change
47(4):803–29.
Lokshin, Michael, and Monica Fong. 2000. “Child Care and Women’s Labor Force Participa-tion in Romania .” Washington, D.C.: World Bank Working Papers #2400, The World Bank.
Maassen Van Den Brink, Henriette, and Wim Groot. 1997. “A Household Production Model of Paid Labor, Household Work, and Child Care.” De Economist145(3): 325–43. Matthews, Mervyn. 1986. Poverty in Soviet Union. Cambridge: Cambridge University Press. Michalopoulos, Charles, Robins, Philip, and Irwin Garfinkel. 1992. “A Structural Model of
Labor Supply and Child Care Demand.” Journal of Human Resources27(1): 166–203. Micklewright, John. 2000. “Education, Inequality and Transition.” Florence: Innocenti
Work-ing Papers, Economic and Social Policy Series no.74, UNICEF Innocenti Research Centre. Mincer, Jacob, and Solomon Polachek. 1974. “Family Investment in Human Capital: Earnings
of Women.” Journal of Political Economy(Supplement) 82:S76–S108.
Mroz, Thomas. 1999. “Discrete Factor Approximations in Simultaneous Equation Models: Estimating the Impact of a Dummy Endogenous Variable on a Continuous Outcome.”
Journal of Econometrics92(2):233–74.
OECD. 1998. “Reviews of National Policies for Education: Russian Federation.” Paris, France: OECD Center for Co-operation with Nonmembers.
Ribar, David. 1995. “A Structural Model of Child Care and the Labor Supply of Married Women.” Journal of Labor Economics13(3):558–97.
——— . 1992. “Child Care and the Labor Supply of Married Women: Reduced Form Evidence.” Journal of Human Resources27(1):134–65.
Wong, Rebeca, and Ruth Levine. 1992. “The Effect of Household Structure on Women’s Economic Activity and Fertility: Evidence from Recent Mothers in Urban Mexico.”