Charles T. Clotfelter is Z. Smith Reynolds Professor of Public Policy and Professor of Economics and Law at Duke University. Helen F. Ladd is Edgar Thompson Distinguished Professor of Public Policy and Pro-fessor of Economics at Duke University. Jacob L. Vigdor is Daniel J. Evans ProPro-fessor of Public Affairs at the University of Washington. The authors gratefully acknowledge the support of the Institute for Education Sciences and American Institutes for Research through the Center for the Analysis of Longitudinal Data in Education Research. The authors thank seminar participants at Columbia, Notre Dame, the APPAM annual meeting, the CALDER annual research conference, the Federal Reserve Bank of New York, the University of Illinois- Chicago, and the Association for Education Finance and Policy annual meeting as well as Dan Goldhaber, Nora Gordon, Henry Levin, Gary Solon, and two anonymous referees for helpful comments. Kyle Ott, Alexandra Oprea and Maria Laurito provided outstanding research assistance. The data used in the article can be obtained beginning June 2015 through May 2018.
[Submitted August 2013; accepted February 2014]
ISSN 0022- 166X E- ISSN 1548- 8004 © 2015 by the Board of Regents of the University of Wisconsin System
T H E J O U R N A L O F H U M A N R E S O U R C E S • 50 • 1
Evidence from District Policy Initiatives
Charles T. Clotfelter
Helen F. Ladd
Jacob L. Vigdor
Clotfelter, Ladd, and Vigdorabstract
The proportion of students taking a fi rst algebra course in middle school has doubled over the past generation and there have been calls to make eighth grade algebra universal. We use signifi cant policy shifts in the timing of algebra in two large North Carolina districts to infer the impact of accelerated entry into algebra on student performance in math courses as students progress through high school. We fi nd no evidence of a positive mean impact of acceleration in any specifi cation and signifi cant negative effects on performance in both Algebra I and the traditional followup course, Geometry. Accelerating algebra to middle school appears benign or benefi cial for higher- performing students but unambiguously harmful to the lowest performers. We consider whether the effects refl ect the reliance on less- qualifi ed teachers and conclude that this mechanism explains only a small fraction of the result.
I. Introduction
In 2008, the California State Board of Education voted to require all students to enroll in algebra by eighth grade.1 This policy initiative, yet to be
Schwar-The Journal of Human Resources 160
mented, represents the culmination of a decades- long movement toward offering al-gebra instruction before the traditional high school years.2 Nationally, the proportion of eighth grade students enrolled in algebra doubled between 1988 and 2007 (Perie, Moran, and Lutkus 2005; Walston and McCarroll 2010), reaching rates over 50 per-cent in three states and the District of Columbia.3 The movement to offer algebra instruction before high school has been inspired in large part by correlational research documenting signifi cant differences in later- life outcomes between those students who enroll in algebra by eighth grade and those who do not.
Correlation need not imply causation, and it is unclear whether accelerated alge-bra enrollment—particularly when not accompanied by complementary curriculum reform in earlier grades—yields positive or negative effects (Loveless 2008). This paper provides a quasi- experimental estimate of the causal impact of accelerating the introduction of algebra coursework. We analyze policy initiatives introduced in two large North Carolina school districts in 2002–2003. These initiatives caused many students to take Algebra I earlier than they would have before the initiative, with the increase being especially abrupt for students in the middle deciles of the initial math achievement distribution. After maintaining the acceleration policy for two years, one district reversed course, reverting toward its previous placement pattern, whereas the other district persisted with acceleration.4 We use the across- cohort variation in place-ment patterns created by these abrupt shifts in policy to infer the impact of accelera-tion by comparing students with similar initial math achievement who were subjected to different placement policies solely on the basis of their year of birth. The analysis also incorporates, as an additional counterfactual, observations from four other large North Carolina school districts that exhibited no signifi cant changes in eighth grade Algebra I- taking rates across the cohorts of interest.
We assess the effect of accelerating students into Algebra I in eighth grade by look-ing at several kinds of outcomes, beginnlook-ing with standardized test scores on the state-wide end- of- course (EOC) test in Algebra I. We also consider whether students post passing scores on the state’s followup EOC tests in Geometry and Algebra II.5 These courses comprise a portion of the North Carolina State Board of Education’s minimum standards for a college- preparatory course of study.6 We also provide some basic de-scriptive evidence on the likelihood of progressing to a calculus course in high school,
zenegger referred to algebra as “the key that unlocks the world of science, innovation, engineering, and technology.” See “California to Require Algebra Taught in 8th Grade,” USA Today, July 11, 2008. In the early
2000s, the state led the nation with 59 percent of all eighth grade students enrolled in Algebra (Loveless 2008).
2. See, for example, Usiskin (1987), which cites Japan’s success in teaching algebra to seventh graders. In this paper, we use the term algebra to refer generically to a content area in mathematics and Algebra I to refer to the course traditionally taken at the beginning of a college- preparatory math sequence in North Carolina public schools. We similarly distinguish between Geometry courses and the content area known as geometry. 3. In 2007, early algebra- taking rates exceeded 50 percent in California, Maryland, Utah, and the District of Columbia (Loveless 2008).
4. As discussed below, the clear negative effects of acceleration may explain why the district reversed course. 5. The state mandates that at least of the course grade in one of these courses be based on the end- of- course score. See GreatSchools, “Testing in North Carolina,” http://www.greatschools.org/students/local- facts - resources/435- testing- in- NC.gs, 1/11/12.
the traditional culmination of a college- preparatory math course sequence beginning with Algebra I in eighth grade, and on the likelihood of repeating Algebra I.
We fi nd that acceleration initiatives lowered the Algebra I test scores of affected students. Our preferred estimates indicate that moderately performing students who were accelerated into Algebra I in eighth grade scored nearly half a standard devia-tion lower on the state end- of- course exam, compared to otherwise similar students that were not subjected to acceleration.7 Additional specifi cations consistently show signifi cant negative impacts of acceleration on the likelihood of receiving a passing grade on the state’s geometry exam, and at best no signifi cant impact on the likelihood of passing the state’s examination in Algebra II.
It is reasonable to expect the effect of early algebra instruction to be heterogeneous, with the least harmful effects—and quite possibly positive effects—on the students with the strongest prior math performance. We present evidence consistent with this hypothesis. Our results suggest that the school districts studied here would optimize math course performance by having no more than 40 percent of their eighth grade students take Algebra I.
Our fi ndings directly contradict prior correlational research, thereby casting doubt on the wisdom of teaching algebra to low- to- moderately performing students in eighth grade. We caution, however, that our results apply to the impact of changing the timing of the conventional fi rst course in algebra, holding math instruction in the early grades constant. It is quite possible that a more thoroughgoing reform of the math curriculum, by way of promoting readiness for algebra by eighth grade, could well prove benefi -cial.8 Our results should also not be taken as evidence that math coursework in general has no value. On the contrary, Goodman (2012) shows that requiring additional math courses as high school graduation requirements—without specifying the rigor of those courses—yields tangible returns to students.
II. Origins of the Algebra Acceleration Movement
As suggested by the brief history sketched above, accelerating alge-bra instruction into middle school has been promoted as a strategy for improving the mathematics achievement and college readiness of American high school students. Nationwide, the proportion of 13- year- olds enrolled in algebra courses has increased markedly, rising from 16 percent in 1988 to 29 percent in 2004 (Perie, Moran, and Lut-kus 2005). Among students in the nationally representative Early Childhood Longitu-dinal Survey Kindergarten cohort, just over one- third were enrolled in either algebra or a more advanced math course in 2006–2007 when most of the cohort was in eighth grade (Walston and McCarroll 2010). As noted above, there is signifi cant variation from this average across jurisdictions.This early algebra movement appears to have been bolstered in part by unwarranted causal inferences from correlational research. Eighth grade students enrolled in algebra
The Journal of Human Resources 162
consistently outscore their counterparts on eighth grade standardized math tests (Walston and McCarroll 2010). By the time they reach twelfth grade, early algebra- takers have completed more years of advanced math and attain higher scores on twelfth grade math assessments (Smith 1996). Other research has documented higher achievement outcomes among students who enroll in algebra at any point in their secondary school career (Dos-sey et al. 1988; Gamoran and Hannigan 2000). Ma (2005a, 2005b) reports that taking algebra in eighth grade is associated with the greatest improvement in math skills among the lowest- achieving students—particularly those below the sixty- fi fth percentile of the seventh grade math distribution. To date, no study has attempted to address concerns regarding selection into early algebra on the basis of unobserved characteristics.9
But there have been skeptics. Concerns about the reliability of previous studies have provoked something of a backlash against accelerating algebra into middle school. Opponents of accelerated algebra argue that too many students enter the course un-prepared for advanced work and may in fact fall behind their peers who had originally enrolled in less rigorous coursework. In a 2008 report, Loveless documents the poor math performance of some students enrolled in algebra by eighth grade, and it notes the inattention to the problem of possible selection bias in prior work justifying the push to offer algebra in middle school. The Loveless report itself, however, provides no evidence on the causal question of whether early placement in algebra promotes or retards mathematics achievement.10 The poorly performing students it cites may have performed just as badly in a more traditional eighth grade math course. An empirical assessment of the effects of accelerating the fi rst algebra course requires comparison with a counterfactual: otherwise identical students who take algebra on a traditional schedule. This is exactly the counterfactual provided by the rapid and uneven rollout of accelerated algebra in at least two of North Carolina’s largest school districts.
From an economic perspective, algebra skills can be valued for two basic reasons. First, algebra skills may contribute directly to labor productivity.11 Second, algebra skills might serve as inputs into the production of higher- order mathematical knowledge, which in turn may affect productivity. It is because of this second function that algebra is sometimes called a “gateway” to higher mathematics and STEM courses in general.
If students are expected to complete their human capital investment by a specifi c age, the case for accelerating entry into algebra is clear: Initiating algebra earlier al-lows more time for instruction in both algebra and higher- order topics, thereby unam-biguously increasing productivity. Things get more complicated when we introduce the possibility that both algebra and higher- order math skills rely on the degree to which students have mastered lower- order topics in mathematics. In this case, the question of optimal algebra timing means weighing the benefi ts of time to learn higher- order topics against the costs of insuffi cient mastery of pre- algebra concepts. The belief that students enter algebra too late is equivalent to an argument that too much time is devoted to lower- order subject matter.
9. Ma (2005b), for example, reports that only 4 percent of students below the sixty- fifth percentile of the seventh grade math distribution are placed in algebra by eighth grade.
10. Allensworth et al. (2009) provides evidence that a broad multisubject curricular reform emphasizing placement in college- preparatory coursework in Chicago high schools led to no significant improvement in test scores or college entry rates.
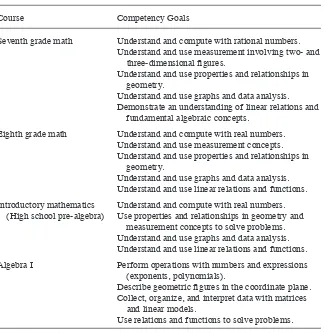
What kinds of topics are short changed when algebra is accelerated? To get an idea, Table 1 describes the key competencies that North Carolina’s standard course of study establishes for several pre- algebra courses, ranging from seventh grade Math to Introductory Math, the course prescribed for students who do not take Algebra I upon entry into high school.12
The similarity in course objectives across seventh and eighth grade math and the high school introductory math course suggests the possibility of diminishing returns in lower- order mathematics instruction. The objectives of eighth grade Math and In-troductory Math are nearly identical, suggesting that the high school course largely
12. These competencies form the basis for standardized End- of- Grade tests in mathematics conducted since the early 1990s.
Table 1
North Carolina Standard Course of Study Competency Goals (2003)
Course Competency Goals
Seventh grade math Understand and compute with rational numbers. Understand and use measurement involving two- and
three- dimensional fi gures.
Understand and use properties and relationships in geometry.
Understand and use graphs and data analysis. Demonstrate an understanding of linear relations and
fundamental algebraic concepts.
Eighth grade math Understand and compute with real numbers. Understand and use measurement concepts. Understand and use properties and relationships in
geometry.
Understand and use graphs and data analysis. Understand and use linear relations and functions.
Introductory mathematics (High school pre- algebra)
Understand and compute with real numbers. Use properties and relationships in geometry and
measurement concepts to solve problems. Understand and use graphs and data analysis. Understand and use linear relations and functions.
Algebra I Perform operations with numbers and expressions (exponents, polynomials).
Describe geometric fi gures in the coordinate plane. Collect, organize, and interpret data with matrices
and linear models.
Use relations and functions to solve problems.
The Journal of Human Resources 164
repeats subject matter for students who did not master it the fi rst time around. Further-more, the distinctions between seventh and eighth grade math objectives are minor: eighth graders, for example, are expected to perform computations with irrational numbers whereas in seventh grade computation with rational numbers is suffi cient.
Although a perusal of these stated objectives suggests that pre- algebra courses are incremental if not redundant, it is possible that many students need repeated exposure to this subject matter. It is interesting to note, furthermore, that each of the middle- grades math courses includes signifi cant attention to geometry. Computation of volume and surface area is a key component of the seventh grade curriculum, and the Pythagorean Theorem is mentioned specifi cally in the eighth grade curriculum. Both topics also appear in the high school Introductory Math course, and both relate directly to subjects covered in the state’s offi cial Geometry curriculum, which focuses in part on right triangles, problems involving surface area and volume, and elementary proof writing.
Algebra I acceleration is not the only curricular reform that has been introduced in hopes of improving mathematics achievement. California’s Math A and New York’s Stretch Regents curriculum exemplify reforms that target the quality of pre- algebra instruction rather than the timing of algebra course taking (White 1995; White et al. 1996; Gamoran et al. 1997).13 Although evidence on the effectiveness of these pro-grams is inconclusive (White et al. 1996; Gamoran et al. 1997), these alternatives may offer promising avenues to improve achievement in the event that accelerating algebra is judged not to be worth the cost of forgone pre- algebra instruction (Burris et al. 2006).
Although relevant to the question of optimal time allocation, the larger question of which math subjects have the strongest effects on productivity is beyond the scope of our empirical analysis. In one study pertinent to this issue, Rose and Betts (2004) ana-lyze transcript data from the High School and Beyond data set, using straightforward methods to address concerns about self- selection into higher- order courses. That study suggests that the labor market return to higher- order coursework is greater than the return to coursework at the level of introductory algebra or geometry.
III. Data and Methodology
A. Data and Sample Selection
Our data, derived from North Carolina Education Research Data Center longitudi-nal records, focus on students who entered seventh grade between 1999–2000 and 2004–2005 and spent the subsequent school year in Charlotte- Mecklenburg, Guilford, or an alternate “control” district (identifi ed in Section IIIC below).14 We restricted the sample to students with valid scores on the state’s standardized sixth and seventh grade mathematics assessment in order to stratify them by prior math performance. We then tracked students’ progress through college- preparatory math courses using the state’s end- of- course (EOC) examinations in Algebra I, Geometry, and Algebra II.
When using our preferred set of districts and all available cohorts, our sample includes 135,752 students.15
By design, the sample includes some individuals whom we never observe enrolling in Algebra I. This exclusion of nonalgebra takers from the analysis could potentially lead us to overstate the negative effects of the acceleration policy, to the extent that acceleration policies necessarily expand the overall pool of Algebra I takers. In such a scenario, marginally performing students would appear in the sample only in years when acceleration was in effect.16
Selection- correction models, which require the use of either functional form as-sumptions or a second set of instruments that predict course taking but otherwise do not infl uence outcomes, are sometimes employed in these circumstances.17 As an alternative, we redefi ne our outcome variables such that all students can be included, whether or not they enroll in a course. Specifi cally, in most of our regression models we analyze whether students attain a passing grade on a mathematics end- of- course test soon enough to keep them on track to complete Algebra II within six years of beginning seventh grade.18 Students who never take a course are coded as not hav-ing passed that course. Were the acceleration to be associated with negative selective attrition—a higher rate of exit for students predisposed to poor outcomes—this coding would address the associated bias.19
15. Some of the students included in our sample may have exited the data set because they left North Caro-lina public schools to attend a private or out- of- state school. If such students completed Geometry or Alge-bra II coursework, we incorrectly code them in our analysis. Due to differences in student ID coding, we are not always able to track students who transferred from CMS to a different district or to a charter school, which introduces further possibilities for miscoding. Moreover, given data limitations, it is impossible for us to distinguish a student who exits from one who persists without taking EOC exams. This poses a problem for our analysis only to the extent to which transfer behavior correlates with algebra acceleration, conditional on decile and cohort effects. If parents respond to the decline in mathematics performance associated with early algebra by switching to a different school district, we may in fact overstate the effects of acceleration. Note that we are similarly unable to identify students who drop out of school; since students cannot pass EOC exams after dropping out, however, they would not be miscoded.
16. Results obtained with a sample restricted to “ever- takers” confirm the existence of this bias (Clotfelter, Ladd, and Vigdor 2012a).
17. One might consider the algebra acceleration initiative itself to satisfy the exclusion restriction in a Heckman- style selection model. This would be appropriate only in the event that the acceleration influenced later course taking but was otherwise unrelated to outcomes. This runs contrary to the basic premise of this article. We are unable to identify any observable factor that influences whether a student takes a course that is otherwise unrelated to the student’s performance in that course.
18. Our definition of a passing grade on the Algebra I and Algebra II EOC tests is based on the proficiency standard in place for most of the years in our sample, which was roughly equal to the twentieth percentile of the statewide distribution for both tests. In 2007, the state adopted stricter grading standards on both EOC tests, placing the passing threshold closer to the fortieth percentile of the statewide distribution. By using a uniform standard based on a specific point in the distribution, we assume that there is no meaningful change in the statewide distribution of Algebra I or Algebra II test scores over time. As there is no substantial shift in standards on the Geometry EOC test, no comparable adjustment is necessary. In alternative specifications, we also analyzed the propensity to pass mathematics courses within a fixed number of years after first taking Algebra I. Results do not vary substantively across specifications.
The Journal of Human Resources 166
In some specifi cations examining the effect of acceleration on Algebra I test scores, we employ a second strategy for addressing sample selection concerns. Adopting a strategy used by Neal and Johnson (1996), we assume that students who never enroll in Algebra I would have received a test score that was below the median for the set of students with identical observable characteristics, and then estimate quantile regres-sion models.20 Provided that the imputed score is in fact below the median conditional on observables, arbitrarily changing the exact value of the imputed score does not infl uence the estimation.
B. Description of the Policy Initiatives
In the Fall of 2002, two of the three largest school districts in North Carolina adopted unusually aggressive policies to accelerate placement of middle and high school stu-dents into Algebra I. The districts, Charlotte- Mecklenburg Schools (hereafter, CMS) and Guilford County Public Schools (encompassing the cities of Greensboro and High Point), were led by strong superintendents who championed a policy of increasing the number of eighth graders taking Algebra I. The superintendent of CMS strongly believed as a matter of pedagogy that algebra should be offered to many, if not most, students in middle school, rather than waiting until they are in high school. Later described as “a bear on getting middle school kids in eighth grade to learn Algebra I,” this superintendent announced at the beginning of the 2001–2002 year that his goal would be to increase to 60 percent the portion of students in the district who were profi cient in Algebra I by the end of eighth grade, as indicated by scoring at Level 3 or above on the state’s end- of- course test.21 In Guilford, a new superintendent began his tenure in May 2000 forcefully advocating a policy of enrolling as many eighth graders as possible in Algebra I.22 These superintendents not only broke from past patterns of course taking but also diverged signifi cantly from policies followed by most other dis-tricts in North Carolina. To be sure, there was widespread interest in education circles at this time in the idea of accelerating the teaching of algebra, as noted in Section II above. Adding additional impetus, the state of North Carolina had increased from
suggesting that any impact of the policy—or other contemporaneous factors—on attrition is likely to be small. Further analysis shows a similar lack of trend in attrition conditional on prior performance.
20. Specifically, we impute standardized test scores of –4 for non- test takers. This procedure may yield bi-ased results to the extent that some students without test scores have omitted data for reasons other than failure to take the course, for example, transfer into a private school. For this reason, we also report the results of specifications using more basic OLS and 2SLS models below.
21. Educate!, September 16, 2001, p. 5. As evidence of the superintendent’s focus on increasing the number of middle school students taking algebra, one informant described how he ordered middle school principals to overhaul schedules after the school year had commenced in order to increase the number of middle school students in algebra classes. In an interview after he stepped down as CMS superintendent, Eric Smith stated, “The middle school math piece was the gatekeeper and it is the gatekeeper. It’s the definition of what the rest of the child’s life is going to look like academically, not just through high school but into college and beyond. If they make it into algebra one, the likelihood of getting into the AP class and being successful on the SAT and having a vision of going on to college is dramatically enhanced. And so our pressure to make sure that kids were given that kind of access to upper level math in middle school was a critical component of our overall district strategy.”
21. http://www.pbs.org/makingschoolswork/dwr/nc/smith.html, 4/5/11.
three to four the number of math courses required for admission to the University of North Carolina system.
Table 2a documents the impact of these policy initiatives, using longitudinal data for students entering seventh grade between 1999–2000 and 2004–2005.23 We track each of these six cohorts of students forward in time, even in situations where students were retained in grade, dividing the cohorts into three groups. The fi rst group, the “pre- acceleration” cohorts, under normal grade progression would have entered eighth grade prior to the 2002–2003 school year. The second group is the “post I” cohorts, which entered eighth grade when both CMS and Guilford were at the peak of their acceleration programs. Finally, the “post II” cohorts entered at a time when CMS was retrenching but Guilford was not. As shown in the table’s fi rst two rows, a student’s likelihood of enrolling in Algebra I by eighth grade jumped by 23 percentage points in CMS and 43 percentage points in Guilford between the “pre” and “post I” cohorts. The “post II” cohorts in CMS occupied an intermediate position, whereas in Guilford they continued to take Algebra I by eighth grade at a rate exceeding 75 percent.24
Several other policy changes transpired in CMS during the period of our study. In 2002, the district ceased busing students to desegregate schools and implemented a public school choice plan, incorporating a lottery system for oversubscribed schools (Hastings, Kane, and Staiger 2005, 2006a, 2006b; Hastings et al. 2007; Deming et al. 2011; Vigdor 2011). These changes may have led to systematic declines in instruc-tional quality for African- American and other disadvantaged students (Jackson 2009) that may have confounded the effects of accelerating algebra in CMS. We know of no similar potentially confounding policy shifts occurring in Guilford County at this time. To account for the possibility of such confounding changes, we present specifi cations that alternately exclude CMS and Guilford from the sample.
C. Identifying “Control” Districts
The most basic means of testing whether the CMS and Guilford accelerations affected student outcomes would be to compare average outcomes across cohorts. This basic strategy exposes us to the risk of confl ating the effects of early algebra with any other simultaneous across- cohort trend, including shifts attributable to demographic change, alterations in the diffi culty of end- of- course exams, or other education policy changes affecting students. To address at least some of these concerns, we introduce data on students in a comparison set of districts that exhibited no signifi cant shifts in Algebra I placement policy across the three groups of cohorts examined here.
Table 2b provides data on the probability of enrolling in Algebra I by eighth grade for cohorts in the eight largest North Carolina school districts besides CMS and
Guil-23. These data are provided by the North Carolina Education Research Data Center. Note that in order to define outcome variables for these students we need to be able to trace them up to six years after entering seventh grade. The 1999–2000 cohort in Charlotte- Mecklenburg is omitted from this study because of prob-lems with the unique identifiers in that district in the base year.
T
Probability of Completing Algebra I by Eighth Grade, Other Large Districts
District
p- value for Test of Equality Across Three Periods
Group 1: Districts exhibiting no signifi cant variation across time periods
Wake 30.47 30.36 29.91 0.56 0.554
Union 22.92 23.78 22.18 1.6 0.268
Johnston 24.18 24.24 24.96 0.78 0.712
Gaston 15.77 15.78 16.40 0.63 0.646
Group 2: Districts exhibiting statistically signifi cant variation across time periods
Cumberland 14.08 10.92 17.82 6.9 < 0.001
Forsyth 37.21 31.03 32.30 6.18 < 0.001
Durham 24.49 19.11 23.51 5.38 < 0.001
Cabarrus 14.51 16.92 17.23 2.72 < 0.001
Notes: The “Pre” cohorts consist of students entering seventh grade for the fi rst time in 1999–2000 or 2000–2001. The “Post I” cohorts entered seventh grade in 2001–2002 or 2002–2003. The “Post II” cohorts entered seventh grade in 2003–2004 or 2004–2005. Reported p- values are derived from χ2 tests.
Table 2a
Probability of Completing Algebra I by Eighth Grade, Districts of Interest
District
p- value for Test of Equality Across Three Periods
Charlotte- Mecklenburg 45.23 68.03 54.93 22.8 < 0.001
Guilford 34.70 77.81 76.50 43.11 < 0.001
ford. These potential “control” districts are divided into two categories. The fi rst cat-egory consists of districts where the likelihood of Algebra I enrollment by eighth grade does not vary signifi cantly across the pre, post I, and post II periods, as determined by a chi- squared test. In each of these districts, the observed range of eighth grade Algebra I placement rates is no greater than 1.6 percentage points, more than an order of magnitude smaller than the observed range in CMS and Guilford. This group of districts includes Wake County, which at the time was the state’s second largest district after CMS, as well as the more suburban districts of Union, Johnston, and Gaston counties. Although Algebra I placement rates were stable in these counties, it should also be noted that they also tended to be lower than those in CMS and Guilford at baseline.
The second category of potential comparison counties exhibits statistically sig-nifi cant variation in eighth grade Algebra I placement rates across cohort catego-ries. As the goal of introducing counterfactual districts is to infer the trends in outcomes that would have transpired in the absence of an Algebra I policy change, we exclude these districts from most of the analysis. We note that in three of four cases the trend in Algebra I placement rates is opposite of that observed in CMS and Guilford—a decline from the “pre” period to “post I.” Moreover, in all cases the observed variation in eighth grade Algebra placement rates is less than one- third that observed in CMS and less than one- sixth the magnitude in Guilford. This assuages concerns that the Algebra I acceleration might have been prompted by a statewide initiative.
D. Overview of the Analysis
Using a sample consisting of CMS, Guilford, and the four “control” districts lacking signifi cant variation in Algebra I placement rates, we present three distinct sets of regression estimates. The fi rst set consists of basic OLS regressions akin to the corre-lational models found in prior studies. These regressions use individual- level variation in the timing of Algebra I coursework to estimate the partial correlation between early algebra and subsequent outcomes, conditional on prior math test score performance, cohort, and district fi xed effects. These estimates are not intended to represent causal estimates but rather to establish that we can replicate fi ndings in the earlier literature and to provide context for our subsequent results.
The second set of estimates are reduced- form difference- in- difference models where the independent variables of interest are not controls for when a student took Algebra I but rather a set of district- time period interactions that reveal whether student outcomes changed signifi cantly once districts implemented an acceleration policy. These estimates can be thought of as “intent- to- treat” effects under certain assumptions. These models also control for prior student test performance, district, and time period effects.
The Journal of Human Resources 170
E. Benchmark Estimates of the Partial Correlation Between Early Algebra and Later Outcomes
Table 3 presents estimates from simple OLS regressions examining the basic relation-ship between Algebra I timing and the four outcomes, using data on the set of six districts identifi ed above. These estimates should by no means be interpreted as causal effects, even though they include indicators that restrict comparison to students ranked in the same decile by average sixth and seventh grade math score. Even conditional on decile, earlier assignment to algebra in the cross- section is likely to be correlated with unobserved determinants of math achievement. Note also that we make no effort here to impute test scores for students who never take Algebra I, leading to a second source of bias in the estimates.25
Consistent with earlier studies, our OLS specifi cations associate placement in Al-gebra I by eighth grade with better outcomes in subsequent years. Although students who complete Algebra I by eighth grade receive lower scores on the standardized test in that subject, they are signifi cantly more likely to attain passing scores on both Algebra I and higher- level math exams on a college- preparatory schedule. The prob-ability of passing Algebra II, equal to about 50 percent in our entire sample, is nine percentage points higher among students who complete Algebra I by eighth grade, conditional on the average sixth/seventh grade math test decile. Interpreted naively, the apparent advantage associated with early access to algebra is equivalent to the predicted impact of raising a student’s average sixth/seventh grade math test score by a full decile in the distribution. To reiterate our previous argument, however, these OLS estimates, like some prior estimates in the literature, are very likely to be contaminated by selection bias.
IV. Difference- in- Difference Results
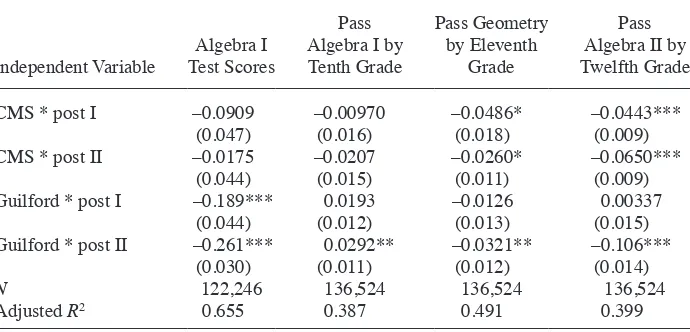
Table 4 presents a set of reduced- form difference- in- difference esti-mates comparing outcomes before and after the onset of Algebra I acceleration, using data on students in CMS, Guilford, and the “Group 1” comparison districts identifi ed in Table 2b, which show no signifi cant change in eighth grade algebra placement rates across time periods. The regression models underlying these results control for period effects, district effects, and the student covariates included in the Table 3 specifi ca-tions. These estimates can be interpreted as the “intent to treat” effects of the accelera-tion initiatives in each district in each time period.
Across the 16 effect estimates reproduced here, there is only one coeffi cient sug-gesting that accelerated students enjoyed a statistically signifi cant advantage over their counterparts: The rate of passing Algebra I by tenth grade among Guilford students in the post II cohort is roughly three percentage points higher than in the pre- acceleration
Cl
ot
fe
lte
r, L
add, a
nd
V
igdor
171
Independent Variable
Algebra I Test Scores
Pass Algebra I by Tenth Grade
Pass Geometry by Eleventh Grade
Pass Algebra II by Twelfth Grade
Enrolled in Algebra I by eighth grade
–0.0965*** 0.130*** 0.0488*** 0.0915***
(0.017) (0.008) (0.007) (0.008)
Year entered seventh grade (2000 omitted)
2001 0.0141* –0.0351*** 0.0538*** 0.138***
(0.006) (0.002) (0.002) (0.003)
2002 0.102*** –0.0106*** 0.0269*** 0.0585***
(0.004) (0.002) (0.002) (0.001)
2003 –0.0624*** –0.0567*** 0.0402*** 0.00802***
(0.005) (0.002) (0.002) (0.001)
2004 –0.0783*** –0.0782*** 0.00530* –0.0170***
(0.005) (0.002) (0.002) (0.001)
2005 0.0486*** –0.164*** 0.0440*** 0.0238***
(0.004) (0.002) (0.002) (0.002)
N 122,246 136,524 136,524 136,524
Adjusted R2 0.656 0.443 0.493 0.405
Notes: Standard errors, corrected for clustering at the sixth / seventh grade math decile- cohort- district level, in parentheses. Algebra I test score is taken from the student’s fi rst test administration. Course passage for Algebra I and Algebra II is defi ned as obtaining a standardized test score at or above the twentieth percentile of the statewide distribu-tion. Course passage for Geometry is defi ned as obtaining an achievement level at or above 3 on the test. Grade- retained students are kept with their original cohort. District and decile fi xed effects included but coeffi cients are not shown in this table. Sample includes CMS, Guilford, and the Group 1 districts identifi ed in Table 2b.
The Journal of Human Resources 172
cohort, other things equal. By contrast, eight estimates of 16 are statistically signifi cant and negative. The signifi cant postacceleration decline in Algebra I EOC tests in Guil-ford is perhaps not surprising, as the OLS estimate in Table 3 is similarly negative. The statistically signifi cant declines in the probability of passing Geometry and Algebra II, apparent in six of eight cases, directly contradict the evidence in Table 3. The juxtapo-sition of signifi cant negative effects on test score outcomes and a signifi cant positive impact on the probability of passing Algebra I by tenth grade—the case of Guilford students in the “Post II” period—can be explained by course retaking behavior, a pat-tern we examine in more detail below.
In summary, the reduced- form difference- in- difference evidence fails to confi rm the positive correlation between early algebra and subsequent course performance seen in the OLS equation. The preponderance of the evidence points to negative, rather than positive, effects of early algebra on test scores or performance in subsequent coursework.
One possible concern with our reduced- form strategy relates to peer effects. A stan-dard assumption of “intent- to- treat” style analysis is that “always- taking” students— those whose probability of taking Algebra I in eighth grade is high across all time periods in this context—should post the same outcome regardless of whether they are assigned to a “treated” or “control” group. In this case, “always- taking” students in a given decile- cohort may be adversely affected by the presence of lower- performing Table 4
CMS * post I –0.0909 –0.00970 –0.0486* –0.0443***
(0.047) (0.016) (0.018) (0.009)
CMS * post II –0.0175 –0.0207 –0.0260* –0.0650***
(0.044) (0.015) (0.011) (0.009)
Guilford * post I –0.189*** 0.0193 –0.0126 0.00337
(0.044) (0.012) (0.013) (0.015)
Guilford * post II –0.261*** 0.0292** –0.0321** –0.106***
(0.030) (0.011) (0.012) (0.014)
N 122,246 136,524 136,524 136,524
Adjusted R2 0.655 0.387 0.491 0.399
Notes: Standard errors, corrected for clustering at the cohort- district level, in parentheses. Algebra I test score is taken from the student’s fi rst test administration. Course passage for Algebra I and Algebra II is defi ned as obtaining a standardized test score at or above the twentieth percentile of the statewide distribution. Course passage for Geometry is defi ned as obtaining an achievement level at or above 3 on the test. Grade- retained students are kept with their original cohort. Specifi cations control for period effects, district effects, student race, gender, and free / reduced lunch status, and a set of indicators for average sixth and seventh grade math test score decile. Sample includes Group 1 and 2 districts identifi ed in Table 2.
peers in their classroom (Nomi 2012).26 To the extent that these peer effects matter, our reduced- form estimates of the impact of acceleration may combine negative effects on always- takers with more modest, or perhaps even positive, effects on “compliers”— those students who take Algebra I early only when a district is engaged in accelera-tion. We investigate this possibility in our instrumental variables analysis below, and fi nd evidence inconsistent with this interpretation—acceleration tends to be associated with more negative effects among students with low, rather than high, prior achieve-ment.
V. Instrumental Variable Estimates Incorporating
Variation in “Dosage”
A. Description of Methodology
The reduced form strategy described above yields straightforward, easily interpreted, “intent- to- treat” (ITT) type effects of the policy intervention on outcomes. By its nature, however, it is not appropriate for identifying “treatment on the treated” (TOT) effects, which in this context are interpreted as the effect of acceleration on the aver-age student subjected to it. One simple approach to converting the ITT effects to TOT effects would scale them by the difference in observed probability of taking Algebra I across groups. We extend this simple strategy in two respects. First, we stratify stu-dents into individual cohorts rather than three time periods. Second, we make use of the fact that students with differing levels of prior performance in mathematics courses were subjected to widely differing changes in the likelihood of taking Algebra I by eighth grade.
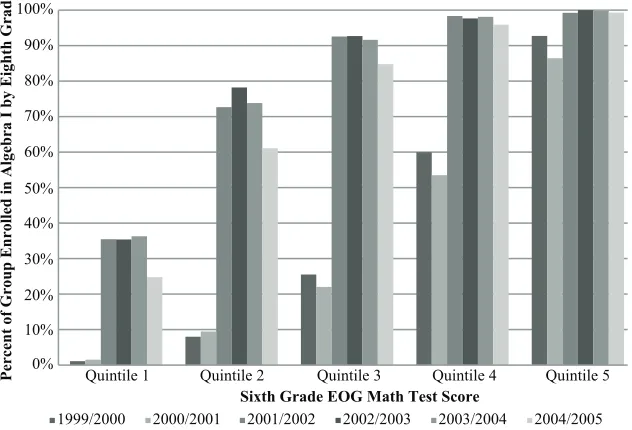
Figures 1 and 2 provide greater detail on how the probability of taking Algebra I by eighth grade varied by both specifi c cohort and prior mathematics achievement level.27 Students are strati
fi ed by cohort—defi ned as the year they fi rst enrolled in sev-enth grade—and by average performance on the sixth and sevsev-enth grade end- of- grade standardized math tests. Each bar in the graph represents a rate of taking Algebra I by eighth grade for a cohort/quintile cell. We stratify students by test score quintiles for purposes of this graph; in regression analyses below, we more fi nely stratify students by decile. Cohorts are denoted by the year their members became seventh graders for the fi rst time. Thus it was students in the 2001–2002 cohort who fi rst experienced the accelerated timetable for Algebra I introduced by CMS and Guilford in the fall of 2002.
As seen in both fi gures, baseline rates of algebra- taking by eighth grade were high in both districts relative to the national average for high- performing students, but low for low- performing students. In the fi rst studied cohorts, 97 percent of CMS students in the top quintile of the statewide sixth grade math score distribution were enrolled in Algebra I by eighth grade, as were 93 percent of Guilford’s high- scoring students, compared to 75 percent of top quintile eighth graders nationwide, as recorded in the
26. Note that adverse impacts on students in higher- performing deciles—the effects studied by Nomi (2010)—would be less of a concern here.
The Journal of Human Resources
Quintile 1 Quintile 2 Quintile 3 Quintile 4 Quintile 5
P
Probability of taking Algebra I by eighth grade, by sixth grade math test score quin-tile and year entering seventh grade, Charlotte- Mecklenburg Schools
1999/2000 2000/2001 2001/2002 2002/2003 2003/2004 2004/2005
Quintile 1 Quintile 2 Quintile 3 Quintile 4 Quintile 5
P
2009 NAEP assessment (Walston and McCarroll 2010). By contrast, only 3 percent of CMS students, and 1 percent of Guilford students, in the lowest sixth grade math quintile had enrolled in Algebra I by eighth grade, compared to 13 percent in the na-tional NAEP data.
Figures 1 and 2 make clear that the acceleration documented in Table 1 above was concentrated in the mid- to- lower portion of the prior achievement distribution. For students around the median in CMS, the likelihood of taking Algebra I by eighth grade increased from 51 percent to 85 percent. For students in the second- lowest quintile, the rate increased from 18 percent to 63 percent. Even in the lowest quintile of the sixth grade math distribution, the rate of Algebra I taking rose to 15 percent.28 Guil-ford’s acceleration was even more rapid than that in CMS. Lowest- quintile students in the 2004 cohort were placed in Algebra I in eighth grade at a rate of 36 percent, twice the maximum rate observed for that quintile in CMS. Rates of Algebra I placement by eighth grade peaked at 78 percent in the next- lowest quintile, and in the middle quintile exceeded 90 percent.
In our instrumental variable specifi cation, the fi rst stage equation takes the form: (1) Tildc = ϕl + ϕdc + ρXildc + δldc + ηildc
where Tildc is an indicator for whether the student i belonging to cohort c and decile
d in district l received the treatment—in this case, taking Algebra I by eighth grade, ϕl and ϕdc are district and cohort- by- decile fi xed effects, Xildc represents a vector of student- specifi c characteristics, the δldc term represents a set of fi xed effects for the district/cohort/decile cells subjected to acceleration, observable in Figures 1 and 2, and ηildc is an error term.29 These district- by- cohort- by- decile
fi xed effects serve as the instruments for purposes of identifi cation. Predicted values derived from Equation 1 are then used in place of actual treatment status in the second- stage equation:
(2) yildc = αl + αdc + βXildc + γTildc + εildc
where yildc is the outcome of interest, αl is a district fi xed effect, and αdc represents a set of cohort- by- decile fi xed effects, and εildc is a second error term. Decile- by- cohort fi xed effects account for any curricular or test change that would infl uence all students in a given prior achievement decile in a cohort across the state such as the introduction of a more diffi cult passing standard that might alter outcomes for moderately perform-ing students but not those at either end of the distribution. The use of decile effects rather than a linear control for test score also allows us to account for potentially nonlinear effects of initial achievement on later outcomes.
The identifying assumption is that students in the accelerated cohort- decile
The Journal of Human Resources 176
cells in CMS and Guilford differ—relative to their counterparts in the same dis-trict, and relative to counterparts in the same decile- by- cohort cell in the other four Group 1 districts identifi ed in Table 2b—only in their likelihood of taking Alge-bra I in eighth grade. Because the identifying variation in AlgeAlge-bra I timing is at the cohort- by- decile- by- district level, we cluster standard errors at that level.
Estimated treatment effects are “local” to that set of students subjected to differing treatment status across cohorts in CMS and Guilford, drawn primarily from the mid- to- lower portion of the prior test score distribution. Below, we report the results of specifi cations that permit the effect of Algebra I acceleration to vary by initial test score quintile within the set of quintiles exhibiting policy variation in CMS and Guilford.
For ease of interpretation, we report the results of two- stage least squares models when analyzing course passing outcomes.30 When evaluating Algebra I test scores, we estimate models based on the Chernozhukov and Hansen (2007) Instrumental Variable Quantile Regression (IVQR) estimator, using the Neal and Johnson (1997) imputation strategy described above to address concerns regarding selection into the sample of test takers.
B. Treatment- on- the- Treated IV Estimates
Table 5 shows instrumental variable estimates of the impact of taking Algebra I by eighth grade.31 These estimates include IVQR estimates, with imputed test scores for nonalgebra takers, for models analyzing variation in test scores and two- stage least squares for the three binary outcomes. Each model controls for combined sixth/ seventh grade test score decile and cohort fi xed effects, district fi xed effects, and cohort- by- decile fi xed effects. The instruments excluded from the second stage sepa-rately identify the district and cohort cells in CMS and Guilford that were subjected to signifi cant increases in the likelihood of taking Algebra I in eighth grade, as indicated in Figures 1 and 2. First stage results uniformly indicate a suffi cient amount of varia-tion to assuage potential concerns about weak instruments.
The results generally support the basic difference- in- difference analysis. The TOT effects are generally larger in magnitude than the associated ITT effects in Table 4, consistent with the notion that the acceleration affected less than a quarter of all stu-dents in CMS and less than half in Guilford. Accelerated stustu-dents score 45 percent of a standard deviation lower on their Algebra I end- of- course tests.32 They are about
fi ve percentage points more likely to pass the course by the time they complete tenth grade—once again, a seeming contradiction explained by course- retaking patterns. Two- stage least squares estimates indicate that accelerated students are signifi cantly
30. Clotfelter, Ladd, and Vigdor (2012a; 2012b) shows that bivariate probit versions of models with binary outcomes tend to generate qualitatively and quantitatively similar results.
31. Technically, the dependent variable measures whether a student has taken the Algebra I EOC exam within two years after beginning seventh grade.
Cl
ot
fe
lte
r, L
add, a
nd
V
igdor
177
Independent Variable
Algebra I Test Scores (IVQR)
Pass Algebra I by Tenth Grade
Pass Geometry by Eleventh Grade
Pass Algebra II by Twelfth Grade
Enrolled in Algebra I by eighth grade
–0.451*** 0.0534** –0.108*** –0.0330
(0.009) (0.016) (0.013) (0.021)
Male –0.110*** –0.0357*** –0.0192*** –0.0520***
(0.0025) (0.005) (0.003) (0.006)
African- American 0.0062 0.00955* –0.0132*** 0.0317***
(0.003) (0.004) (0.003) (0.005)
Hispanic 0.0277*** 0.0146** 0.00116 0.0289***
(0.006) (0.005) (0.006) (0.006)
Other race 0.128*** 0.0146** 0.0280*** 0.0436***
(0.006) (0.006) (0.007) (0.010)
Free / reduced lunch –0.196*** –0.0570*** –0.0782*** –0.0994***
(0.003) (0.006) (0.006) (0.007)
N 135,752 135,752 135,752 135,752
Adjusted R2 — 0.485 0.526 0.439
Notes: Standard errors, corrected for clustering at the decile- cohort- district level, in parentheses. Estimation is by two- stage least squares except as indicated. Algebra I test score is taken from the student’s fi rst test administration. Course passage for Algebra I and Algebra II is defi ned as obtaining a standardized test score at or above the twentieth percentile of the statewide distribution. Course passage for Geometry is defi ned as obtaining an achievement level at or above 3 on the test. Grade- retained students are kept with their original cohort. District, decile, cohort, and decile- by- cohort fi xed effects included but coeffi cients are not shown in this table. Sample consists of CMS, Guilford, and the Group 1 districts identifi ed in Table 2b.
The Journal of Human Resources 178
less likely—by 11 percentage points—to pass the Geometry EOC exam by eleventh grade, and point estimates suggest a negative impact on the likelihood of passing Algebra II as well.
Table 5 also reports coeffi cients on the student- level covariates included in the model—with the exception of test score decile indicators, which reveal a predictable pattern that students with higher prior test scores tend to attain better outcomes. Male students tend to have worse outcomes than female students conditional on covari-ates. Black and Hispanic students, perhaps surprisingly, have better chances of passing Algebra I and Algebra II conditional on covariates including past test scores, though black students are slightly less likely to pass Geometry. Students receiving free or reduced price lunch receive lower scores on end- of- course Algebra I tests and are less likely to pass the college preparatory coursework, other things equal.
C. Robustness Checks
Table 6 shows the results of several perturbations to the basic model, alternately delet-ing or adddelet-ing districts to the set used to identify the effects of interest. Each entry in the table represents a different instrumental variables specifi cation, with the test score specifi cations estimated by the IVQR procedure described above.
The fi rst row repeats the basic Table 5 results. The next two are identical to the basic model but omit CMS and Guilford in sequence. As noted previously, Charlotte- Mecklenburg Schools embarked on a series of policy shifts around the same time it implemented its algebra acceleration initiative. To address concerns that these other shifts may have had effects that confound the effect of interest, the second row of Table 6 uses a sample that omits CMS entirely, identifying effects solely on the basis of policy variation in Guilford County. The results are generally similar to those ob-tained with the full sample. The estimated impact of acceleration on test scores is sub-stantially more negative in this sample. Across the three regressions examining course passage the estimates, while attenuated, retain statistical signifi cance where it existed in the fi rst place. The basic conclusion—that acceleration produced signifi cantly lower test score outcomes and had a signifi cant negative impact on the likelihood of passing geometry—remains intact.
Row 3, in which we return CMS to the sample and remove Guilford County, offers an opportunity to assess whether the negative effects of acceleration can be attributed to transition costs. The transition cost hypothesis generates the prediction that CMS- based estimates would be more negative than Guilford- based ones because CMS reversed itself on acceleration almost immediately, offering no chance to observe ac-celeration in “steady- state.”
Cl
ot
fe
lte
r, L
add, a
nd
V
igdor
179
Modifi cation Relative to Table 4
Algebra I Test Scores (IVQR)
Pass Algebra I by Tenth Grade
Pass Geometry by Eleventh Grade
Pass Algebra II by Twelfth Grade
Original results (n = 135,752) –0.451*** 0.0534** –0.108*** –0.0330
(0.009) (0.016) (0.013) (0.021)
Omit Charlotte- Mecklenburg (n = 99,808) –0.594*** 0.0391** –0.0487*** –0.0116
(0.046) (0.015) (0.014) (0.035)
Omit Guilford (n = 109,857) –0.373*** 0.0326 –0.157*** –0.0313
(0.010) (0.020) (0.020) (0.018)
Notes: Standard errors, corrected for clustering at the decile- cohort- district level, in parentheses. Estimation is by two- stage least squares except as indicated. Algebra I test score is taken from the student’s fi rst test administration. Course passage for Algebra I and Algebra II is defi ned as obtaining a standardized test score at or above the twentieth percentile of the statewide distribution. Course passage for Geometry is defi ned as obtaining an achievement level at or above three on the test. Grade- retained students are kept with their original cohort. District, decile, and cohort and fi xed effects included but coeffi cients are not shown in this table. Decile- by- cohort effects also included in the
fi rst two models.
The Journal of Human Resources 180
D. Effect Heterogeneity
The effects estimated in our main analysis are local to the set of moderate- to- low performing students actually subjected to policy variation in CMS and Guilford. It is reasonable to think that the treatment effects of accelerating algebra instruction would be more benign for higher- performing students and possibly more detrimental for students at the bottom of the achievement distribution. Table 7 presents estimates from instrumental variables specifi cations that permit the effect of eighth grade algebra enrollment to differ among students by quintile of the sixth/seventh grade math test distribution.33 Note that the quantile regression strategy is implemented in this case with a reduced- form model (RFQR) rather than a two- stage model owing to technical diffi culties associated with using a large set of instruments (Chernozhukov and Hansen 2005).
The results are consistent with the basic prediction of more modest impacts on higher- performing students in some cases, but in others a more nuanced pattern ap-pears. When estimated by 2SLS the Algebra I test score specifi cation suggests that the negative impact of acceleration on test scores is 50 percent larger for students below the fortieth percentile than those above the sixtieth. Estimation using test score imputations for nontakers and RFQR indicate, however, that the strong negative coef-fi cient in the lowest quintile is attributable in large part to the impact of acceleration on selection into the sample. There is a negative impact of acceleration for the lowest quintile in the RFQR specifi cation, but it is modest compared to effects estimated in higher quintiles. This pattern may refl ect “fl oor effects” in that it may be diffi cult for the lowest- performing students to score worse than they do at baseline. It is note-worthy that the 2SLS and RFQR specifi cations produce comparable results in higher quintiles as would be expected in the absence of signifi cant sample selection problems.
The positive effect of acceleration on the probability of receiving a passing score on the Algebra I EOC exam is much stronger in the lowest decile than it is in other de-ciles. This fi nding may refl ect the fact that an extra opportunity to take the course may maximize the lifetime chances of passing the course for those least likely to pass the course at baseline. The estimated impact of acceleration on Geometry performance is estimated to be 50 percent more negative for low performers relative to above- average performers. Finally, the point estimates in the Algebra II specifi cation, while not statis-tically signifi cant, also show the most negative effects among the lowest- performing students.
As there is no signifi cant policy- induced variation in the top quintile, we are unable to directly assess the impact of acceleration in that subset of students. Moreover, our coarse quintile analysis may obscure more fi ne- grained differences in the effect of ac-celeration within the next- highest quartile. As a conservative statement, these results caution that statistically signifi cant harmful effects of acceleration extend to at least the sixtieth percentile of the initial math achievement distribution.
Cl
ot
fe
lte
r, L
add, a
nd
V
igdor
181
Independent Variable
Algebra I Test Score
Pass Algebra I by Tenth Grade
2SLS
Pass Geometry by Eleventh Grade
2SLS
Pass Algebra II by Twelfth Grade
2SLS 2SLS
RFQR with Imputation
Quintile 1 student * enrolled in Algebra I by eighth grade
–0.425*** –0.167*** 0.196*** –0.128*** –0.0527
(0.101) (0.039) (0.030) (0.038) (0.089)
Quintile 2 student * enrolled in Algebra I by eighth grade
–0.428*** –0.436*** 0.0192 –0.105*** –0.0198
(0.033) (0.014) (0.029) (0.012) (0.028)
Quintile 3 student * enrolled in Algebra I by eighth grade
–0.343*** –0.382*** 0.00780 –0.123*** –0.0388
(0.040) (0.011) (0.011) (0.013) (0.036)
Quintile 4 student * enrolled in Algebra I by eighth grade
–0.282*** –0.305*** 0.0400*** –0.0774*** –0.0331
(0.041) (0.011) (0.012) (0.014) (0.021)
N 121,572 135,752 135,752 135,752 135,752
Adjusted R2 0.696 0.354 0.429 0.530 0.440
Notes: Standard errors, corrected for clustering at the decile- cohort- district level, in parentheses. Algebra I test score is taken from the student’s fi rst test administration. Course passage for Algebra I and Algebra II is defi ned as obtaining a standardized test score at or above the twentieth percentile of the statewide distribution. Course passage for Geometry is defi ned as obtaining an achievement level at or above 3 on the test. Grade- retained students are kept with their original cohort. All models control for average sixth and seventh grade math test score decile, cohort and district fi xed effects, and instrument for Algebra I enrollment by eighth grade using an indicator representing the probability of taking Algebra I by eighth grade within your decile- cohort- district cell. Columns headed “2SLS” are estimated by two- stage least squares. Column headed “RFQR with Imputation” applies the Neal and Johnson (1996) method of imputing poor performance for 14,180 non- Algebra I- takers and estimating using the Chernozhukov and Hansen (2005) method.
The Journal of Human Resources 182
E. Bounding Heterogeneous Effects on Other Outcomes
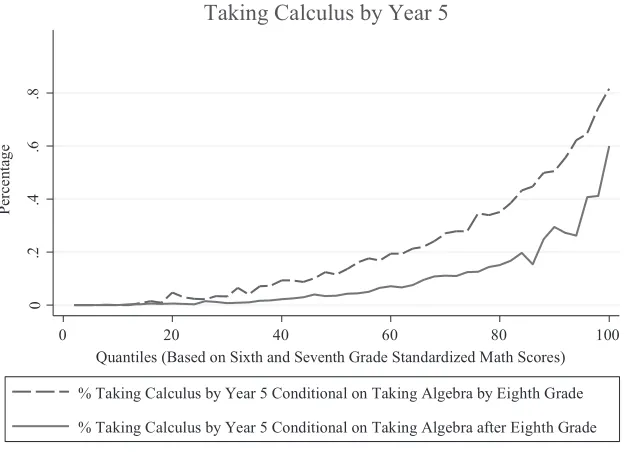
In the face of the evidence presented above, one might continue to advocate for ac-celerating algebra coursework on the grounds that it creates opportunities for some students to pursue higher- level coursework, such as calculus, in high school. Unfor-tunately it is diffi cult to use the CMS and Guilford policy interventions to assess this hypothesis for two reasons. First, as noted above the interventions applied mostly to moderately performing students, not the high performers who presumably stand to benefi t the most from the opportunity to enroll in calculus. Second, we are not able to track calculus enrollment or performance using our primary database of end- of- course test scores because North Carolina does not administer such tests in calculus. For some cohorts, however, we have access to complete high school transcript data that permits a more limited investigation of calculus taking.
In a simple comparison of calculus- taking rates among students who took Algebra I at varying points, we would expect the same sort of bias established in the analysis of other outcomes above. That is, students who take algebra early are likely to achieve better outcomes largely because they are positively selected. With this expectation in mind, we present basic evidence in Figure 3 to assess the potential positive impact of eighth grade algebra enrollment on calculus taking for students at various points in the achievement distribution, using the full sample of students across the ten districts identifi ed in Tables 2a and 2b in cohorts observed for a full six years beginning when they fi rst enroll in seventh grade.
Two patterns are readily apparent in Figure 3. First, the plots slope upward: Higher- scoring middle school students are more likely to enroll in calculus by the time they complete high school than those with lower test scores. Second, and more impor-tantly for our purposes, the likelihood of taking calculus in high school conditional on middle school math test scores is uniformly higher among those students who took Algebra I no later than eighth grade. Although this pattern may refl ect the causal impact of early algebra, it also refl ects the likelihood that accelerated students are bet-ter prepared than unaccelerated students even afbet-ter we control for the average of their sixth and seventh grade math scores. For this reason, the vertical distance between the two lines in the chart can be interpreted as an upper bound on the true causal effect of eighth grade algebra. This upper bound is, for many students, quite low. Among students with the best math test scores in middle school, those who take Algebra I in eighth grade proceed to calculus about 80 percent of the time; those who wait until high school still manage to proceed to calculus about 60 percent of the time, presum-ably because they “double up” on math coursework in one or more high school years. The upper bound on the treatment effect for high- achieving students is thus around 20 percentage points.
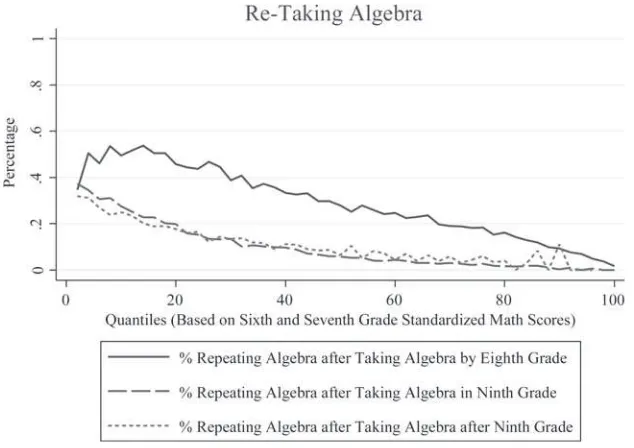
If Algebra acceleration entails introducing subject matter to students who are not prepared to handle it, one predictable consequence would be an increased failure rate followed by an increased rate of retaking the course. This was our interpretation of the contrasting results in specifi cations examining Algebra I test scores and pass rates in Table 5. Figure 4 presents a more detailed view, showing evidence on the rate of retaking Algebra I for students who fi rst take the course in eighth grade or earlier, ninth grade, or after ninth grade, as a function of their sixth and seventh grade math test scores. The graph shows that retaking rates tend to be higher among lower- performing students. Moreover, although the differences in retaking rates between those who take Algebra I in ninth grade and those who take it in a higher grade are very small, eighth grade Algebra I takers have a far higher risk of repeating the course at virtually all prior achievement levels. For students around the twentieth percentile of the initial math achievement distribution, the retaking rate is nearly 50 percent for students who attempt the course in middle school, far higher than the 20 percent rate among those who take it in high school. We note that this comparison understates the true treatment effect to the extent the students selected for early algebra are unobservably better performers than their counterparts.
In sum, our analysis indicates that enrolling the lowest- performing students in early algebra introduces signifi cant downside risks with little to no upside poten-tial. For moderately performing students, the potential rewards are moderate and the
0
.2
.4
.6
.8
Pe
rce
n
ta
g
e
0 20 40 60 80 100
Quantiles (Based on Sixth and Seventh Grade Standardized Math Scores)
% Taking Calculus by Year 5 Conditional on Taking Algebra by Eighth Grade
% Taking Calculus by Year 5 Conditional on Taking Algebra after Eighth Grade
Taking Calculus by Year 5
Figure 3
The Journal of Human Resources 184
downside risk is signifi cant. Students in the upper portion of the initial test score dis-tribution appear to suffer few ill effects beyond the fi rst year, and may in fact benefi t from the opportunity to access higher- level math coursework in high school.
VI. Conclusion
Algebra is often described as a “gateway” to higher- level mathemat-ics. Because of the largely hierarchical nature of mathematics instruction, however, the gateway label could equally well be applied to a range of pre- algebra courses, geometry, or any other math subject in the hierarchy. Moreover, policymakers have often incorrectly interpreted the strong positive correlation between taking algebra early and later success as implying that waiting until high school to take it limits stu-dents’ opportunities to enroll in the higher- level math courses needed for college. That interpretation is fl awed because selection problems make it inappropriate to interpret the observed correlation as a causal relationship. Our empirical evidence, based on a clear policy intervention affecting nearly the entire distribution of students in two large school districts, avoids the selection bias, and shows that early administration of Algebra I—when not preceded by broader reform of the entire math curriculum —sig-Figure 4
Probability of Repeating Algebra I Conditional on First Taking Algebra I in a
Specifi c Grade, by Percentile Rank of Mean Sixth/Seventh Grade Math Score, Ten
nifi cantly weakens performance in that course and in Geometry, the typical followup course.
Our results imply, for example, that California’s abortive initiative to increase the proportion of students taking introductory algebra in eighth grade from 59 percent to 100 percent, absent any wholesale reform in pre- algebra math courses, would have yielded adverse effects. Our results also cast doubt on assignment practices in school districts such as the District of Columbia, in which fourth grade math performance is signifi cantly lower than in CMS based on NAEP assessments, yet eighth grade algebra placement is the norm.
We fi nd substantial evidence that introducing algebra in middle school, rather than serving to equalize student outcomes, exacerbates inequality. Students at or above the sixtieth percentile of the initial achievement distribution appear to suffer more modest setbacks when accelerated and may be as many as 20 percentage points more likely to take a calculus course in high school when they are accelerated. At the lower end of the distribution, since calculus- taking rates are approximately 0 regardless of Alge-bra I timing, the acceleration introduces costs without offering benefi ts. Patterns in the middle of the distribution are, not surprisingly, somewhere between these extremes.
One interpretation of these fi ndings is that offering algebra for all eighth graders would be a worthy standard if additional reforms raised the performance of all stu-dents to the level where the sixtieth percentile North Carolinian middle school student lies today. More generally, this evaluation illustrates the hazards of basing policy ini-tiatives on simple correlational evidence without fi rst taking steps to assess the validity of causal interpretation.
Appendix
Table A1Summary Statistics for Dependent Variables
School District
Algebra I Test Scores
Pass Algebra I by Tenth Grade
Pass Geometry by Eleventh
Grade
Pass Algebra II by Twelfth Grade
CMS –0.093 72.1 percent 47.0 percent 51.9 percent
(1.053)
Guilford County –0.226 77.1 percent 48.1 percent 54.7 percent
(1.029)