www.elsevier.com / locate / livprodsci
Genetic study of longevity in Swedish Landrace sows
*
M.H. Yazdi , L. Rydhmer, E. Ringmar-Cederberg, N. Lundeheim, K. Johansson
¨Department of Animal Breeding and Genetics, Swedish University of Agricultural Sciences, Funbo-Lovsta, S-755 97 Uppsala, Sweden
Received 27 August 1998; received in revised form 8 June 1999; accepted 17 June 1999
Abstract
Genetic parameters for length of productive life of Swedish Landrace sows were estimated using a proportional hazards model based on the Weibull distribution. Data were obtained from 7967 sows with at least one farrowing recorded, using the Swedish litter-recording scheme, from 1986 through 1998 from nucleus and multiplier herds. Effects of litter size at first and last farrowing, age at first farrowing, daily gain from birth to performance test (|170 days of age), weight, and side-fat thickness at performance test were included in the model as fixed and time-independent explanatory variables. The effect of herd3year (of birth) combinations was treated differently in several analyses (random versus fixed and time-independent versus time-dependent). The random effect of sires, incorporating full pedigree information, was taken into account in all analyses as the source of genetic variation (sire model). The length of productive lifetime (longevity) of sows was the dependent variable and was defined as the number of days from first farrowing until culling. The suitability of the Weibull model was assessed by evaluating the log-cumulative hazard versus the log of longevity (in days), which indicated that the Weibull model could be fitted to the data satisfactorily. All explanatory factors except daily gain and side-fat had a significant effect on longevity of sows in all analyses. The effect of herd3year had the largest influence among the factors included. Among the various analyses, estimates of heritability for longevity ranged from 0.109 to 0.268 on the original scale. The estimates were similar within each group of models, averaging 0.13 for the time-independent and 0.25 for the time-dependent herd3year effect in the model. Correlations between sires’ breeding value estimates were 0.98 between time-independent models and ranged from 0.96 to 0.98 among time-dependent models. It was concluded that there is genetic variation that can be utilised for increasing longevity by selection. 2000 Elsevier Science B.V. All rights reserved.
Keywords: Heritability; Life length; Survival analysis; Swine; Weibull distribution
1. Introduction through the voluntary culling of sows with inferior
fertility or a low capacity to produce piglets. Sow Longevity of sows summarises the effects of longevity is important to farmers owing to the high functional traits (functional longevity), defined as the costs of replacement. Results of several studies have ability to delay involuntary culling (Ducrocq and shown that long lifetime production and low culling
¨
Solkner, 1998a), and of reproductive performance rates in swine herds have substantial economic benefits (e.g. te Brake, 1986; Jalvingh et al., 1992). Thus, length of productive life (from first farrowing
*Corresponding author. Present address: Institute of Ecology
until culling) is a trait that has received increasing
and Resource Management, University of Edinburgh, West Mains
Road, Edinburgh EH9 3JG, Scotland, UK. attention in swine breeding. This subject has also
been given more attention in other farm animals, i.e. from 1986 through 1997, with at least one farrowing dairy cattle (e.g. Dekkers et al., 1994; Strandberg and were available in the data bank. The individual
¨
Solkner, 1996). record of each animal included herd (the herd that The effects of environmental factors, such as herd the animal was born in), date of birth, date of first management and housing systems, on longevity of farrowing (f date), date of culling (c date), age at] ] sows in Sweden have been investigated by several first farrowing (age), litter size (born alive) at first authors (Eliasson-Selling and Lundeheim, 1996; farrowing (f ls), litter size at last farrowing (l ls),] ] Olsson, 1996; Ringmar-Cederberg and Jonsson, weight of gilt (weight) at field performance test 1996; Ringmar-Cederberg et al., 1997). Although (|170 days of age), daily gain (gain) from birth until
there is indirect selection (due to leg weakness, low field performance test, and side-fat thickness (fat) at fertility, etc.) for longevity in all pig breeding field performance test. To base conclusions on more programmes, to our knowledge, sow longevity is not precise estimates of the herd3year (year of birth) included systematically in any such programmes. factor, only sows from nucleus and multiplier herds One method for analysing longevity data is surviv- with more than 50 sows that were born, raised and al analysis which allows inclusion of both censored farrowing in the same herd were kept in the data set. and uncensored records of animals (Cox, 1972). This In total, sows from 24 herds were included. Animals approach relies on the concept of hazard, instanta- with extreme values for age at first farrowing (#250 neous or age-specific failure rate (Lawless, 1982; and $480 days) and records of sires with less than 2 Lee, 1992) or, in the animal breeding context, the daughters were excluded. After editing, the data set animal’s risk of being culled at time t, conditional included records of 7967 sows with 5484 (69%) upon survival to time t (Ducrocq, 1987; Ducrocq et uncensored and 2483 (31%) censored (incomplete al., 1988a). Proportional hazards models have been records, longevity of animal is equal or longer than extended to incorporate time-dependent covariates known period) records. The l ls was expressed as a] (Kalbfleisch and Prentice, 1980). Further, the inclu- deviation from the average of litter size for all sows sion of random effects in the proportional hazards in that particular parity. A constant value of 12 was models (Smith and Quaas, 1984) and, particularly, added to each sow’s deviation in order to avoid the extension of mixed survival models to include negative values. Classes of f ls with 0, 1 and 2 litters] relationships between sires (Ducrocq and Casella, were grouped together owing to the very low fre-1996) and development of computer programs (Duc- quencies of these classes. Also, classes of 16 and
¨
rocq and Solkner, 1994, 1998b), have made it higher were added to class 15. The same procedure possible to estimate the genetic potential of sows for was used for l ls for observations in classes outside] a longer productive life. the range 3 to 19. The end of the recording period In this study we analysed longevity data of was defined as the latest date of farrowing in each Landrace sows from Swedish nucleus and multiplier herd (for most herds, it was in February 1998). herds with the aim of revealing the most important Censoring code and longevity were defined as in factors influencing longevity. Since the genetic Table 1.
make-up of sows in the herd is thought to have an There were 250 herd3year (hy) combinations, important influence on culling rates, the ultimate and the size of these classes varied from 1 to 151 goal was to estimate the genetic parameters for (average 32 sows). The distribution of sows across hy longevity. was unbalanced: 22% of hy classes had no censored records, 50% had #3 censored, and 9% had no uncensored animals. The data set comprised a total
2. Material and methods of 792 sires with an average of 8 daughters each
(range 2–141). There were 297 sires lacking cen-2.1. Data sored daughters and 104 sires lacking uncensored daughters. Only 120 sires had more than 8 daughters The data were obtained from the Swedish litter- (average number of daughters per sire) with un-recording scheme managed by Quality Genetics. censored records.
Table 1
Definition of censoring code and longevity in the data set
a
Type of circumstance Censoring status Longevity No. of observations
Animal culled,
known culling date uncensored c date] 2f date] 5484
Animal alive at the end
of recording period censored latest date2f date] 1494
Animal with missing
culling date censored lf date] 2f date] 556
Animal sold censored date of sale2f date] 433
a
c date] 5date of culling; f date] 5date of first farrowing; lf date] 5date of last farrowing.
policies were changed over time, and hy was tional hazards model well suited for efficient analy-changed accordingly in some of the analyses. In ses of survival data (Ducrocq et al., 1988a), was these analyses changes in the hy effect were assumed used. Survival analysis was performed using The
¨
to occur on 1 April (beginning of spring in Sweden) Survival Kit (Ducrocq and Solkner, 1998b). The each year or every second year. Hence, hy was a hazard function of a sow was modelled according to function of calendar time and handled as a time- Ducrocq et al. (1988a):
dependent effect. Number of observations, means
r 21
and standard deviations in the hy and sire classes, as h(t, w(t))5lr(lt) exphw(t)9uj
well as ranges and means of other independent and
dependent (longevity) variables are presented in where h(t, w(t)) is the hazard function of an in-Table 2. dividual depending on time t (days from first
farrow-r 21
ing), and lr(lt) is the baseline hazard function 2.2. Statistical methods (related to the ageing process) which is assumed to follow a Weibull distribution, where l and r are Survival of a sow, measured as length of prod- location and shape parameters of the baseline uctive life, was considered as the dependent variable Weibull hazard function. Vector u 9 5hb9 u9j is a (longevity). The Weibull model, a type of propor- vector of fixed (b) and random (u) covariates with a
Table 2
Range, means6SD for the number of sows per herd–year class, and per sire, as well as range and mean6SD for other independent (discrete and continuous covariates) and dependent (longevity) variables
a
longevity 1–2503 585.06453.9 512.26421.1 617.96464.3
age 274–480 364.6634.8 365.0635.5 364.4634.4
weight 85–130 98.768.5 98.269.2 98.968.1
gain 333–845 532.5661.3 539.3663.9 529.4659.8
fat 6–22 11.462.1 11.362.1 11.562.1
a
hy5herd3year combinations; f ls] 5litter size at first farrowing; l ls] 5litter size at last farrowing; age5age at first farrowing (days); weight5weight of gilt at field performance test (kg); gain5daily gain from birth until field performance test (g / d); fat5side-fat thickness at field performance test (mm).
b
corresponding incidence matrix (possibly time-de- (1996) for more details of choosing the log-gamma pendent) w(t)9 5hx(t)9 z(t)9j. distribution. The parameterg was either estimated or Several analyses were carried out with somewhat the hy effect was integrated out in the analysis. The different models. The effects included in the model additive genetic effects of sires were assumed to for all analyses were: f ls and l ls as class, fixed and] ] have a multivariate normal distribution, sq|MVN(0,
2
time-independent covariates; age, weight, gain and Ass), where subscript q is the number of sires, A is
2
fat as continuous, fixed and time-independent the relationship matrix between sires, and ss is the covariates; and finally sire as a class, random and sire variance.
time-independent covariate. The additive genetic The heritability of longevity was calculated from relationship matrix of sires was incorporated in the the sire variance component as a proportion of analyses. phenotypic variance of the Weibull distribution as The effect of hy summarizes effects of several described by Ducrocq and Casella (1996) on the factors (e.g. herd management, food supply), and the logarithmic scale of length of productive life as
2 2 2 2 2
influence on culling rate might change over time. It hlog54ss/(p / 61ss), where p / 6 is the variance is, however, difficult to foresee how often these of the standard extreme value distribution (Lawless,
2
changes occur and what is the appropriate length of 1982). The variance of hy (shy), which was esti-time intervals. Therefore, results from the following mated from the second moment (trigamma) of the models, when hy was treated differently in each log-gamma distribution (Lawless, 1982), was added model, were compared. to the denominator of the expression used for
2
calculating hlogwhen hy was considered as a random effect in the model. The calculation of heritability on
FTI fixed time-independent;
2
the original scale of length of productive life (h )
RTI random time-independent; ori
was based on the description of Ducrocq (1998,
FTD1 fixed time-dependent (time interval of 1 year);
2 2
personal communication) as h 54s /([exph1 /r 3
RTD1 random time-dependent (time interval of 1 year); ori s
2 2 2
nj] 3(p / 61s )) where n 5 2Euler’s constant
FTD2 fixed time-dependent (time interval of 2 years); s
(the mean of the standard extreme value
RTD2 random time-dependent (time interval of 2 years).
2
distribution)5 20.5772. The shy was added to the denominator of the expression, as was done for the The exponential part of the above models for
log scale, when hy was considered as a random effects of explanatory variables, either fixed or
effect in the model, and n was then calculated as random, was as follows:
f ls] k is the k first-farrowing litter-size effect, The average length of productive life was 617
th
l ls] l is the l last-farrowing litter-size effect, days, which corresponds to an age of 2 years and 8
b (age)1 is the partial regression coefficient on age, months at culling (Table 2). This is in accordance
b (weight)2 is the partial regression coefficient on weight, with the average life length of sows from French
b (gain)3 is the partial regression coefficient on gain, herds reported by Le Cozler et al. (1999). There was
b (fat)4 is the partial regression coefficient on fat, and a wide range in the number of observations among
th
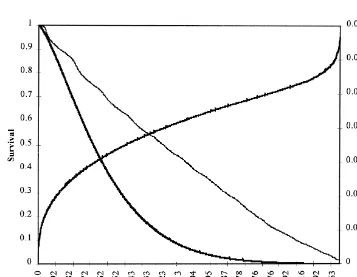
are illustrated in Fig. 1. An increased risk of culling (covariates) a likelihood-ratio test was carried out for after weaning of the first three litters (around 40, 220 all models. Results from RTD1, in which hy was and 400 days on the longevity axis) is reflected in the random and time-dependent with a time interval of 1
2
Kaplan–Meier survivor curve. year, are presented in Table 3. The R of Maddala The parameters of the Weibull distribution, r and (measure of proportion of variation explained by the
l, were very similar in the various analyses. The model, see Schemper, 1992) increased significantly suitability of the Weibull model was assessed by when f ls, l ls, age and weight were added. The] ] evaluating the log-cumulative hazard plot (Fig. 2), additional changes were very small when adding log (2log S(t)) versus log(t), where S(t) and t are the gain and fat to the model, since the effects of gain Kaplan–Meier survivor function and number of days and fat were not significant. Among the fixed after first farrowing, respectively (Lawless, 1982). covariates, l ls had the most significant influence on] Because the relationship is almost a straight line, risk of culling. Results from likelihood-ratio tests for except for a short period after the first weaning when significance of effects obtained from different there was intensive culling, the Weibull model seems models were similar concerning l ls, weight, gain] to fit the data well. and fat. For age and f ls the differences between] Preliminary survival analyses were carried out to models were larger, but the probabilities were always examine the confounding and interaction between below 0.10).
fixed effects. No significant interactions were found The effect of hy was highly significant ( p,0.001) between fixed effects. Further, age and weight were when it was treated as a fixed effect (FTI, FTD1, both regarded to be linearly related to longevity. FTD2). The estimated parameter of the log-gamma To test the significance of different effects distribution of hy (g), when treated as random,
Fig. 2. Graphical test of the Weibull assumption, S(t)5Kaplan–Meier estimate of the survivor function for the sows and t is days from first farrowing.
Table 3
a b
Likelihood ratio test, including shape (r) and location (l) parameters of Weibull distribution, when all covariates added to model RTD1 sequentially
2 2
Covariate d.f. (total) x d.f. Prob. R of Maddala
sire 1455 (RANDOM)
hy 271 1090.1 (RANDOM)
f ls] 284 21.270 13 0.0678 0.1302
l ls] 300 60.569 16 0.0000 0.1368
age 301 3.1443 1 0.0762 0.1371
weight 302 5.0541 1 0.0246 0.1377
gain 303 0.4304 1 0.5118 0.1377
fat 304 0.7903 1 0.3740 0.1378
a
hy5herd3year combinations; f ls] 5litter size at first farrowing; l ls] 5litter size at last farrowing; age5age at first farrowing (days); weight5weight of gilt at field performance test (kg); gain5daily gain from birth until field performance test (g / d); fat5side-fat thickness at field performance test (mm).
b
RTD15all covariates except hy were fixed and time-independent. The hy was treated as random and time-dependent with calendar time interval of 1 year.
ranged from 4.90 to 5.76. The estimated hazard problems, etc.) was not included in this data set, it coefficients for hy effects ranged from 21.737 to was impossible to determine exactly how important 1.141, which corresponds to relative culling rates the health traits were in impairing longevity. How-(exphhyj) from 0.18 to 3.13. These coefficients imply ever, these effects were implicitly the results of the that in the worst case, sows had three times higher herd management, which probably explains why hy risk of culling (probability of being culled) com- had such a strong influence on culling in this data pared with sows in the average hy effect with a set. Le Cozler et al. (1999) also found that the effect relative culling rate of 1. Also, sows in the worst hy of herd strongly affected longevity.
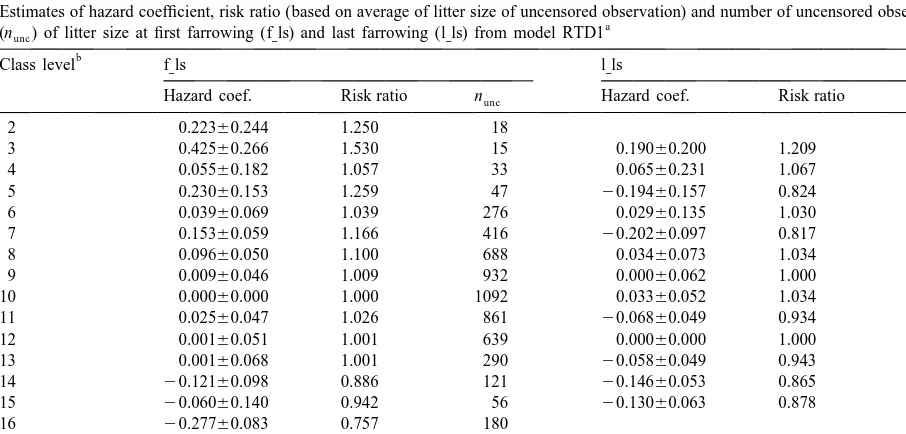
last farrowing (l ls) was highly significant ( p] ,0.01) of these problems. To include only the first and last in all analyses. Estimates of the associated hazard litter size in the survival analysis is a simplification. coefficients and the relative culling rates (based on Besides, the biological meaning of l ls of censored] the average litter size of sows with uncensored sows can be questioned. Inclusion of information on observations) were very similar for all different the sow’s all parities as time-dependent covariate models. Representative values for the hazard coeffi- would give a better description of the relation cient and the risk ratio (relative hazard or culling for between litter size and longevity.
an individual compared to the baseline hazard) The effect of age at first farrowing was significant generated by RTD1 are shown in Table 4. Although ( p,0.01) when hy was fixed in the model. Increased there was some fluctuations in the risk ratio between age at first farrowing increased the relative culling litter size classes, owing to a low number of observa- rate of sows. The hazard regression coefficient for tions at some levels, the risk ratio tended to decrease age at first farrowing was 0.00160.0005 per day. A with increasing litter size for both f ls and l ls. The] ] negative relation between age at first farrowing and increased risk related to small litters was more life length has also been shown by Holder et al. pronounced for l ls. Many farmers are of the opinion] (1995). This may partly be explained by the ten-that a ‘too large’ first litter increases the risk of early dency for sows with a high age at puberty to show culling; however, this could not be confirmed in the delayed oestrus after weaning (Sterning et al., 1998). present study. Ringmar-Cederberg and Jonsson The hazard regression coefficient for weight at (1996) and Eliasson-Selling and Lundeheim (1996) performance test was 0.00460.002 per kg. A high all concluded that reproduction problems of the sow weight at performance test could be a consequence is the most important reason for culling. According of a high growth rate. Although Gueblez et al.
´
to this study, small litters is an important indication (1985) and Lopez-Serrano et al. (2000) found a
Table 4
Estimates of hazard coefficient, risk ratio (based on average of litter size of uncensored observation) and number of uncensored observations
a
(nunc) of litter size at first farrowing (f ls) and last farrowing (l ls) from model RTD1] ]
b
Class level f ls] l ls]
Hazard coef. Risk ratio nunc Hazard coef. Risk ratio nunc
2 0.22360.244 1.250 18
3 0.42560.266 1.530 15 0.19060.200 1.209 27
4 0.05560.182 1.057 33 0.06560.231 1.067 20
5 0.23060.153 1.259 47 20.19460.157 0.824 45
6 0.03960.069 1.039 276 0.02960.135 1.030 62
7 0.15360.059 1.166 416 20.20260.097 0.817 126
8 0.09660.050 1.100 688 0.03460.073 1.034 252
9 0.00960.046 1.009 932 0.00060.062 1.000 387
10 0.00060.000 1.000 1092 0.03360.052 1.034 656
11 0.02560.047 1.026 861 20.06860.049 0.934 836
12 0.00160.051 1.001 639 0.00060.000 1.000 924
13 0.00160.068 1.001 290 20.05860.049 0.943 849
14 20.12160.098 0.886 121 20.14660.053 0.865 626
15 20.06060.140 0.942 56 20.13060.063 0.878 364
16 20.27760.083 0.757 180
17 20.47260.116 0.624 85
18 20.60360.201 0.547 26
19 20.39760.235 0.672 19
a
RTD15all covariates except herd–year were fixed and time-independent. The herd–year was treated as random and time-dependent with calendar time interval of 1 year.
b
negative relation between growth rate and longevity, variance. It seems that model RTD1 describes data growth rate itself had no significant influence on most properly. Heritability on the original scale longevity in this study. represents the heritability of length of productive life Estimates of sire variance, heritability and parame- when all daughters of sires have uncensored records ters of the Weibull distribution obtained from differ- (Ducrocq, 1999).
ent models are presented in Table 5. Estimates of Tholen et al. (1996) estimated the heritability for sire variances and heritabilities from FTI and RTI stayability (the probability of the sow surviving in were similar. The sire variances obtained when hy the herd from parity 1 to parity 4, an all-or-none
´
was treated as a time-dependent variable ranged from trait) to be 0.08 and Lopez-Serrano et al. (2000) 0.04 to 0.05, which were higher than those obtained estimated the heritability for stayability from parity 1 when hy was time-independent (0.02 and 0.03). The to 3 to be 0.10. Krieter (1995) estimated the increase in sire variances reflects the characteristics heritability of sow longevity, measured as age at of genetic origin that were carried over from year to culling, to be 0.12. The heritability for the length of year since 1986 (the first year in this investigation). productive life in dairy cattle has been estimated to In other words, due to the large effect of hy on the be less than 0.09 on a log scale (Ducrocq et al., longevity of sows and probably invalidity of the 1988b; Vollema and Groen, 1996; Vollema and proportional hazards throughout the time range, the Groen, 1997).
effects of sire were masked by the hy effect and, The relative culling rate for daughters of sires consequently, the sire variances became low when hy ranged from 0.65 to 1.27, using model RTD1. This was time-independent. The resulting heritabilities corresponds to the lowest and highest risk of culling from models with hy as a time-dependent variable for daughters of the best and worst sires, respective-were also higher (on average, 0.25 on original scales) ly, compared with daughters of an average sire than estimated heritabilities when hy was a time- which have a relative risk of culling equal to 1. independent variable (on average, 0.13 on original Daughters of the worst sires thus had two times scales). Also, the decrease in the sire variances higher risk of culling compared with daughters of the observed when the time-dependent hy was changed best sires. The correlation between breeding value of from fixed to random indicates that differences in the sires from FTI and that of sires from RTI was 0.98. longevity of sows related to hy had partly genetic The corresponding correlation between breeding origin and modified the variability of longevity due values from different models when hy was a time-to sire. The length of the time interval (1 versus 2 dependent variable ranged from 0.96 to 0.99. The years) had no significant influence on the sire correlations between breeding values of sires from
Table 5
2 2
Estimates of sire variance (ss), shape (r) and location (l) parameters of the Weibull distribution, and heritability on log (hlog) and original
2
(hori) scales of length of productive life (longevity)
a,b 2 c 2 2
Models ss r l hlog hori
FTI 0.02060.011 1.40060.016 0.237 0.048 0.109
RTI 0.02660.012 1.36760.015 0.227 0.056 0.149
FTD1 0.04560.013 1.38860.018 0.251 0.107 0.246
RTD1 0.03760.012 1.36260.016 0.227 0.075 0.212
FTD2 0.04960.014 1.38660.017 0.270 0.116 0.267
RTD2 0.04760.013 1.35960.016 0.220 0.098 0.268
a
The effects of f ls (litter size at first farrowing), l ls (litter size at last farrowing), age (age at first farrowing), weight (weight of gilt at] ] field performance test), gain (daily gain from birth until field performance test), fat (side-fat thickness at field performance test) were included in all models.
b
FTI5hy was fixed and time-independent; RTI5hy was random and time-independent; FTD15hy was fixed and time-dependent (time
interval of 1 year); RTD15hy was random and time-dependent (time interval of 1 year); FTD25hy was fixed and time-dependent (time
interval of 2 years); RTD25hy was random and time-dependent (time interval of 2 years).
c
time-dependent models (FTI and RTI) and that of more precise registration of the cause of culling sires from time-dependent models (FTD1, RTD1, would also increase the possibility to include sow FTD2, RTD2) ranged from 0.87 to 0.90. All standard longevity in the breeding evaluation.
errors of correlations were very similar (0.001). This similarity between the evaluations of sires from
different models confirms the similarity of the sire Acknowledgements variance components obtained for the different
models within time-independent and dependent hy The authors are very grateful to The Swedish effects. Farmers’ Foundation for Agricultural Research for Due to many missing observations concerning the financially supporting this study. Quality Genetics cause of culling and date of mating and weaning it (the Swedish pig-breeding organisation) is acknowl-was impossible to directly distinguish between vol- edged for providing the data. The authors are in-untary and involin-untary culling of these sows. The debted to V.P. Ducrocq (Station de Genetique Quan-´ ´ aim is, of course, to produce sows that have a long titative et Appliquee – Institut National de la Re-´ life length due to good health and high production cherche Agronomique, France) for kindly placing rather than to long farrowing interval or delayed The Survival Kit at our disposal and answering our slaughter after last weaning. Therefore, it would be questions. The authors gratefully acknowledge E. interesting to account for voluntary and involuntary Strandberg, Department of Animal Breeding and culling when estimating the heritability of longevity, Genetic, SLU, Sweden, for useful comments on the as discussed by Strandberg (1997). manuscript.
4. Conclusions
References
Among the factors evaluated in the model, hy had
Cox, D.R., 1972. Regression models and life table (with
discus-the largest influence on discus-the risk of culling of sows. sion). J. Royal Stat. Soc., Series B 34, 187–220.
Although litter size at both first and last farrowing Dekkers, J.C.M., Jairath, L.K., Lawrence, B.H., 1994.
Relation-had significant effects on risk of culling, the latter ships between sire genetic evaluations for conformation and functional herd life of daughters. J. Dairy Sci. 77, 844–854.
had a stronger effect on the risk ratio. The effects of
Ducrocq, V.P., 1987. An analysis of length of productive life in
age at first farrowing and weight of gilt at
per-dairy cattle, Cornell University, Ithaca, NY, USA, Ph.D.
formance test were significant, but not large. dissertation.
The increase in the sire variance and heritability of Ducrocq, V.P., 1999. Two years of experience with the French
longevity when hy was time-dependent compared to genetic evaluation of dairy bulls on production-adjusted longevity of their daughters. In: Proceedings of International
time-independent indicates that the records of sows
Workshop on Genetic Improvement of Functional Traits in
were more thoroughly corrected for the effect of hy
Cattle, Jouy-en-Josas, France, May 9–11, 1999.
when it was treated as a time-dependent variable. Ducrocq, V.P., Casella, G., 1996. A Bayesian analysis of mixed Obviously, the choice of model is very important survival models. Genet. Sel. Evol. 28, 505–529.
when analysing survival data and, consequently, has Ducrocq, V.P., Quaas, R.L., Pollak, E.J., Casella, G., 1988a. Length of productive life of dairy cows. 1. Justification of a
very strong influence on the results and conclusion.
Weibull model. J. Dairy Sci. 71, 3061–3070.
The moderate estimates of heritability (on the
origi-Ducrocq, V.P., Quaas, R.L., Pollak, E.J., Casella, G., 1988b.
nal scale when there is no censoring) in these Length of productive life of dairy cows. 2. Variance component investigations indicate that there is genetic variation estimation and sire evaluation. J. Dairy Sci. 71, 3071–3079.
¨
among the animals that can be utilised for improving Ducrocq, V.P., Solkner, J., 1994. ‘‘The Survival Kit’’, a FOR-TRAN package for the analysis of survival data. In:
Proceed-longevity in the Swedish Landrace breed.
ings of 5th World Congress on Genetics Applied to Livestock
However, a breeding evaluation of sow longevity
Production, Vol. 22, Univ. of Guelph, Ontario, Canada, pp.
demands a high quality data bank that includes 51–52.
censoring records and dates of each mating, farrow- Ducrocq, V.P., Solkner, J., 1998a. Implementation of a routine¨
survival analysis technique. In: Proceedings of 6th Word Comparative studies in two housing systems for sows in Congress on Genetics Applied to Livestock Production, Vol. 23, gestation. In: Report 111, Proceedings of NJF-seminar no. 265. Univ. of New-England, Armidale, Australia, pp. 359–362. Longevity of sows, Research Centre Foulum, Denmark.
¨
Ducrocq, V., Solkner, J., 1998b. ‘‘The Survival Kit V3.0’’, a Ringmar-Cederberg, E., Jonsson, L., 1996. Sow culling in package for large analyses of survival data. In: Proceedings of Sweden. In: Report 111, Proceedings of NJF Seminar no. 265. 6th World Congress on Genetics Applied to Livestock Pro- Longevity of sows, Research Centre Foulum, Denmark. duction, Vol. 27, Univ. of New-England, Armidale, Australia, Ringmar-Cederberg, E., Johansson, K., Lundeheim, N., Rydhmer, pp. 447–450. L., 1997. Longevity of Large White and Swedish Landrace
th
Eliasson-Selling, L., Lundeheim, N., 1996. Longevity of sows in Sows. In: 48 annual meeting of the EAAP, Vienna, Austria, Swedish sow pools. In: Report 111, Proceedings of NJF- Vol. book no. 3, p. 30.
seminar no. 265. Longevity of sows, Research Centre Foulum, Schemper, M., 1992. Further results on the explained variation in Denmark. proportional hazards regression. Biometrika 79, 202–204.
ˆ
Gueblez, R., Gestin, J.M., Le Henaff, G., 1985. Incidence de l’age Smith, S.P., Quaas, R.L., 1984. Productive life span of bull
´ ` `
et de l’epaisseur de lardorsal a 100 kg sur la carriere reproduc- progeny groups: failure time analysis. J. Dairy Sci. 67, 2999– ´
tive de truies Large White. Journees de la Recherche Porcine 3007.
en France 17, 113–120. Sterning, M., Rydhmer, L., Eliasson-Selling, L., 1998. Relation-Holder, R.B., Lamberson, W.R., Bates, R.O., Safranski, T.J., 1995. ship between age at puberty and interval from weaning to Lifetime productivity in gilts previously selected for decreased oestrus and between oestrus signs at puberty and after the first age at puberty. Anim. Sci. 61, 115–121. weaning in pigs. J. Anim. Sci. 76, 353–359.
Jalvingh, A.W., Dijkhuizen, A.A., van Arendonk, J.A.M., Bras- Strandberg, E., 1997. Breeding strategies to improve longevity. In: camp, E.W., 1992. An economic comparison of management 48th Annual Meeting of the EAAP, Vienna, Austria, p. 28.
¨
strategies on reproduction and replacement in sow herds using Strandberg, E., Solkner, J., 1996. Breeding for longevity and a dynamic probabilistic model. Lives. Prod. Sci. 32, 331–350. survival in dairy cattle. In: Proceedings of International Work-Kalbfleisch, J.D., Prentice, R.L., 1980. The Statistical Analysis of shop on Genetic Improvement of Functional Traits in Cattle. Failure Time Data. John Wiley and Sons, New York, NY. Gembloux, Belgium, Interbull Bulletin, Vol. No. 12, pp. 111– Kaplan, E.L., Meier, P., 1958. Nonparametric estimation from 119.
incomplete observations. J. Amer. Stat. Ass. 53, 457–481. te Brake, J.H.A., 1986. Culling of sows and the profitability of
¨ ¨
Krieter, J., 1995. Zuchtwertschatzung fur die Nutzungsdauer von piglet production. Netherlands J. Agri. Sci. 34, 427–435. ¨
Sauen. 70th Ausschuss fur genetisch statistische Methoden in Tholen, E., Bunter, K.L., Hermesch, S., Graser, H.-U., 1996. The ¨ ¨
der Tierzucht, Deutsche Gesellschaft fur Zuchtungskunde, genetic foundation of fitness and reproduction traits in
Aus-Germany. tralian pig populations. Relationships between weaning to
Lawless, J., 1982. Statistical Models and Methods For Lifetime conception interval, farrowing interval, stayability, and other Data. John Wiley and Sons, New York, NY. common reproduction and production traits. Aust. J. Agric. Le Cozler, Y., Dagorn, J., Lindberg, J.E., Aumaitre, A., Dourmad, Res. 47, 1275–1290.
J.Y., 1999. Effect of age at first farrowing and herd manage- Vollema, A.R., Groen, A.F., 1996. Genetic parameters of longevi-ment on long-term productivity of sows. Livest. Prod. Sci. 53, ty traits of an upgrading population of dairy cattle. J. Dairy Sci.
135–142. 79, 2261–2267.
Lee, E.T., 1992. Statistical Methods For Survival Data Analysis, Vollema, A.R., Groen, A.F., 1997. Longevity on small and large 2nd ed. John Wiley and Sons, New York, NY. dairy cattle farms: A comparison of phenotypic averages, ´
Lopez-Serrano, M., Reinsch, N., Looft, H., Kalm, E., 2000. REML breeding values, and survival analysis breeding values,
th
Genetic correlations of growth, backfat thickness and exterior 48 annual meeting of the EAAP, Vienna, Austria, Vol. book with stayability in Large White and Landrace sows (in press). no. 3, EAAP, 31.