Changes in photosynthetic characteristics and photosystem
stoichiometries in the lower leaves in rice seedlings
Jun-ya Yamazaki
a,*, Yasumaro Kamimura
a, Mitsumasa Okada
b,
Yasutomo Sugimura
aaDepartment of Biology,Faculty of Science,Toho Uni
6ersity,2-2-1Miyama,Funabashi,Chiba274-8510,Japan bDepartment of Biomolecular Science,Faculty of Science,Toho Uni
6ersity,2-2-1Miyama,Funabashi,Chiba274-8510,Japan
Received 5 April 1999; received in revised form 7 July 1999; accepted 7 July 1999
Abstract
Changes in the Chla/bratio, electron transport, electron carriers, and photosystem stoichiometries were examined in rice leaves in the present study. The Chla/bratio is known to decrease gradually from the top to the bottom leaves, indicating a increase in the abundance of LHC II relative to the reaction center complexes of the two photosystems. We used juvenile rice canopy and obtained the following results: (1) the photosynthetic activity and Chl content per leaf area decreased from the top to the bottom leaves, the Chla/bratio also declined from 3.7 to 3.0; (2) when determined on the basis of Chl content, C-550 and Cytfcontent decreased, but there was no loss of P-700, Consequently, the PS II/PS I ratio significantly decreased; (3) on the basis of mmol Chl, the levels of Cytfdramatically decreased and, therefore, no loss was observed for whole chain electron transport per Cytf; and (4) the percentage abundance of PS IIa increased, but the rate constants of QA photoreduction and P-700 photooxidation
gradually decreased. From these results, we hypothesize that there is a compensatory relationship between the decline in the Chl
a/bratio and that in the PS II/PS I ratio in the lower leaves in rice seedlings. © 1999 Elsevier Science Ireland Ltd. All rights reserved.
Keywords:Antenna size of PS I and PS II; Chla/bratio; Light intensity; PS II heterogeneity; PS II/PS I ratio; Rice
www.elsevier.com/locate/plantsci
1. Introduction
Light is an important factor for plant growth. In vertically vascular plants, because leaves that develop at the top of a canopy receive full sun-light, lower leaves receive very weak light. Accord-ingly, the light intensity decreases exponentially from the uppermost to the bottom layer made by mutual shading of leaves [1]. Hikosaka [2] and Okada and Katoh [3] made several important
statements on the aggravation of the light environ-ment, especially the attenuation of the light inten-sity. They claimed that photosynthesis in lower leaves is limited by light intensity, and an excessive amount of the proteins related to CO2fixation are degraded rapidly. In contrast, the proteins in-volved in the harvesting and utilization of light are effectively protected in weak light [3], as in the example of the decline in the ratio of Chl a to b
during leaf senescence [4]. A decline in the Chla/b
ratio indicates a more rapid degradation of the reaction center complexes of the photosystems than of LHC II [4 – 6]. Thus, lower leaves retain the capacity to drive photosynthesis maximally under the light-limiting conditions of shade. This indicates that a plant has the plasticity to adjust its photosynthetic apparatus in response to the ap-pearance of mutual shading leaves that are in-evitably associated with plant growth.
Abbre6iations: C-550, electrochromic shift of pheophytin in the
reaction center complex of photosystem II; Chl, chlorophyll; Cyt, cytochrome; DCIP, 2,6-dichlorophenolindophenol; DCMU, 3-(3,4-dichlorophenyl)-1,1-dimethylurea; LHC I and II, the light-harvesting chlorophylla/b-protein complex in PS I and II, respectively; P-700, the reaction center complex in photosystem I; PS, photosystem;QA,
primary quinone acceptor of PS II.
* Corresponding author. Tel./fax: +81-47-472-5362. E-mail address:[email protected] (J.-y. Yamazaki)
There are many reports that the spectral quality and/or the intensity of light affect the changes in the Chl a/b and the PS II/PS I ratios [5 – 11]. It should be noted that most of these findings were obtained from experiments in which plants were grown in artificially controlled light conditions. Little is known about these changes when plants were grown under natural conditions. Recently, the PS II/PS I ratio is less affected by natural shade compared with artificial conditions where the light intensity and spectral quality conditions can be extreme [10].
In several reports about photosystem stoi-chiometries, Melis and his associates [11,12] re-ported on the effects of light quality during plant and algal cell growth, and they revealed a compen-satory system adjusting the two photosystem stoi-chiometries depending on light quality by using spectrophotometrical analysis. In contrast, a few reports examined the effects of light intensity using spectrophotometric measurement [7].
In terms of both function and antenna size, the PS II reaction center is heterogeneous [12,13]. One center has a large antenna and is functional in electron transport, and one has a small antenna and is unable to transfer electrons fromQ−A toQB. The former is defined as PS IIa, and the latter as PS IIb. As a result of the large difference in antenna size, photoreduction of QA in PS IIa proceeds more rapidly than it does in PS IIbunder irradiation with a limited-intensity green light in the DCMU-poisoned thylakoids.
In the present study, the Chl a/b ratio, levels of the reaction center complex of PS I and PS II and of Cyt b6/f complex, and electron transport activ-ity were determined at the different leaf positions of rice seedlings. In addition, the relative antenna sizes of PS I and PS II were determined by mea-suring the kinetics of photooxidation of P-700 and photoreduction of QA. Using the results obtained, we discuss herein the physiological significance of a decline in the Chl a/b ratio in the lower leaves.
2. Materials and methods
2.1. Plant growth conditions
Rice plants (Oryza sati6a L. cv. Nipponbare)
were grown in a greenhouse for 4 – 5 weeks as described in [4]. Germinated seeds were planted at
3-cm intervals in an artificial granular soil, Bonsol No. 1 (Sumitomo Kagaku, Osaka, Japan) that contained sufficient levels of nutrients for the growth of rice seedlings. The plants were watered daily. Leaves were numbered in the order of their development. Monocotyledonous rice leaves suc-cessively developed with high synchronization, and a newly developed leaf blade was always longer than a lower leaf blade that had developed earlier. The 3rd – 6th leaves were harvested immediately after full expansion of the 6th leaves had occurred. By this time, the 1st and 2nd leaves had withered and the tips of the 3rd leaves had turned yellow.
2.2. Light intensity and spectral quality measurements
Light intensity was measured at each leaf posi-tion with a Li-Cor model LI-189 light meter (Lin-coln Co., Lin(Lin-coln, NE, USA). Spectral photon distribution measurements were made for each leaf position using a Li-Cor model LI-1800 spectrora-diometer. The sensor probe was placed on the adaxial surface of the center leaf blade to evaluate the transmission of light through the upper leaves. Each measurement was the average of three spec-tral scans taken from 300 to 800 nm at 2-nm intervals. Light intensity and spectral photon dis-tributions were measured between 1300 and 1500 h on cloudless, clear days.
2.3. Measurement of photosynthesis
Photosynthesis of leaves was measured with a Hansatech leaf-disc oxygen electrode at 30°C. The gas phase consisted of air containing 4% CO2. A saturating actinic light (2000 mmol photons m−2 s−1) from a 100-W halogen lamp passed through a Hoya HA heat-absorbing filter. Leaf area was estimated by inputting leaf shapes into a micro-computer (NEC PC-9801 RX) with an image scan-ner (EPSON GT-6500).
2.4. Isolation of thylakoid membranes and their photosynthetic acti6ities
blender. The homogenate was filtered through two layers of Miracloth (Calbiochem, USA), and the filtrate was centrifuged at 250×g for 5 min. The supernatant was centrifuged at 5500×g for 15 min, and the precipitate was suspended in the medium just described. The rates of evolution or consumption of oxygen at light-saturation were measured with a Clark-type oxygen electrode at 25°C in a basal medium that contained 0.4 M sucrose, 10 mM NaCl, 5 mM MgCl2, and 50 mM HEPES-NaOH (pH 7.5). PS II activity was mea-sured by adding 1 mM phenyl-p-benzoquinone to a basal reaction medium. PS I activity was deter-mined in the presence of 10 mM DCMU, 500 mM DCIP, 1 mM methyl viologen, and 2 mM sodium ascorbate. For whole chain electron transport, 1 mM methyl viologen and 1 mM NaN3were added to the basal medium. All mixtures contained 20 mM HCl-methylamine as an uncoupler, and thy-lakoid membranes were adjusted to 11 mM Chl. Chlorophyll was determined by the method of [14].
2.5. Determination of PS I and PS II reaction center contents
P-700 and C-550 were measured with a Hitachi 556 dual-wavelength spectrophotometer. P-700 was determined by measuring light-induced ab-sorbance changes at 700 nm with a reference wavelength at 730 nm. The reaction medium con-tained 50 mM HEPES-NaOH (pH 7.5), 10 mM NaCl, 5 mM DCIP, 1 mM sodium ascorbate, 10
mM DCMU, 1 mM methyl viologen, 0.05% (w/v) Triton X-100, and thylakoid membranes equiva-lent to 11 mM Chl. Actinic light passed through a blue band-pass filter (Corning, CS 4 – 96), and the photomultiplier was protected with a red cut-off filter (Toshiba, R-66). The differential absorption coefficient of P-700 was taken to be 64 mM−1 cm−1 [15].
Light-induced absorbance changes of C-550, an electrochromic band shift of pheophytin that is associated withQAphotoreduction [16], was deter-mined at 550 nm with a reference wavelength at 540 nm as described previously [17]. Red actinic light was obtained by passing light through a 650-nm interference filter, with the photomultiplier guarded by a CS 4 – 96 filter. The differential ab-sorption coefficient used was 5.2 mM−1 cm−1 [17]. The reaction medium contained 50 mM
HEPES-NaOH (pH 7.5), 10 mM NaCl, 15 mM DCMU, 20mM gramicidin D, 2 mM ferricyanide, 0.1% (w/v) Triton X-100, and thylakoid mem-branes (82 mM Chl). The detergent treatment ef-fectively removed the light-scattering, and we made sure that this concentration of the detergent did not influence the measurement of C-550. We also made sure that the actinic light used for P-700 and C-550 determination was sufficiently saturat-ing for the measurement. Cyt f contents were determined with a Hitachi 556 spectrophotometer in a double-beam mode according to the method described in [18]. The reaction mixture contained 50 mM HEPES-NaOH (pH 7.5), 10 mM NaCl, 1% (w/v) Triton X-100, and thylakoid membranes (45 mM Chl). The differential absorption coeffi-cient used was 17.7 mM−1 cm−1 [18].
2.6. Relati6e antenna size measurement
The area over the fluorescence induction curve was measured with a laboratory-constructed ap-paratus. Green light obtained by passing light from a halogen lamp (Hayashi Tokei Kogyo, LA-150SE) through a CS 4 – 96 filter and a Toshiba O-54 cut-off filter was used for excitation. This region was used in order to excite equally both Chl
a and Chl b molecules. Actinic light intensity was varied with Toshiba neutral-density filters. Fluo-rescence was monitored at 690 nm by inserting a Toshiba R-64 red cut-off filter and a high-intensity Bausch & Lomb grating monochrometer between the sample cuvette and the photomultiplier (Hamamatsu Photonics, R928). Signals were stored in a transient recorder (Riken Denshi, TCDC-12-8000(E)) and analyzed with a computer. The two types of PS II reaction centers, the PS IIa
and PS IIb centers, were estimated by analyzing fluorescence induction curves in the presence of DCMU as described in [19,20]. The reaction medium contained 50 mM HEPES-NaOH (pH 7.5), 10 mM NaCl, 5 mM MgCl2, 20mM DCMU, and 0.4 M sucrose and thylakoid membranes (11
mM Chl).
diluted tenfold in a medium contained 50 mM HEPES-NaOH (pH 7.5), 10 mM NaCl, 5 mM MgCl2, 0.4 M sucrose, 20 mM DCMU, and 200
mM methyl viologen. The color and intensity of the actinic light were the same as that in a mea-surement of the fluorescence induction kinetics. Signals were stored in a transient recorder and analyzed with a computer.
3. Results and discussion
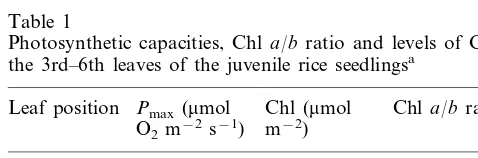
In this study, we investigated the changes in photosynthetic characteristics with depth of canopy in rice seedlings. Photosynthesis, Chl lev-els, and the Chl a/b ratio of the 3rd – 6th leaves are shown in Table 1. The rates of light-saturated photosynthesis (Pmax) decreased with the depth of the canopy except for the 5th leaves, which showed a Pmax similar to that of the 6th leaves. Chl levels were highest in the 5th leaves, and then decreased from the top to the bottom leaves. This may indicate that the 6th leaves con-tain some developing photosynthetic apparatus. As shown in Table 1, the Chl a/b ratio decreased gradually from 3.7 in the 6th leaves to 3.0 in the 3rd leaves. Although leaf senescence is primarily under genetic control, it is well established that the light environment of leaves is a major factor in the modulation of the Chl a/b and PS II/PS I ratios [2,3]. The changes in the Chl a/b and PS II/PS I ratios that occur during senescence of erect herbaceous canopy leaves must be caused mainly by shading of these leaves by upper leaves [2,3].
Levels of the PS II and PS I reaction center complexes were also affected by the light inten-sity [8,10,23,24]. These levels were quantified by measuring light-induced absorbance changes of
Table 2
Levels of the thylakoid components correlated with electron transports and the PS II/ PS I ratiosa
C-550 P-700 PS II/PS I
aAll experiments were repeated three times independently.
These values are means9S.D. of three independent experi-ments. We used about 300 leaves in one experiment.
the C-550 and P-700 using thylakoid membranes isolated from the 6th to the 3rd leaves. Mc-Cauley and Melis [17] demonstrated that C-550 measured as the index of the PS II reaction cen-ter is the electrochromic band shift of pheophytin at 550 nm and this is in proportion to the amount of QA photoreduction. Recently, many studies have been published that C-550 is mea-sured as amounts of the PS II reaction center [2,25,26]. The values obtained in this experiment are very high confidences because the value in the 6th leaves obtained here agreed with the liter-atures. The ratio of mmol C-550 to mol Chl decreased gradually from 3.2 in the 6th leaves to 2.1 in the 3rd leaves (Table 2). In contrast, irre-spective of leaf position, the levels of P-700 de-termined on the basis of Chl were approximately 2 mmol P-700 per mol Chl (Table 2). Conse-quently, the PS II/PS I ratio decreased from 1.5 in the 6th leaves to 0.9 in the 3rd leaves (Table 2).
Hikosaka [2] showed that in a vine grown horizontally to avoid mutual shading, the Chl
a/b and PS II/PS I ratios remained constant when leaves were grown without shading. This result strongly supports the hypothesis that both ratios are affected by light intensity. Light that reaches a leaf in natural shade is weak and en-riched in the far-red component of light, relative to the red component of leaves that are exposed to sunlight [27].
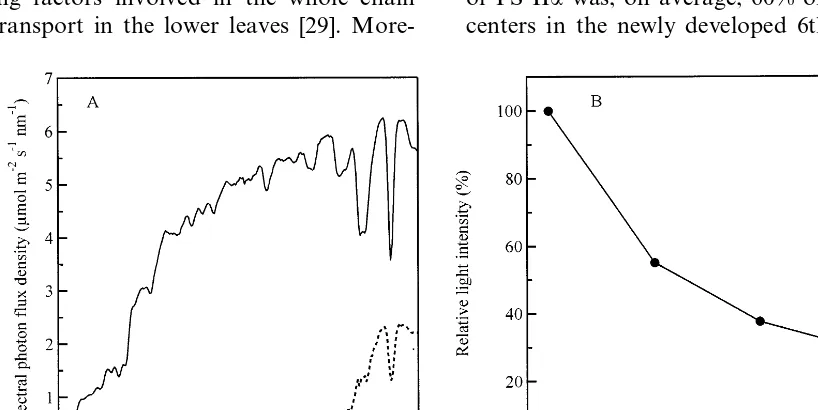
The light environment of the juvenile rice canopy is presented in Fig. 1. The light environ-ment of lower leaves, which is enriched in far-red light, indicates the absorption of red light by the upper leaves. The spectral photon distributions,
Table 1
Photosynthetic capacities, Chla/bratio and levels of Chl in the 3rd–6th leaves of the juvenile rice seedlingsa
Leaf position Pmax(mmol Chl (mmol Chla/bratio
m−2)
aAll experiments were repeated three times independently.
indicating an apparent increase in far-red light in the lower canopy, are shown in Fig. 1A. This region (over 750 nm) is not available for photo-synthesis. However, we see from Fig. 1A that the red/far-red (R/FR) ratio (650/750 nm) dropped from 100% at the 6th to 19% at the 3rd leaves. Similarly, the light intensity also decreased from 100% at the 6th leaves to 30% at the 3rd leaves (Fig. 1B). Thus, because these two factors change simultaneously, it is difficult to decide which is the dominant factor on the changes in the photosyn-thetic apparatus.
Cyt f levels per unit of Chl decreased from 2.1 in the 6th leaves to 1.4 in the 3rd leaves (Table 2). Cyt b6 also declined, but the extent of the decline was a little slower than that of Cyt f (data not shown). This indicates that the two cytochromes degraded in the lower leaves. The observed de-clines in the levels of Cyt f also indicate that the thylakoid components are influenced by irradi-ance, as plants grown in weak light had reduced levels of Cyt f than did plants grown in stronger light [5,6,23,24,28].
Whole chain electron transport activity, deter-mined on the basis of Chl content, slightly de-creased from the upper to the lower leaves (Table 3). On the other hand, the rates of electron trans-port activity expressed on the basis of Cyt f re-mained fairly constant at all leaf positions (Table 3), implying that the Cytb6/f complexes are one of the limiting factors involved in the whole chain electron transport in the lower leaves [29].
More-over, as shown in Table 3, there were also no significant decreases in PS II electron transport expressed on the basis of C-550 in the depth of the canopy. Chow and Anderson [30] suggested that Cyt b6/f complex and plastoquinone limit Pmax. Consequently, because the degradation of the thy-lakoid components is complex, it is not easy to decide on the site of the limitation.
As stated in the Introduction, the PS II reaction center is heterogeneous. In terms of both function and antenna size, there are two types of PS II centers, namely PS IIa, which has a large antenna and is active in electron transport, and PS IIb, which has a small antenna and is unable to reduce
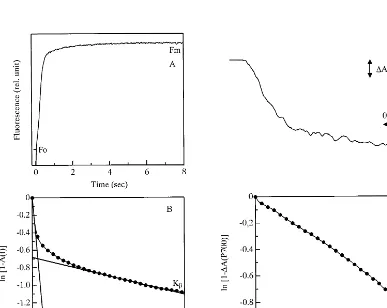
QB [12,13]. As a result of the large difference in antenna size, photoreduction of QA in PS IIa proceeds more rapidly than that in PS IIb under irradiation with limited-intensity light in the DCMU-poisoned thylakoids. Thus, the percentage of abundance of PS II reaction centers can be kinetically distinguished as functional or non-func-tional in electron transport by measuring the rate constant of photoreduction of QAthrough growth of the area over the fluorescence induction curve. Ka and Kb stand for the rate constants of the PS IIa and PS IIb centers, respectively, and the slope of the fast phase represents the rate constant of the a center, namely Ka, and the slow phase represents that of the bcenter, Kb(Fig. 2; see refs. [19,20]). Table 4 shows that the relative abundance of PS IIa was, on average, 60% of the total PS II centers in the newly developed 6th leaves.
Table 3
Whole chain electron transport activities expressed on Chl and Cyt f, and PS II activities expressed on C-550a
Leaf position PS II+PS I [mmol O2 Whole chain [mmol O2 PS II activity [mmol O2
(mol Cytf)(1s(1] (mol C-550)(1s(1]
(mol Chl)(1 s(1]
28.497.1
6th 58.495.5 29.298.2
5th 51.094.3 31.296.2 30.895.8
a All experiments were repeated three times independently. These values are means9S.D. of three independent experiments.
We used about 300 leaves in one experiment.
fore, when only the PS II centers that are func-tional in electron transport are taken into ac-count, the PS IIa/PS I ratio is 0.9 in the 6th leaves. The percentage of PS IIa gradually in-creased from the top to the bottom leaves and was 70% in the 3rd leaves. Thus, the decline in the PS IIa/PS I ratio (Table 4) was smaller than
that in the total PS II/PS I ratio (Table 2). There was also a small but significant decline in Ka
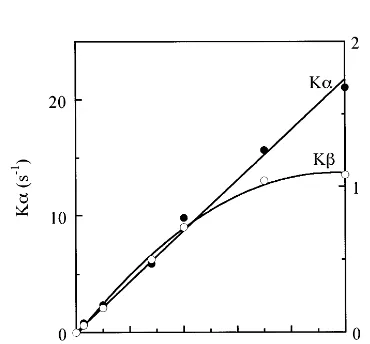
from the upper to the lower leaves. As shown in Fig. 3, Ka can be used as a measure of antenna size because Ka increased linearly with the inten-sity of excitation light. In contrast, Kb did not increase linearly with light intensity but became saturated at about 100 mmol m−2 s−1. This im-plies that the rate constant of QA photoreduction can be used as a measure of the antenna size only in PS IIa. The antenna size of PS IIb may be estimated by measuring the initial slope of the light-response curve at a light intensity of zero, and hence the antenna size of PS IIb determined at a definite intensity of light is an underestimate. Various hypothesises at present are submitted about inactive PS II centers. Hsu and Lee [31] observed that the rate constants of slow phases of QA photoreduction were independent of light intensity. In their experiment, however, actinic light might have already saturated for the mea-surement of the PS IIb. On the other hand, by using Chl b-less rice mutant, chlorina-2, carrying only PS IIb, Terao et al. [32] showed that a half of the total PS II centers are active in electron transport by flash induced oxygen evolution. Re-cently, Tsurumi and Katoh revealed that the rest of the PS II centers, i.e. inactive PS II, serve as an antenna of the active PS II centers (personal communication). Therefore, because PS IIb is defined differently in various plant systems, we followed to the literatures of [32] and [33] in the present study.
The relative antenna size of PS I was deter-mined by measuring the kinetics of P-700 pho-tooxidation with the same excitation light as that used for fluorescence measurement (Fig. 2C, D). The rate constant of P-700 photooxidation (KI) was linear to the intensity of the excitation light (data not shown). KI decreased from the 6th to the 3rd leaves and it was smaller than Ka, i.e. the antenna size of PS I is smaller than that of PS IIa, at all leaf positions (Table 4).
Comparing Kawith KI, both levels decreased in parallel with leaf order from upper to lower leaves (Table 4). Ka and the levels of C-550 per unit of Chl decreased, while the abundance of only PS IIa
deter-minant of the arrangements of the photosynthetic apparatus.
The present work indicates that the Chl a/band PS II/PS I ratios decreased gradually with the depth of the canopy. The most important part of this paper is that this experiment indicates that the decline in the PS II/PS I ratio resulting from the low-light environment is partly compensated for by an increase in the abundance of PS IIa centers which are associated with a large amount of LHC II and which avoid minimally an imbalance of light absorption by the two photosystems. Thus, the decrease of the Chl a/b ratio paralleled the increase of PS IIa centers. However, to drive electron transport effectively, both photosystems have to absorb light equally. Indeed, when we calculated the electron transport capacity between the two photosystems based on the equations de-scribed in [34], the capacity in the 6th leaves was 1.5-times larger than that in the 3rd leaves [35]. As a result, large imbalances occur between the two
photosystems. Nevertheless we considered a state transition at first, it did not involve in the energy deployment (data not shown). Accordingly, this apparent anomaly is currently being investigated.
Acknowledgements
We express our thanks to the former Prof. Sakae Katoh for his critical comments and discus-sions throughout this work. We are grateful to Drs H. Ikeda and N. Matsushita, Arboricultural Research Institute, Faculty of Agriculture, Tokyo University Forests, for renting a Li-Cor model LI-1800 spectroradiometer. We also thank to Mr Takenobu Yamasaki for his fruitful advice and comments, and to my laboratory associates for excellent technical assistance and kind help. Fi-nally, we would like to dedicate this paper to the mentor Prof. Sakae Katoh to commemorate his retirement from Toho University.
Table 4
Relative abundances of PS IIaand PS IIband the rate constants of PS IIa, PS IIband PS I in the 3rd–6th leaves of the juvenile rice seedlingsa
PS IIb (%) Ka (s−1)
Leaf position PS IIa (%) KI (s−1) PS IIa/PS I
39.990.8 15.790.6 9.890.2 0.92
6th 60.190.8
37.190.4 13.390.8
62.990.4 8.890.4
5th 0.89
33.990.5 12.890.3 7.390.3 0.73
4th 66.290.5
30.190.6 11.190.7 6.990.2 0.69 69.990.6
3rd
aAll experiments were repeated three times independently. These values are means9S.D. of three independent experiments. We
used about 300 leaves in one experiment.
Fig. 3. Light-response curves of the rate constants of QA
photoreduction. , the rate constants of PS IIa;, those of
PS IIb.
stoichiometry, chlorophyll a and chlorophyll b content and relation to chloroplast ultrastructure, Biochim. Biophys. Acta 637 (1981) 138 – 145.
[8] W.-J. Lee, J. Whitmarsh, Photosynthetic apparatus of pea thylakoid membranes. Response to growth light intensity, Plant Physiol. 89 (1989) 932 – 940.
[9] J.H. Kim, R.E. Glick, A. Melis, Dynamics of photo-system stoichiometry adjustment by light quality in chloroplasts, Plant Physiol. 102 (1993) 181 – 190. [10] K.O. Burkey, R. Wells, Effects of natural shade on
soybean thylakoid membrane composition, Photosynth. Res. 50 (1996) 149 – 158.
[11] A. Melis, A. Murakami, J.A. Nemson, K. Aizawa, K. Ohki, Y. Fujita, Chromatic regulation in Chlamy
-domonas reinhardtii alters photosystem stoichiometry and improves the quantum efficiency of photosynthesis, Photosynth. Res. 47 (1996) 253 – 265.
[12] A. Melis, Dynamics of photosynthetic membrane com-position and function, Biochim. Biophys. Acta 1058 (1991) 87 – 106.
[13] J. Lavergne, Two types of primary acceptors in chloro-plasts photosystem II. 1. Different recombination prop-erties, Photobiochem. Photobiophys. 3 (1982) 257 – 271. [14] R.J. Porra, W.A. Thompson, P.E. Lriedemann,
Deter-mination of accurate extinction coefficients and simul-taneous equations for assaying chlorophyll a and b
extracted with four different solvents: verification of the concentration of chlorophyll standards by atomic absorption spectroscopy, Biochim. Biophys. Acta 975 (1989) 384 – 394.
[15] T. Hiyama, B. Ke, Different spectra and excitation co-efficients of P-700, Biochim. Biophys. Acta 267 (1972) 160 – 171.
[16] D.B. Knaff, D.I. Arnon, Spectral evidence for a new photoreactive component of the oxygen-evolving system in photosynthesis, Proc. Natl. Acad. Sci. USA 63 (1969) 963 – 969.
[17] S.W. McCauley, A. Melis, Quantitation of photosystem II in spinach chloroplasts, Biochim. Biophys. Acta 849 (1986) 175 – 182.
[18] D.S. Bendall, H.N. Davenport, R. Hill, Cytochrome components in chloroplasts of the higher plants, Method Enzymol. 23 (1971) 327 – 344.
[19] A. Melis, P.H. Homann, Kinetic analysis of the fluorescence induction in 3-(3,4-dichlorophenyl)-1,1-dimethylurea poisoned chloroplasts, Photochem. Photo-biol. 21 (1975) 431 – 437.
References
[1] M. Monsi, T. Saeki, U8ber den Lichtfaktor in den Pflanzengesellschaften und seine Bedeutung fu¨r die St-offproduction, Jpn. J. Bot. 14 (1953) 22 – 52.
[2] K. Hikosaka, Effects of leaf age, nitrogen nutrition and photon flux density on the organization of the photosynthetic apparatus in leaves of a vine (Ipomoea tricolor Cav.) grown horizontally to avoid mutual shading of leaves, Planta 198 (1996) 144 – 150.
[3] K. Okada, S. Katoh, Two long-term effects of light that control the stability of proteins related to photo-synthesis during senescence of rice leaves, Plant Cell Physiol. 39 (1998) 394 – 404.
[4] M. Kura-Hotta, K. Satoh, S. Katoh, Relationship be-tween photosynthesis and chlorophyll content during leaf senescence of rice seedlings, Plant Cell Physiol. 28 (1987) 1321 – 1329.
[5] T.-Y. Leong, J.M. Anderson, Adaptation of the thy-lakoid membranes of pea chloroplasts to light intensi-ties. 1. Study on the distribution of chlorophyll-protein complexes, Photosynth. Res. 5 (1984) 105 – 115.
[6] W.R. De la Torre, K.O. Burkey, Acclimation of barley to changes in light intensity: chlorophyll organization, Photosynth. Res. 24 (1990) 117 – 125.
[20] A. Melis, P.H. Homann, Heterogeneity of the photo-chemical centers in system II of chloroplasts, Photochem. Photobiol. 23 (1976) 343 – 350.
[21] A. Melis, Kinetics analysis of P-700 photoconversion: effect of secondary electron donation and plastocyanin inhibition, Arch. Biochem. Biophys. 217 (1982) 536 – 545. [22] P. Svensson, E. Andreasson, P.-A,. Albertsson, Hetero-geneity among photosystem I, Biochim. Biophys. Acta 1060 (1991) 45 – 50.
[23] T.-Y. Leong, J.M. Anderson, Adaptation of the thy-lakoid membranes of pea chloroplasts to light intensities. 2. Regulation of electron transport capacities, electron carriers, coupling factor (CF1) activity and rates of pho-tosynthesis, Photosynth. Res. 5 (1984) 117 – 128. [24] W.R. De la Torre, K.O. Burkey, Acclimation of barley
to changes in light intensity: photosynthetic electron transport activity and components, Photosynth. Res. 24 (1990) 127 – 136.
[25] S. Funayama, K. Sonoike, I. Terashima, Photosynthetic properties of leaves ofEupatorium makinoiinfected by a geminivirus, Photosynth. Res. 53 (1997) 253 – 261. [26] K. Hikosaka, I. Terashima, Nitrogen partitioning among
photosynthetic components and its consequence in sun and shade plants, Func. Ecol. 10 (1996) 335 – 343. [27] M.C. Rousseaux, A.J. Hall, R.A. Sa´nchez, Far-red
en-richment and photosynthetically active radiation level influence leaf senescence in field-grown sunflower, Phys-iol. Plant. 96 (1996) 217 – 224.
[28] E.H. Murchie, P. Horton, Contrasting patterns of photo-synthetic acclimation to the light environment are
depen-dent on the differential expression of the responses to altered irradiance and spectral quality, Plant, Cell Envi-ron. 21 (1998) 139 – 148.
[29] P.J. Holloway, D.J. Maclean, Rate-limiting steps of elec-tron transport in chloroplasts during ontogeny and senescence of barley, Plant Physiol. 72 (1983) 795 – 801. [30] W.S. Chow, J.M. Anderson, Photosynthetic responses of
Pisum sati6umto an increase in irradiance during growth
1. Photosynthetic activities, Aust. J. Plant Physiol. 14 (1987) 1 – 8.
[31] B.-D. Hsu, J.-Y. Lee, A study on the fluorescence induc-tion curve of the DCMU-poisoned chloroplast, Biochim. Biophys. Acta 1056 (1991) 285 – 292.
[32] T. Terao, K. Sonoike, J. Yamazaki, Y. Kamimura, S. Katoh, Stoichiometries of photosystem I and photosys-tem II in rice mutants differently deficient in chlorophyll
b, Plant Cell Physiol. 37 (1996) 299 – 306.
[33] A. Melis, Functional properties of photosystem IIb in spinach chloroplasts, Biochim. Biophys. Acta 808 (1985) 334 – 342.
[34] A. Melis, J.M. Anderson, Structural and functional orga-nization of the photosystems in spinach chloroplasts. Antenna size, relative electron-transport capacity, and chlorophyll composition, Biochim. Biophys. Acta 724 (1983) 473 – 484.
[35] J. Yamazaki, Y. Kamimura, Y. Sugimura, Changes in photosynthetic apparatus in the juvenile rice canopy and a possible function of photosystem I in the bottom leaves, Z. Naturforsch. 54c (1999) in press.