PT Reasuransi MAIPARK Indonesia
i
Dengan Hormat,
Sesuai dengan tujuan pendirian MAIPARK,
MAIPARK selalu berupaya untuk memberikan
pelayanan yang terbaik bagi Industri Asuransi
Umum di Indonesia khususnya mengenai
statistik dan pengetahuan risiko gempa bumi.
Dukungan dari seluruh perusahaan asuransi
umum sangat berarti bagi kami dalam upaya
pengembangan Laporan Statistik ini.
Kami berharap Laporan Statistik ini dapat
memberikan manfaat tidak hanya bagi
perusahaan yang menangani asuransi gempa
bumi, namun juga bagi industri asuransi umum
di Indonesia.
Hormat kami,
Dear Sir / Madam,
In line with the purpose of MAIPARK
establishment, MAIPARK always strive to
provide the best service for General Insurance
Industry in Indonesia particularly regarding
statistic and knowledge of Earthquake risks.
Support from the General Insurance Industry will
be meaningful to us in order to improve this
Statistic Report.
We hope this Statistic Report will be beneficial
not only to the insurance companies which write
earthquake insurance but also to the whole
general insurance industry in Indonesia.
Sincerely,
Kata Pengantar
Foreword
ii
Hal.
Kata Pengantar ... i
Daftar Isi ... ii
Informasi Statistik ... vii
Ikhtisar Statistik Asuransi Gempa Bumi
Indonesia Desember 2014 ...
A. Umum ... 1
B. Struktur Pasar ... 1
C. Premi Bruto ... 1
D. Jumlah Risiko ... 3
E. Incurred Claim ... 4
Exposure Asuransi Gempa Bumi Indonesia ...
Tabel 2.1. Exposure Per Cresta Zone ... 9
Tabel 2.2. Exposure Per Okupasi ... 11
Tabel 2.3. Exposure Per Interest... 13
Tabel 2.4. Exposure Per Provinsi ... 15
Premi Bruto Asuransi Gempa Bumi Indonesia
...
….
Tabel 3.1. Gross Premium Per Cresta Zone .. 16
Tabel 3.2. Gross Premium Per Okupasi ... 18
Tabel 3.3. Gross Premium Per Provinsi ... 20
Jumlah Risiko Asuransi Gempa Bumi Indonesia
...
Tabel 4.1. Jumlah Risiko Per Cresta Zone ... 21
Tabel 4.2. Jumlah Risiko Per Okupasi ... 23
Klaim Asuransi Gempa Bumi Indonesia ...
Tabel 5.1. Klaim Frekwensi Per Okupasi ... 25
Tabel 5.2. Klaim Frekwensi Per Cresta Zone . 27
Tabel 5.3. Klaim Per Okupasi ... 29
Tabel 5.4. Klaim Per Cresta Zone ... 31
Page
Foreword ... i
Contents ... ii
Statistic Information ... vii
Statistic Overview of Indonesian Earthquake
Insurance December 2014 ...
A. General ... 1
B. Market Structure ... 1
C. Gross Premium ... 1
D. Number of Risk ... 3
E. Incurred Claim ... 4
Indonesian Earthquake Insurance Exposure ...
Table 2.1. Exposure By Cresta Zone ... 9
Table 2.2. Exposure By Occupation ... 11
Table 2.3. Exposure By Interest ... 13
Table 2.4. Exposure By Province ... 15
Indonesian
Earthquake
Insurance
Gross
Premium ...
Table 3.1. Gross Premium By Cresta Zone ... 16
Table 3.2. Gross Premium By Occupation .... 18
Table 3.3. Gross Premium By Province ... 20
Indonesian Earthquake Insurance Number of
Risks ...
Table 4.1. Number of Risk By Cresta Zone ... 21
Table 4.2. Number of Risk By Occupation .... 23
Indonesian Earthquake Insurance Claim ...
Table 5.1. Claim Frequency By Occupation .. 25
Table 5.2. Claim Frequency By Cresta Zone .. 27
Table 5.3. Claim By Occupation . ... 29
Table 5.4 Claim By Cresta Zone ... 31
Daftar Isi
iii
Profil Risiko dan Klaim ...
Underwriting Year 2010 - 2014,
Seluruh Okupasi ... 33
Underwriting Year 2014, Seluruh Okupasi ... 34
Underwriting Year 2013, Seluruh Okupasi ... 35
Underwriting Year 2012, Seluruh Okupasi ... 36
Underwriting Year 2011, Seluruh Okupasi ... 37
Underwriting Year 2010, Seluruh Okupasi ... 38
Profil Risiko dan Klaim
Underwriting Year
2014
Per Okupasi ...
Okupasi Agrikultural ... 39
Okupasi Komersial ... 40
Okupasi Industrial ... 41
Okupasi Residensial ... 42
Profil Risiko dan Klaim
Underwriting Year
2013
Per Okupasi ...
Okupasi Agrikultural ... 43
Okupasi Komersial ... 44
Okupasi Industrial ... 45
Okupasi Residensial ... 46
Profil Risiko dan Klaim
Underwriting Year
2012
Per Okupasi ...
Okupasi Agrikultural ... 47
Okupasi Komersial ... 48
Okupasi Industrial ... 49
Okupasi Residensial ... 50
Profil Risiko dan Klaim
Underwriting Year
2011
Per Okupasi ...
Okupasi Agrikultural ... 51
Okupasi Komersial ... 52
Okupasi Industrial ... 53
Okupasi Residensial
... 54
Risk and Loss Profile ...
Underwriting
Year
2010
-
2014,
All Occupation ... 33
Underwriting Year 2014, All Occupation ... 34
Underwriting Year 2013, All Occupation ... 35
Underwriting Year 2012, All Occupation ... 36
Underwriting Year 2011, All Occupation ... 37
Underwriting Year 2010, All Occupation ... 38
Risk and Loss Profile Underwriting Year 2014
By Occupation
….
...
Agricultural Occupation ... 39
Commercial Occupation ... 40
Industrial Occupation ... 41
Residential Occupation ... 42
Risk and Loss Profile Underwriting Year 2013
By Occupation
….
...
Agricultural Occupation ... 43
Commercial Occupation ... 44
Industrial Occupation ... 45
Residential Occupation ... 46
Risk and Loss Profile Underwriting Year 2012
By Occupation
….
...
Agricultural Occupation ... 47
Commercial Occupation ... 48
Industrial Occupation ... 49
Residential Occupation ... 50
Risk and Loss Profile Underwriting Year 2011
By Occupation
….
...
Agricultural Occupation ... 51
Commercial Occupation ... 52
Industrial Occupation ... 53
iv
Profil Risiko dan Klaim
Underwriting Year
2010
Per Okupasi ...
Okupasi Agrikultural ... 55
Okupasi Komersial... 56
Okupasi Industrial ... 57
Okupasi Residential ... 58
Exposure, Premi Bruto, Jumlah Risiko dan Klaim
Asuransi Gempa Bumi Indonesia ...
Exposure, Premi Bruto, Jumlah Risiko & Klaim
per Cresta Zone, Underwriting Year 2010 .... 59
Exposure, Premi Bruto, Jumlah Risiko & Klaim
per Cresta Zone, Underwriting Year 2011 ... 60
Exposure, Premi Bruto, Jumlah Risiko & Klaim
per Cresta Zone, Underwriting Year 2012 ... 61
Exposure, Premi Bruto, Jumlah Risiko & Klaim
per Cresta Zone, Underwriting Year 2013
... 62
Exposure, Premi Bruto, Jumlah Risiko & Klaim
per Cresta Zone, Underwriting Year 2014
... 63
Exposure, Premi Bruto, Jumlah Risiko dan Klaim
Asuransi Gempa Bumi Indonesia ...
Exposure, Premi Bruto, Jumlah Risiko & Klaim
per Okupasi, Underwriting Year 2010 ... 64
Exposure, Premi Bruto, Jumlah Risiko & Klaim
per Okupasi, Underwriting Year 2011 ... 65
Exposure, Premi Bruto, Jumlah Risiko & Klaim
per Okupasi, Underwriting Year 2012 ... 66
Exposure, Premi Bruto, Jumlah Risiko & Klaim
per Okupasi, Underwriting Year 2013
... 67
Exposure, Premi Bruto, Jumlah Risiko & Klaim
per Okupasi, Underwriting Year 2014
... 68
Risk and Loss Profile Underwriting Year 2010
By Occupation ...
Agricultural Occupation ... 55
Commercial Occupation ... 56
Industrial Occupation ... 57
Residential Occupation ... 58
Indonesian Earthquake Insurance Exposure,
Gross Premium, Number of Risks and Claim ...
Exposure, Gross Premium, Number of Risks &
Exposure, Gross Premium, Number of Risks &
Claim by Cresta Zone, UY 2013 ... 62
Exposure, Gross Premium, Number of Risks &
Claim by Cresta Zone, UY 2014 ... 63
Indonesian Earthquake Insurance Exposure,
Gross Premium, Number of Risks and Claim ...
Exposure, Gross Premium, Number of Risks &
Claim by Occupation,
UY
………
..64
Exposure, Gross Premium, Number of Risks &
Claim by Occupation, UY 2011 ... 65
Exposure, Gross Premium, Number of Risks &
Claim by Occupation, UY 2012 ... 66
Exposure, Gross Premium, Number of Risks &
Claim by Occupation,
UY
2013
... 67
v
Exposure, Premi Bruto, Jumlah Risiko dan Klaim
Asuransi Gempa Bumi Indonesia ...
Exposure, Premi Bruto, Jumlah Risiko & Klaim
per Provinsi, Underwriting Year 2010 ... 69
Exposure, Premi Bruto, Jumlah Risiko & Klaim
per Provinsi, Underwriting Year 2011 ... 70
Exposure, Premi Bruto, Jumlah Risiko & Klaim
per Provinsi, Underwriting Year 2012 ... 71
Exposure, Premi Bruto, Jumlah Risiko & Klaim
per Provinsi, Underwriting Year 2013
... 72
Exposure, Premi Bruto, Jumlah Risiko & Klaim
per Provinsi, Underwriting Year 2014
... 73
Peta
Distribusi Exposure Gempa Bumi Indonesia per
Provinsi,
Underwriting Year
2014, per 31
Desember 2014
……..
... 74
Distribusi Gempa Bumi Indonesia M > 5 dan
Claim Incurred
2014
……
... 75
Distribusi Exposure Gempa Bumi Indonesia per
Provinsi, Underwriting Year 2014, per 31
Desember 2014, Distribusi Gempa Bumi
Indonesia M > 5 dan Claim Incurred UY
4.
Tabel jangka Waktu Pertanggungan
Kurang Dari Satu Tahun ... 94
5.
Skala Indemnity Period ... 95
6.
Tabel
Cresta Zo e da Zo a ………..9
Indonesian Earthquake Insurance Exposure,
Gross Premium, Number of Risks and Claim ...
Exposure, Gross Premium, Number of Risks &
Exposure, Gross Premium, Number of Risks &
Claim by Province,
UY
2013
... 72
Exposure, Gross Premium, Number of Risks &
Claim by Province,
UY
2014
... 73
Map
Indonesian Earthquake Exposure Distribution
By Province, Underwriting Year 2014, as at 31
December 2014 ... 74
Indonesian Earthquake Distribution M > 5 and
Claim Incurred 2014
………
..
…
.. ... 75
Indonesian Earthquake Exposure Distribution
By Province, Underwriting Year 2014, as at 31
December
2014,
Indonesian
Earthquake
Distribution M > 5 and Claim Incurred 2014..
2.
Indonesian Earthquake Insurance Tariff ..
... 91
3.
First Loss Scale ...
………9
4.
Short Period Table Less Than One Year
vi
Referensi
1.
Otoritas Jasa Keuangan (OJK).
2.
Badan Pusat Statistik (BPS).
*)
Laporan Statistik ini dapat diperoleh di website
PT Reasuransi MAIPARK Indonesia
www.maipark.com
Reference
1.
Financial Services Authority (OJK).
2.
Central of Statistics Bureau (BPS).
*)
Statistic Report is available on PT Reasuransi
MAIPARK Indonesia‘s
Website
vii
1.
Statistik dibuat berdasarkan
Underwriting
Year
yang tercatat sampai dengan posisi
31 Desember 2014.
2.
Sesi Limit
2.1.
Limit Sesi atas setiap risiko (
any
one risk
) untuk gabungan kerugian
fisik dan gangguan usaha adalah
pertanggungan (
total
sum
insured
)
pertanggungan (
total
sum
insured
)
puluh delapan Dollar
Amerika) atas setiap
risiko,
setiap
perusahaan asuransi
atau penerbit polis
1.
Statistic Report is based on Underwriting
Year basis, which is recorded as at 31
December 2014.
2.
Cession Limit
2.1.
Cession Limit of any one risk for the
combined material damage and
business interruption are as follows:
2.1.1
For West Java, Banten and
DKI:
thirty one thousand five
hundred seventy eight
U.S. Dollars) for any
one
risk,
each
insurance company or
policy
issuer
for
Underwriting
Year
2013.
viii
Untuk
Underwriting
Year
2013.
2.1.2
Untuk daerah Indonesia
lainnya:
25% (dua puluh lima
prosen) dari jumlah
seluruh
pertanggungan (
total
sum
insured
)
pertanggungan (
total
sum
insured
)
puluh delapan Dollar
Amerika) atas setiap
2014 Limit Sesi atas setiap
risiko (any one risk) untuk
gabungan kerugian fisik
dan
gangguan
usaha
adalah 15% (lima belas
prosen)
dari
jumlah
seluruh
pertanggungan
(
total sum insured
)
2.1.2.
For other Indonesia areas:
25%
(twenty
five
percent) of the total
sum insured, being a
maximum
of
USD
2,500,000.00
(two
million five hundred
thousand U.S. Dollars)
for any one risk, each
insurance company or
policy
issuer
for
Underwriting
Year
2010, 2011 and 2012.
ix
maksimum
USD
3,500,000.00 (tiga juta lima
ratus ribu Dollar Amerika)
atas setiap risiko, setiap
perusahaan asuransi atau
penerbit
polis
untuk
Underwriting
Year
2014.
2.2 Yang dimaksud dengan setiap risiko
(
anyone risk
) adalah akumulasi
(
aggregate
)
jumlah
harga
pertanggungan seluruh risiko pada
lokasi yang sama untuk
masing-masing
perusahaan
asuransi.
Definisi setiap risiko atau setiap
lokasi ditentukan oleh perusahaan
asuransi dalam
underwriting
polis
kebakaran
2.3
Dalam hal penutupan secara
First
Loss Basis / Sub-limit
, jumlah yang
disesikan
sebagaimana
diatur
dalam butir 2.1 diatas, dikalikan
prosentase
First Loss Scale
.
2.4
Untuk risiko yang ditutup secara
ko-asuransi, jumlah maksimum sesi
dari semua anggota ko-asuransi
adalah sesuai dengan ketentuan
yang diatur dalam 2.1 diatas. Sesi
masing-masing perusahaan adalah
proporsional sebanding sahamnya
dalam ko-asuransi.
Dalam hal terdapat penutupan lain
selain polis ko-asuransi tersebut
pada obyek pertanggungan yang
sama, perusahaan asuransi tetap
dapat mensesikan risiko dimaksud,
dengan catatan jumlah seluruh sesi
perusahaan
asuransi
bersangkutan
tidak
melebihi
ketentuan yang diatur pada butir
2.1.
USD 3,500,000.00 (three
million
five
hundred
thousand U.S. Dollars) for
any
one
risk,
each
insurance company or
policy
issuer
for
Underwriting Year 2014.
2.2 Anyone risk is the accumulation
(aggregate) of total sum insured of
all risks at the same location for
each insurance company. The
definition of anyone risk or any
location is specified by the insurer
or policy issuer in accordance with
the fire underwriting policy.
2.3
In First Loss Basis / Sub Limit
policies, the amount ceded is
stipulated in point 2.1 above, then
multiplied by the percentage of First
Loss Scale.
2.4
For risks which are covered by
co-insurance, the maximum cession
from all members of coinsurance is
stipulated in point 2.1 above. Each
ceding
company
cedes
proportionally depending on its
co-insurance share.
If there are policies other than
co-insurance policy on the same
insured object, the insurer is still able
to cede such risk subject to total
x
3.
Tarif Premi Asuransi Gempa Bumi
Indonesia
3.1. Penutupan
Full Value Basis
mengaplikasikan
Tarif
Premi
Standar Gempa Bumi Indonesia
(lampiran 2).
3.2. Penutupan
First Loss / Sub Limit
Basis
mengaplikasikan standar
First Loss Scale
(lampiran 3).
3.3. Perhitungan
premi
untuk
penutupan kurang dari 12 (dua
belas) bulan diberlakukan skala
premi jangka pendek (lampiran 4)
3.4. Untuk perhitungan
premi Business
Interruption
diberlakukan
Indemnity
Period Scale
(lampiran 5).
4.
Obyek Pertanggungan
4.1 Obyek pertanggungan yang dapat
disesikan
adalah
obyek
pertanggungan asuransi kebakaran
4.2 Penutupan sebagaimana dimaksud
pada butir 4.1. adalah yang ditutup
secara langsung (
direct business
)
termasuk ko-asuransi. Penutupan
tidak langsung (
indirect business /
reasuransi) tidak dapat disesikan.
3.
Indonesian
Standard
Earthquake
Premium Tariff
3.1.
For the coverage of Full Value
Basis, apply Indonesian Standard
Earthquake
Premium
Tariff
(attachment 2).
3.2.
For the First Loss / Sub Limit Basis
coverage apply standard First Loss
Scale (attachment 3).
3.3.
Premium calculation for short
period coverage is based on Short
Period Scale (attachment 4).
3.4.
Premium calculation for business
interruption is based on Indemnity
Period Scale (attachment 5).
4.
Insured Object
4.1.
Insured object which can be ceded
is fire insurance object such as:
4.1.1.
Material damage:
xi
5.
Pelaporan Bordero
Pelaporan bordero dilakukan setiap
bulannya untuk semua risiko yang ditutup
pada bulan yang bersangkutan dan sudah
harus diterima selambat-lambatnya pada
akhir bulan berikutnya
5.
Bordereaux Submission
1
A.
Umum
Berdasarkan data Badan Pusat Statistik,
Perekonomian Indonesia pada tahun 2014
sebagaimana diukur dari Produk Domestik
Bruto
(PDB),
tumbuh
sebesar
5,02%
dibandingkan tahun 2013. Nilai Produk
Domestik Bruto (PDB) Indonesia atas dasar
harga konstan 2010 pada tahun 2014 mencapai
Rp.8.568,1 triliun sedangkan pada tahun 2013
sebesar
Rp.8.158,2
triliun.
Bila
dilihat
berdasarkan harga berlaku, PDB tahun 2014
adalah sebesar Rp.10.542,7 triliun sedangkan
tahun 2013 adalah Rp.9.524,7triliun.
B. Struktur Pasar
Berdasarkan data Otoritas Jasa Keuangan
pada buku Direktori Perasuransian Indonesia
2014:
Industri
Keuangan
Non
Bank
Perasuransian,
terdapat
82
perusahaan
asuransi umum yang memiliki izin beroperasi di
Indonesia.
C. Premi Bruto
Sampai dengan 31 Desember 2014, premi
bruto asuransi gempa bumi
Underwriting Year
2010 adalah sebesar Rp.
2.116,7
miliar. Premi
bruto untuk
Underwriting Year
2011 tercatat
A. General
Based on Central of Statistics Bureau Data,
Indonesian economic in 2014 as measured by
Gross Domestic Product (GDP) increased by
5.02% compared with 2013. Gross Domestic
Product (GDP) based on Constant Price 2010 in
2014 reached the amount of Rp.8,568.1 trillion
while in 2013 was Rp.8,152.2 trillion. If it is
based on Current Market Price, GDP in 2014
was Rp.10,542.7 trillion while in 2013 was
Rp.9,524.7trillion
B. Market Structure
Based on Financial Services Authority data
in the book of Indonesian Insurance Directory
2014: Non Bank Financial Institution Insurance,
there are 82 general insurers having operating
licenses in Indonesia.
C. Gross Premium
As at 31 December 2014, earthquake gross
premium for Underwriting Year 2010 was Rp.
2,116.7 billion. Gross premium for Underwriting
Year 2011 was recorded
Ikhtisar Statistik Asuransi Gempa Bumi Indonesia Juni 2014
2
Rp.
2.814,2
miliar,
sedangkan
untuk
Underwriting Year
2012 adalah Rp. 2.641,6
miliar. Untuk
Underwriting Year
2013 dan 2014
adalah Rp. 4.251,6 miliar dan Rp. 2.363,3 miliar.
Angka
–
angka ini akan terus bergerak naik
terutama untuk
Underwriting Year
2013 dan
2014.
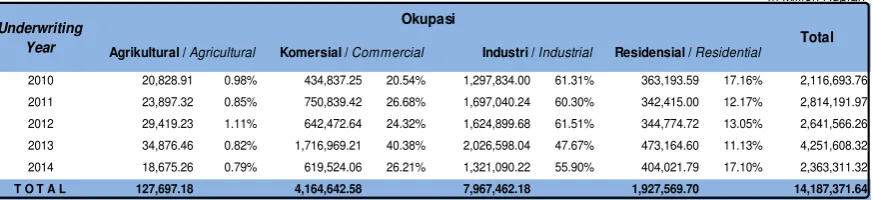
Tabel 1.1 di bawah ini menyajikan rincian
premi bruto berdasarkan jenis okupasi dari
Underwriting Year
2010 hingga
Underwriting
Year
2014. Prosentase okupasi Industrial selalu
berada pada posisi pendapatan tertinggi
dibanding 3 (tiga) okupasi lainnya (Agrikultural,
Komersial, Residensial), yaitu di atas 47% dari
total premi.
Meskipun okupasi Komersial, Residensial
dan Agrikultural tidak memberikan kontribusi
premi sebesar okupasi Industrial, namun ketiga
okupasi tersebut memperlihatkan pertumbuhan
premi yang cukup signifikan. Hal ini terlihat
terutama pada premi okupasi Komersial pada
Underwriting Year
2011 yang meningkat
sebesar 72,67% dari Rp. 434.837,25 juta di
Underwriting Year 2010
menjadi Rp. 750.839,42
juta.
Rp. 2,814.2
billion, while for Underwriting Year
2012 was Rp. 2,641.6 billion. For Underwriting
Year 2013 and 2014 were Rp. 4,251.6
billion
and Rp. 2,363.3
billion.
These figures would
certainly increase especially for Underwriting
Year 2013 and 2014.
The table 1.1 below shows the details of
gross premium based on occupation from
Underwriting Year 2010 to Underwriting Year
2014. Industrial occupation always has the
biggest percentage income compared to 3
(three) remaining occupations (Agricultural,
Commercial, Residential), that is above 47 %
from premium total.
Although occupation of Commercial,
Residential and Agricultural do not contribute
premium as much as Industrial occupation,
those three occupation show significant
premium growth. In this case, the premium
under Commercial occupation in Underwriting
Year 2011 increased by 72.67% from Rp.
434,837.25 million in Underwriting Year 2010 to
Rp. 750,839.42 million.
Dalam Jutaan Rupiah
In Million Rupiah
2010 20,828.91 0.98% 434,837.25 20.54% 1,297,834.00 61.31% 363,193.59 17.16% 2,116,693.76 2011 23,897.32 0.85% 750,839.42 26.68% 1,697,040.24 60.30% 342,415.00 12.17% 2,814,191.97 2012 29,419.23 1.11% 642,472.64 24.32% 1,624,899.68 61.51% 344,774.72 13.05% 2,641,566.26 2013 34,876.46 0.82% 1,716,969.21 40.38% 2,026,598.04 47.67% 473,164.60 11.13% 4,251,608.32 2014 18,675.26 0.79% 619,524.06 26.21% 1,321,090.22 55.90% 404,021.79 17.10% 2,363,311.32 T O T A L 127,697.18 4,164,642.58 7,967,462.18 1,927,569.70 14,187,371.64
Tabel 1.1 Premi Bruto dan Rasio Berdasarkan Okupasi per 31 Desember 2014
Table 1.1 Gross Premium and Ratio By Occupation as at 31 December 2014
Underwriting
Year
Okupasi
Total
3
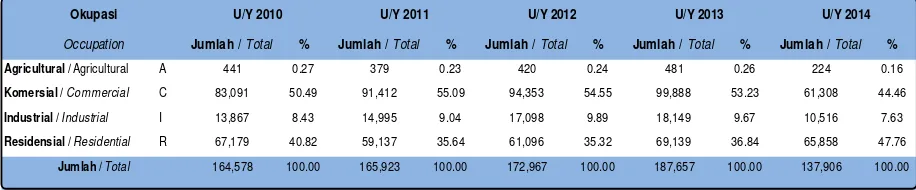
Table 1.2 below shows the number of risks
from Underwriting Year 2010 to Underwriting
Year 2014 recorded until 31 December 2014.
Tabel 1.2 Jumlah Risiko Berdasarkan Okupasi per 31 December2014
Table 1.2 Number of Risk By Occupation as at 31 December 2014
Jumlah /
Total
%
Jumlah /
Total
%
Jumlah /
Total
%
Jumlah /
Total
%
Jumlah /
Total
%
Agricultural / Agricultural A 441 0.27 379 0.23 420 0.24 481 0.26 224 0.16 Komersial / Commercial C 83,091 50.49 91,412 55.09 94,353 54.55 99,888 53.23 61,308 44.46 Industrial / Industrial I 13,867 8.43 14,995 9.04 17,098 9.89 18,149 9.67 10,516 7.63 Residensial / Residential R 67,179 40.82 59,137 35.64 61,096 35.32 69,139 36.84 65,858 47.76
164,578 100.00 165,923 100.00 172,967 100.00 187,657 100.00 137,906 100.00
Occupation
Jumlah / Total
Okupasi
U/Y 2010
U/Y 2011
U/Y 2012
U/Y 2013
U/Y 2014
Agricultural, 420
Number of Risk By Occupation
As at 31 December 2014
4
Jumlah risiko terbesar untuk setiap
Underwriting Year
, dalam hal ini dari
Underwriting Year
2010 sampai dengan
Underwriting Year
2014 ada pada okupasi
Komersial, yaitu selalu berada pada rasio di atas
44% dari total risiko. Kemudian diikuti oleh
okupasi Residensial dengan rasio di atas 35%.
Jika terdapat asosiasi antara kontribusi
premi dengan banyaknya risiko maka belum
tentu asosiasi tersebut berbentuk linear dan
positif. Hal ini dibuktikan dengan apabila melihat
dari premi bruto tertinggi berada di okupasi
industrial sedangkan banyak risiko tertinggi
berada pada okupasi komersial.
E. Incurred Claim
Berdasarkan tabel 1.3 di bawah ini,
frekuensi klaim gempa bumi paling banyak
terjadi di
Underwriting Year
2011 yaitu sebanyak
86 klaim dan didominasi okupasi Komersial
sebanyak 61 klaim. Hal ini disebabkan oleh
kejadian gempa bumi di 2011 yaitu Gempa Bumi
Nusa Dua pada tanggal 13 Oktober 2011
dengan kekuatan 6,8 S.R dan Gempa Bumi
Sibolga pada tanggal 6 November 2011 dengan
kekuatan 6,7 S.R.
The highest number of risks for each
Underwriting Year, in this case from
Underwriting Year 2010 to Underwriting Year
2014, is under Commercial occupation, which is
always on the ratio above 44% from the total
risk. Then, it is followed by Residential
occupation with ratio above 35%.
If there is any association between the
premium contribution and the number of risks
then the association is not necessarily linear nor
positive. This is proved which the highest gross
premium is on the industrial occupation while the
highest total risk is under commercial
occupation.
E. Incurred Claim
5
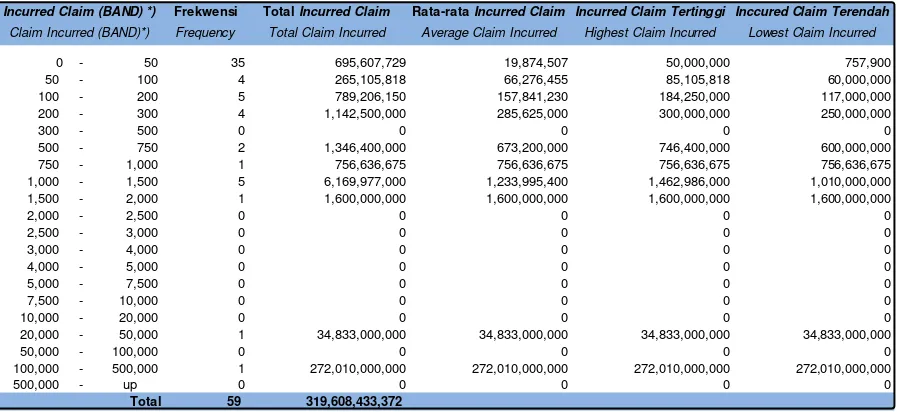
Berdasarkan Tabel 1.4 dan grafik di bawah
ini terlihat bahwa untuk frekwensi klaim tinggi
berada pada Total Incurred Claim yang relative
kecil, sedangkan untuk frekwensi klaim kecil
berada pada Total Incurred Claim yang relative
besar.
Based on table 1.4 and graph below it can
be seen that the high frequency claims lies in
relatively small Total Claim Incurred, while low
frequency claims lies in relatively big Total Claim
Incurred.
2010
2011
2012
2013
2014
Agrikultural / Agricultural
A
0
0
0
0
0
Komersial / Commercial
C
40
61
15
48
2
Industrial / Industrial
I
1
0
0
5
0
Residensial / Residential
R
8
25
1
6
4
49
86
16
59
6
Tabel 1.3 Frekwensi Klaim Berdasarkan Okupasi per 31 Desember 2014
Table 1.3 Claim Frequency By Occupation as at 31 December 2014
Occupation
Frekwensi Total Incurred Claim Rata-rata Incurred Claim Incurred Claim Tertinggi Inccured Claim Terendah
Frequency Total Claim Incurred Average Claim Incurred Highest Claim Incurred Lowest Claim Incurred
0 - 50 35 695,607,729 19,874,507 50,000,000 757,900
- 500,000 1 272,010,000,000 272,010,000,000 272,010,000,000 272,010,000,000 500,000
Tabel 1.4 Frekwensi Incurred Claim Underwriting Year 2013 Per 31 Desember 2014
6
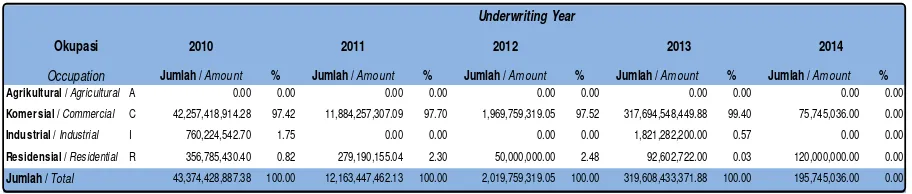
Dengan melihat tabel 1.5 tampak bahwa
jumlah klaim terbesar berada pada Underwriting
Year 2013. Klaim yang terbesar adalah pada
okupasi Komersial, yaitu 99,40% dari total klaim
di
Underwriting Year
2013 atau sebesar Rp.
317,7 miliar.
Tabel 1.6 di bawah ini menyajikan kejadian
Gempa Bumi Tahun 2014 dan
Incurred Claim
sampai dengan 31 Desember 2014.
Looking at table 1.5 below, it shows that the
largest claim is in the Underwriting Year 2013.
The largest claim is under Commercial
occupation that is 99.40% of the total claim in
Underwriting Year 2013 or Rp. 317.7 billion.
Table 1.6 below shows earthquake events
occurred in 2014 and the corresponding
incurred claims as at 31 December 2014.
Table 1.5 Claim Amount By Occupation as at 31 December 2014
Dalam Rupiah
In Rupiah
2010
2011
2012
Jumlah / Amount % Jumlah / Amount % Jumlah / Amount % Jumlah / Amount % Jumlah / Amount % Agrikultural / Agricultural A 0.00 0.00 0.00 0.00 0.00 0.00 0.00 0.00 0.00 0.00 Komersial / Commercial C 42,257,418,914.28 97.42 11,884,257,307.09 97.70 1,969,759,319.05 97.52 317,694,548,449.88 99.40 75,745,036.00 0.00 Industrial / Industrial I 760,224,542.70 1.75 0.00 0.00 0.00 0.00 1,821,282,200.00 0.57 0.00 0.00 Residensial / Residential R 356,785,430.40 0.82 279,190,155.04 2.30 50,000,000.00 2.48 92,602,722.00 0.03 120,000,000.00 0.00 43,374,428,887.38 100.00 12,163,447,462.13 100.00 2,019,759,319.05 100.00 319,608,433,371.88 100.00 195,745,036.00 0.00
2014
Jumlah / Total
Underwriting Year
Tabel 1.5 Jumlah Klaim Berdasarkan Okupasi per 31 Desember 2014
2013
Okupasi
7
Tabel 1.7 di bawah ini menyajikan klaim
untuk
event
Cilacap, Palu, Lombok Utara, Kuta
dan Yogya perjenis okupasi.
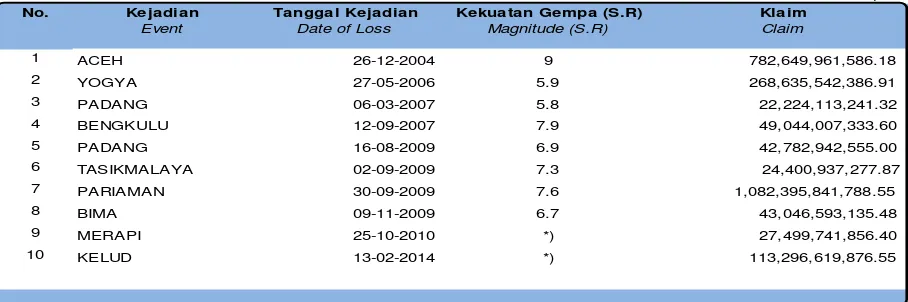
Tabel di bawah ini adalah daftar klaim
terbesar sampai dengan tanggal 31 Desember
2014.
Table 1.7 shows Cilacap, Palu, Lombok
Utara, Kuta and Yogya events by occupation.
The table below is a list of the largest claims
as at 31 December 2014.
Dalam Rupiah
In Rupiah
No. Kejadian Tanggal Kejadian Kekuatan Gempa (S.R) Klaim
Event Date of Loss Magnitude (S.R) Claim
1 ACEH 26-12-2004 9 782,649,961,586.18
Daftar Klaim - Klaim Terbesar Posisi 31 Desember 2014
List of The Largest Claims as at 31 December 2014
Tabel 1.7 Kejadian Gempa Bumi Tahun 2014 dan Klaim per Okupasi per 31 Desember 2014 Table 1.7 Earthquak e Event in 2014 and Claim per Occupation as at 31 December 2014
Event Date of Loss
Agrikultural / Komersial / Industrial / Residensial / Agricultural Commercial Industrial Residential
Cilacap 25-Jan-14 0 0 1 0 0.00 0.00 36,698,400.00 0.00
Palu 23-Feb-14 0 1 0 0 0.00 50,000,000.00 0.00 0.00
Lombok Utara 06-Mar-14 0 0 0 1 0.00 0.00 0.00 7,900,000.00
Kuta 09-Mar-14 0 1 0 0 0.00 15,745,036.00 0.00 0.00
Yogya 02-Apr-14 0 0 0 1 0.00 0.00 0.00 757,900.00
Agricultural Commercial Industrial Residential
Frequency Amount (In Rupiah)
Agrikultural / Komersial / Industrial / Residensial / Kejadian Tanggal Kejadian
Okupasi Occupation
Frekwensi Jumlah (Dalam Rupiah)
Tabel 1.6 Kejadian Gempa Bumi Tahun 2014 dan Klaim per 31 Desember 2014
Table 1.6 Earthquak e Event in 2014 and Claim as at 31 December 2014
Dalam Rupiah
In Rupiah
Kejadian Tanggal Kejadian Kekuatan Gempa (S.R)
Event Date of Loss Magnitude (S.R)
8
Tabel 1.8 menyajikan data jumlah polis dan
loss ratio per 31 Desember 2014. Tabel tersebut
menunjukkan bahwa loss ratio tertinggi berada
pada
Underwriting Year
2013 sebesar 7,52%.
Hal ini dipengaruhi oleh nilai klaim yang cukup
tinggi yang mayoritas disebabkan dari Erupsi
Gunung Kelud tahun 2014.
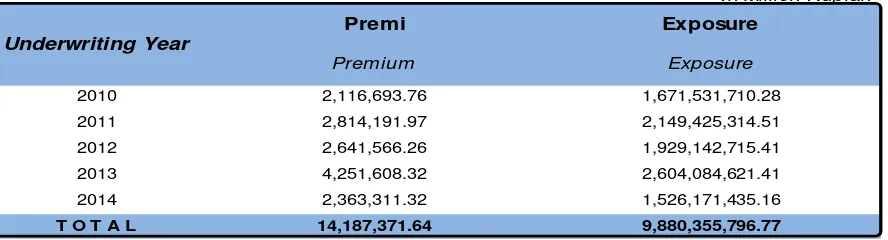
Tabel 1.9 menyajikan Premi dan
Exposure
per 31 Desember 2014.
Table 1.8 shows number of policies, and
loss ratio as at 31 December 2014. The table
show that the biggest loss ratio was at
Underwriting Year 2013 i.e. 7.52%. It was
influenced by large amount of claim that majority
resulting from Kelud Eruption in 2014.
Table 1.9 shows Premium and Exposure as
at 31 December 2014.
Tabel 1.8 Jumlah Polis dan Loss Ratio per 31 Desember 2014
Table 1.8 Number of Policies and Loss Ratio as at 31 December 2014
Underwriting
Jumlah Polis
Premi *)
Frekwensi Klaim
Jumlah Klaim *)
Year
Number of Policies
Premium *)
Claim Frequency
Incurred Claim *)
2010
116,219
2,116,693,759,345.57
49
43,374,428,887.38
2.05%
2011
117,036
2,814,191,973,988.27
86
12,163,447,462.13
0.43%
2012
111,396
2,641,566,261,742.50
16
2,019,759,319.05
0.08%
2013
108,912
4,251,608,321,234.15
59
319,608,433,371.88
7.52%
2014
23,228
2,363,311,323,210.65
6
195,745,036.00
0.01%
Keterangan :
*) Dalam RupiahIn Rupiah
Loss Ratio
Dalam Jutaan Rupiah
In Million Rupiah
Premi
Exposure
Prem ium
Exposure
2010
2,116,693.76
1,671,531,710.28
2011
2,814,191.97
2,149,425,314.51
2012
2,641,566.26
1,929,142,715.41
2013
4,251,608.32
2,604,084,621.41
2014
2,363,311.32
1,526,171,435.16
T O T A L
14,187,371.64
9,880,355,796.77
Tabel 1.9 Premi dan Exposure per 31 Desember 2014
Table 1.9 Premium and Exposure as at 31 December 2014
9
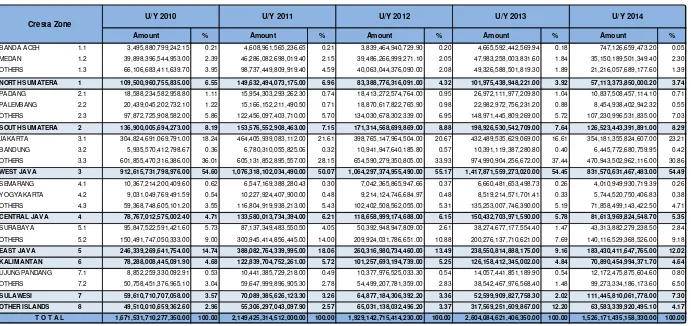
Tab le 2.1
in IDR
Amount
%
Amount
%
Amount
%
Amount
%
Amount
%
BANDA ACEH 1.1 3,495,880,799,242.15 0.21 4,608,961,565,236.65 0.21 3,839,464,940,729.90 0.20 4,665,592,442,569.94 0.18 747,126,659,473.20 0.05 MEDAN 1.2 39,898,396,544,953.00 2.39 46,286,082,698,019.40 2.15 39,486,266,999,271.10 2.05 47,983,258,003,831.60 1.84 35,150,189,501,349.40 2.30 OTHERS 1.3 66,106,683,411,639.70 3.95 98,737,449,809,919.40 4.59 40,063,044,376,090.00 2.08 49,326,588,501,819.30 1.89 21,216,057,689,177.60 1.39 NORTH SUMATERA 1 109,500,960,755,835.00 6.55 149,632,494,073,175.00 6.96 83,388,776,316,091.00 4.32 101,975,438,948,221.00 3.92 57,113,373,850,000.20 3.74 PADANG 2.1 18,588,234,582,958.80 1.11 15,954,303,293,262.30 0.74 18,413,272,574,764.00 0.95 26,972,111,977,209.80 1.04 10,837,508,457,114.10 0.71 PALEMBANG 2.2 20,439,045,202,732.10 1.22 15,166,152,211,490.50 0.71 18,870,617,822,765.90 0.98 22,982,972,756,231.20 0.88 8,454,938,402,942.32 0.55 OTHERS 2.3 97,872,725,908,582.00 5.86 122,456,097,403,710.00 5.70 134,030,678,302,339.00 6.95 148,971,445,809,269.00 5.72 107,230,996,531,835.00 7.03 SOUTH SUMATERA 2 136,900,005,694,273.00 8.19 153,576,552,908,463.00 7.15 171,314,568,699,869.00 8.88 198,926,530,542,709.00 7.64 126,523,443,391,891.00 8.29 JAKARTA 3.1 304,824,691,069,791.00 18.24 464,405,939,083,112.00 21.61 398,765,147,964,504.00 20.67 432,489,535,629,069.00 16.61 354,181,355,824,607.00 23.21 BANDUNG 3.2 5,935,570,412,798.67 0.36 6,780,310,055,825.06 0.32 10,941,947,640,185.80 0.57 10,391,119,387,280.80 0.40 6,445,772,680,759.95 0.42 OTHERS 3.3 601,855,470,316,386.00 36.01 605,131,852,895,557.00 28.15 654,590,279,350,805.00 33.93 974,990,904,256,672.00 37.44 470,943,502,962,116.00 30.86 WEST JAVA 3 912,615,731,798,976.00 54.60 1,076,318,102,034,490.00 50.07 1,064,297,374,955,490.00 55.17 1,417,871,559,273,020.00 54.45 831,570,631,467,483.00 54.49 SEMARANG 4.1 10,367,214,200,409.60 0.62 6,547,169,388,280.43 0.30 7,042,365,865,947.66 0.37 6,660,481,653,498.73 0.26 4,010,949,930,719.39 0.26 YOGYAKARTA 4.2 9,031,049,769,491.59 0.54 10,227,924,407,900.00 0.48 9,214,124,746,684.97 0.48 8,519,214,571,701.41 0.33 5,744,520,750,406.83 0.38 OTHERS 4.3 59,368,748,605,101.20 3.55 116,804,919,938,213.00 5.43 102,402,508,562,055.00 5.31 135,253,007,746,390.00 5.19 71,858,499,143,422.50 4.71 CENTRAL JAVA 4 78,767,012,575,002.40 4.71 133,580,013,734,394.00 6.21 118,658,999,174,688.00 6.15 150,432,703,971,590.00 5.78 81,613,969,824,548.70 5.35 SURABAYA 5.1 95,847,522,591,421.60 5.73 87,137,349,483,550.50 4.05 50,392,948,947,809.00 2.61 38,274,677,177,554.40 1.47 43,313,882,279,238.50 2.84 OTHERS 5.2 150,491,747,050,333.00 9.00 300,945,414,856,445.00 14.00 209,924,031,786,651.00 10.88 200,276,137,710,621.00 7.69 140,116,529,368,526.00 9.18 EAST JAVA 5 246,339,269,641,754.00 14.74 388,082,764,339,995.00 18.06 260,316,980,734,460.00 13.49 238,550,814,888,175.00 9.16 183,430,411,647,765.00 12.02 KALIMANTAN 6 78,288,008,445,091.90 4.68 122,839,704,752,261.00 5.72 101,257,693,194,739.00 5.25 126,158,412,345,002.00 4.84 70,890,454,994,371.70 4.64 UJUNG PANDANG 7.1 8,852,259,330,092.91 0.53 10,441,385,729,218.00 0.49 10,377,976,525,033.30 0.54 14,057,441,851,189.90 0.54 12,172,475,875,604.60 0.80 OTHERS 7.2 50,758,451,376,965.10 3.04 59,647,999,896,905.30 2.78 54,499,207,781,359.00 2.83 38,542,467,976,568.40 1.48 99,273,334,186,173.60 6.50 SULAWESI 7 59,610,710,707,058.00 3.57 70,089,385,626,123.30 3.26 64,877,184,306,392.20 3.36 52,599,909,827,758.30 2.02 111,445,810,061,778.00 7.30 OTHER ISLANDS 8 49,510,010,659,362.60 2.96 55,306,297,043,097.90 2.57 65,031,138,032,496.20 3.37 317,569,251,609,867.00 12.20 63,583,339,920,495.10 4.17 1,671,531,710,277,350.00 100.00 2,149,425,314,512,000.00 100.00 1,929,142,715,414,230.00 100.00 2,604,084,621,406,350.00 100.00 1,526,171,435,158,330.00 100.00
U/Y 2014
As At 31/12/2014
National Aggregate Exposure By Cresta Zone
T O T A L
U/Y 2013
Cresta Zone
U/Y 2012
10
83,388.78 171,314.57
1,064,297.37
118,659.00
260,316.98
101,257.69
64,877.18
65,031.14
101,975.44 198,926.53
1,417,871.56
150,432.70
238,550.81
126,158.41 52,599.91
317,569.25
57,113.37 126,523.44
831,570.63
81,613.97
183,430.41
70,890.45
111,445.81
63,583.34
National Aggregate Exposure By Cresta Zone
As at 31 December 2014
(In Billion IDR)
109,500.96 136,900.01
912,615.73
78,767.01
246,339.27
78,288.01
59,610.71 49,510.01
149,632.49 153,576.55
1,076,318.10
133,580.01
388,082.76
122,839.70
70,089.39
55,306.30
UY 2010
UY 2011
UY 2012
11
Amount
%
Amount
%
Amount
%
Amount
%
Amount
%
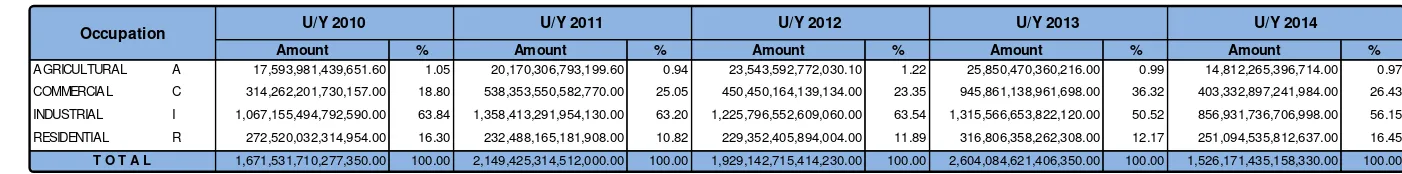
AGRICULTURAL A 17,593,981,439,651.60 1.05 20,170,306,793,199.60 0.94 23,543,592,772,030.10 1.22 25,850,470,360,216.00 0.99 14,812,265,396,714.00 0.97 COMMERCIAL C 314,262,201,730,157.00 18.80 538,353,550,582,770.00 25.05 450,450,164,139,134.00 23.35 945,861,138,961,698.00 36.32 403,332,897,241,984.00 26.43 INDUSTRIAL I 1,067,155,494,792,590.00 63.84 1,358,413,291,954,130.00 63.20 1,225,796,552,609,060.00 63.54 1,315,566,653,822,120.00 50.52 856,931,736,706,998.00 56.15 RESIDENTIAL R 272,520,032,314,954.00 16.30 232,488,165,181,908.00 10.82 229,352,405,894,004.00 11.89 316,806,358,262,308.00 12.17 251,094,535,812,637.00 16.45 1,671,531,710,277,350.00 100.00 2,149,425,314,512,000.00 100.00 1,929,142,715,414,230.00 100.00 2,604,084,621,406,350.00 100.00 1,526,171,435,158,330.00 100.00
U/Y 2010
U/Y 2011
Tab le 2.2
Occupation
As At 31/12/2014
National Aggregate Exposure By Occupation
T O T A L
U/Y 2012
U/Y 2013
U/Y 2014
12
( In Billion IDR )
Agricultural, 23,543.59 Commercial, 450,450.16
Industrial, 1,225,796.55
Residential, 229,352.41
Agricultural, 25,850.47 Commercial, 945,861.14
Industrial, 1,315,566.65
Residential, 316,806.36
Agricultural, 14,812.27
Commercial, 403,332.90 Industrial, 856,931.74
Residential, 251,094.54
National Aggregate Exposure By Occupation
As at 31 December 2014
Agricultural, 17,593.98 Commercial, 314,262.20
Industrial, 1,067,155.49
Residential, 272,520.03
Agricultural, 20,170.31 Commercial, 538,353.55
Industrial, 1,358,413.29
Residential, 232,488.17
UY 2010
UY 2011
UY 2012
UY 2013
13
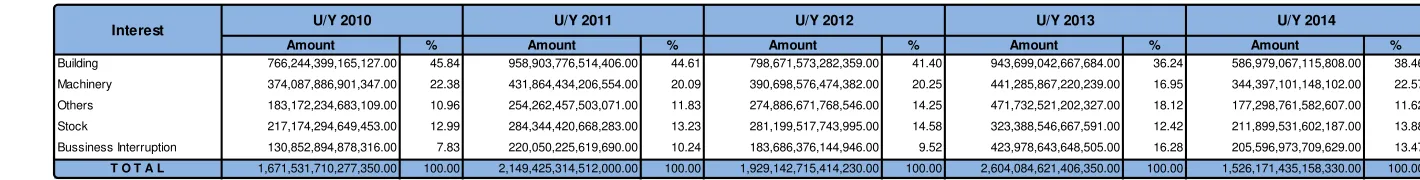
Tab le 2.3
Amount % Amount % Amount % Amount % Amount %
Building 766,244,399,165,127.00 45.84 958,903,776,514,406.00 44.61 798,671,573,282,359.00 41.40 943,699,042,667,684.00 36.24 586,979,067,115,808.00 38.46 Machinery 374,087,886,901,347.00 22.38 431,864,434,206,554.00 20.09 390,698,576,474,382.00 20.25 441,285,867,220,239.00 16.95 344,397,101,148,102.00 22.57 Others 183,172,234,683,109.00 10.96 254,262,457,503,071.00 11.83 274,886,671,768,546.00 14.25 471,732,521,202,327.00 18.12 177,298,761,582,607.00 11.62 Stock 217,174,294,649,453.00 12.99 284,344,420,668,283.00 13.23 281,199,517,743,995.00 14.58 323,388,546,667,591.00 12.42 211,899,531,602,187.00 13.88 Bussiness Interruption 130,852,894,878,316.00 7.83 220,050,225,619,690.00 10.24 183,686,376,144,946.00 9.52 423,978,643,648,505.00 16.28 205,596,973,709,629.00 13.47 T O T A L 1,671,531,710,277,350.00 100.00 2,149,425,314,512,000.00 100.00 1,929,142,715,414,230.00 100.00 2,604,084,621,406,350.00 100.00 1,526,171,435,158,330.00 100.00
National Aggregate Exposure By Interest
In IDR
Interest
U/Y 2012
U/Y 2013
U/Y 2014
As At 31/12/2014
15
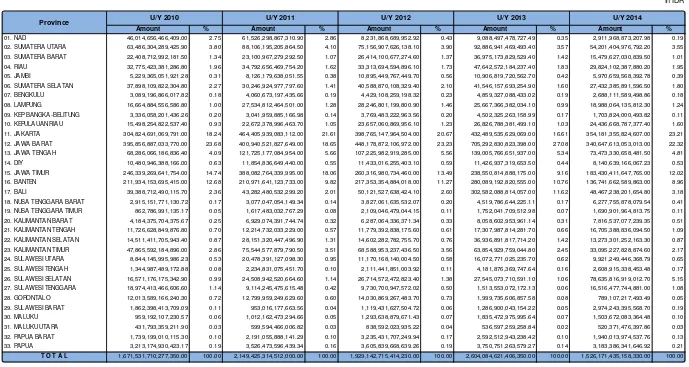
Tab le 2.4
In IDR
Amount % Amount % Amount % Amount % Amount %
01. NAD 46,014,656,466,409.00 2.75 61,526,298,867,310.90 2.86 8,231,868,689,952.92 0.43 9,088,497,478,727.49 0.35 2,911,968,873,207.98 0.19 02. SUMATERA UTARA 63,486,304,289,425.90 3.80 88,106,195,205,864.50 4.10 75,156,907,626,138.10 3.90 92,886,941,469,493.40 3.57 54,201,404,976,792.20 3.55 03. SUMATERA BARAT 22,408,712,992,181.50 1.34 23,100,967,279,292.50 1.07 26,414,100,677,274.60 1.37 36,975,173,829,529.40 1.42 15,479,627,030,839.50 1.01 04. RIAU 32,775,423,381,286.80 1.96 34,792,656,469,754.20 1.62 33,313,694,594,896.10 1.73 47,642,572,184,237.40 1.83 29,824,102,387,880.20 1.95 05. JAMBI 5,229,365,051,921.28 0.31 8,126,179,638,051.55 0.38 10,895,449,767,449.70 0.56 10,906,819,720,562.70 0.42 5,970,659,568,392.78 0.39 06. SUMATERA SELATAN 37,898,109,822,304.80 2.27 30,246,924,977,797.60 1.41 40,588,870,108,329.40 2.10 41,546,157,693,254.90 1.60 27,432,385,891,596.50 1.80 07. BENGKULU 3,089,196,866,017.82 0.18 4,060,673,197,435.66 0.19 4,429,108,259,198.32 0.23 4,859,327,088,433.02 0.19 2,688,111,589,498.86 0.18 08. LAMPUNG 16,664,884,556,586.80 1.00 27,534,812,464,501.00 1.28 28,246,801,199,800.90 1.46 25,667,366,382,034.10 0.99 18,988,064,135,812.30 1.24 09. KEP BANGKA-BELITUNG 3,336,058,201,436.26 0.20 3,041,959,885,166.98 0.14 3,769,483,222,963.56 0.20 4,502,325,263,158.99 0.17 1,703,824,000,493.82 0.11 10. KEPULAUAN RIAU 15,498,254,822,537.40 0.93 22,672,378,996,463.70 1.05 23,657,060,869,956.10 1.23 26,826,788,381,499.10 1.03 24,436,668,787,377.40 1.60 11. JAKARTA 304,824,691,069,791.00 18.24 464,405,939,083,112.00 21.61 398,765,147,964,504.00 20.67 432,489,535,629,069.00 16.61 354,181,355,824,607.00 23.21 12. JAWA BARAT 395,856,887,033,770.00 23.68 400,940,521,827,649.00 18.65 448,178,872,106,972.00 23.23 705,292,830,823,398.00 27.08 340,647,613,053,013.00 22.32 13. JAWA TENGAH 68,286,066,186,836.40 4.09 121,725,177,084,954.00 5.66 107,225,982,919,285.00 5.56 139,005,766,651,937.00 5.34 73,473,330,658,481.50 4.81 14. DIY 10,480,946,388,166.00 0.63 11,854,836,649,440.00 0.55 11,433,016,255,403.10 0.59 11,426,937,319,653.50 0.44 8,140,639,166,067.23 0.53 15. JAWA TIMUR 246,339,269,641,754.00 14.74 388,082,764,339,995.00 18.06 260,316,980,734,460.00 13.49 238,550,814,888,175.00 9.16 183,430,411,647,765.00 12.02 16. BANTEN 211,934,153,695,415.00 12.68 210,971,641,123,733.00 9.82 217,353,354,884,018.00 11.27 280,089,192,820,555.00 10.76 136,741,662,589,863.00 8.96 17. BALI 39,388,712,490,115.70 2.36 43,282,480,532,299.20 2.01 50,121,527,638,424.10 2.60 302,582,088,814,057.00 11.62 48,467,238,201,654.80 3.18 18. NUSA TENGGARA BARAT 2,915,151,771,130.72 0.17 3,077,047,054,149.34 0.14 3,827,061,635,532.07 0.20 4,519,786,644,225.11 0.17 6,277,755,878,079.54 0.41 19. NUSA TENGGARA TIMUR 862,786,991,135.17 0.05 1,617,483,032,767.29 0.08 2,109,046,479,044.15 0.11 1,752,041,709,512.98 0.07 1,690,901,964,813.75 0.11 20. KALIMANTAN BARAT 4,184,375,704,375.67 0.25 6,929,074,391,744.74 0.32 6,287,064,336,371.34 0.33 8,058,602,953,961.14 0.31 7,816,537,077,239.35 0.51 21. KALIMANTAN TENGAH 11,726,628,849,876.80 0.70 12,214,732,033,229.00 0.57 11,779,392,838,175.60 0.61 17,307,987,814,281.70 0.66 16,705,388,836,094.50 1.09 22. KALIMANTAN SELATAN 14,511,411,705,943.40 0.87 28,151,320,447,496.90 1.31 14,602,282,782,755.70 0.76 36,936,891,817,714.20 1.42 13,273,301,252,163.30 0.87 23. KALIMANTAN TIMUR 47,865,592,184,896.00 2.86 75,544,577,879,790.50 3.51 68,588,953,237,436.50 3.56 63,854,929,759,044.80 2.45 33,095,227,828,874.60 2.17 24. SULAWESI UTARA 8,844,145,995,986.23 0.53 20,478,391,127,098.30 0.95 11,170,168,140,004.50 0.58 16,072,771,025,235.70 0.62 9,921,249,446,368.79 0.65 25. SULAWESI TENGAH 1,344,987,489,172.88 0.08 2,234,831,075,451.70 0.10 2,111,441,851,003.92 0.11 4,181,876,369,747.64 0.16 2,608,915,338,453.48 0.17 26. SULAWESI SELATAN 16,571,176,175,342.90 0.99 24,508,942,520,664.60 1.14 26,714,572,472,823.40 1.38 27,545,073,710,591.10 1.06 78,635,816,919,012.70 5.15 27. SULAWESI TENGGARA 18,974,413,466,606.60 1.14 9,114,245,475,615.48 0.42 9,730,700,947,572.02 0.50 1,513,553,072,172.13 0.06 16,516,477,744,881.00 1.08 28. GORONTALO 12,013,589,166,240.30 0.72 12,799,959,249,629.60 0.60 14,030,869,267,483.70 0.73 1,999,735,606,857.58 0.08 789,107,217,493.49 0.05 29. SULAWESI BARAT 1,862,398,413,709.09 0.11 953,016,177,663.56 0.04 1,119,431,627,504.72 0.06 1,286,900,043,154.22 0.05 2,974,243,395,568.70 0.19 30. MALUKU 959,192,107,230.57 0.06 1,012,162,473,294.66 0.05 1,293,638,879,671.43 0.07 1,835,472,975,995.64 0.07 1,503,672,083,364.48 0.10 31. MALUKU UTARA 431,793,359,211.90 0.03 599,594,466,006.82 0.03 838,592,023,935.22 0.04 536,597,259,258.84 0.02 520,371,476,397.86 0.03 32. PAPUA BARAT 1,739,199,010,115.30 0.10 2,191,055,888,141.29 0.10 3,235,431,707,249.94 0.17 2,592,512,943,238.42 0.10 1,940,013,974,537.76 0.13 33. PAPUA 3,213,174,930,423.17 0.19 3,526,473,596,439.34 0.16 3,605,839,668,639.26 0.19 3,750,751,263,579.27 0.14 3,183,386,341,646.92 0.21
T O T A L 1,671,531,710,277,350.00 100.00 2,149,425,314,512,000.00 100.00 1,929,142,715,414,230.00 100.00 2,604,084,621,406,350.00 100.00 1,526,171,435,158,330.00 100.00
Province U/Y 2010 U/Y 2011 U/Y 2012 U/Y 2014
National Aggregate Exposure By Province
As At 31/12/201416
Tab le 3.1
in IDR
U/Y 2010
U/Y 2011
U/Y 2012
Amount
%
Amount
%
Amount
%
Amount
%
Amount
%
BANDA ACEH 1.1 6,051,202,306.20 0.29 7,255,283,677.40 0.26 7,248,598,498.52 0.27 8,881,676,185.72 0.21 1,438,293,045.29 0.06 MEDAN 1.2 47,673,497,420.22 2.25 54,391,678,378.55 1.93 49,057,405,453.27 1.86 65,019,613,559.29 1.53 48,370,129,983.37 2.05 OTHERS 1.3 84,285,242,255.56 3.98 132,337,261,203.50 4.70 52,565,709,149.06 1.99 75,489,213,655.47 1.78 31,010,826,992.26 1.31 NORTH SUMATERA 1 138,009,941,981.98 6.52 193,984,223,259.45 6.89 108,871,713,100.85 4.12 149,390,503,400.48 3.51 80,819,250,020.92 3.42 PADANG 2.1 32,778,827,007.39 1.55 29,722,664,380.28 1.06 34,706,692,449.72 1.31 51,978,390,247.26 1.22 20,179,737,639.28 0.85 PALEMBANG 2.2 19,383,104,938.80 0.92 14,170,019,921.46 0.50 17,638,821,394.64 0.67 24,274,700,236.15 0.57 8,694,455,195.04 0.37 OTHERS 2.3 108,788,602,446.87 5.14 136,325,771,692.64 4.84 155,394,230,649.01 5.88 192,101,128,558.49 4.52 138,923,243,154.50 5.88 SOUTH SUMATERA 2 160,950,534,393.06 7.60 180,218,455,994.38 6.40 207,739,744,493.37 7.86 268,354,219,041.90 6.31 167,797,435,988.82 7.10 JAKARTA 3.1 433,910,542,004.54 20.50 669,669,520,934.73 23.80 597,612,860,435.61 22.62 697,994,679,891.89 16.42 594,305,245,952.15 25.15 BANDUNG 3.2 8,241,042,107.75 0.39 9,916,805,917.11 0.35 16,343,625,486.30 0.62 16,183,329,875.96 0.38 9,965,568,152.70 0.42 OTHERS 3.3 778,644,398,352.92 36.79 833,535,780,053.36 29.62 951,567,888,791.94 36.02 1,665,264,469,164.24 39.17 785,491,284,627.91 33.24 WEST JAVA 3 1,220,795,982,465.21 57.67 1,513,122,106,905.20 53.77 1,565,524,374,713.85 59.27 2,379,442,478,932.09 55.97 1,389,762,098,732.76 58.81 SEMARANG 4.1 11,636,480,141.95 0.55 7,986,696,304.55 0.28 8,736,950,809.93 0.33 8,985,037,244.21 0.21 5,576,763,141.15 0.24 YOGYAKARTA 4.2 13,009,093,100.49 0.61 15,336,936,026.90 0.54 14,028,296,428.53 0.53 13,248,795,189.04 0.31 8,798,792,676.68 0.37 OTHERS 4.3 71,914,369,548.34 3.40 146,322,144,818.04 5.20 128,178,167,116.80 4.85 183,914,181,226.18 4.33 101,480,793,752.13 4.29 CENTRAL JAVA 4 96,559,942,790.78 4.56 169,645,777,149.49 6.03 150,943,414,355.26 5.71 206,148,013,659.43 4.85 115,856,349,569.96 4.90 SURABAYA 5.1 111,164,194,690.21 5.25 110,500,306,327.69 3.93 64,169,506,826.79 2.43 49,726,873,433.19 1.17 61,121,940,313.23 2.59 OTHERS 5.2 175,300,322,745.79 8.28 360,993,980,958.49 12.83 259,493,110,349.52 9.82 281,674,754,797.53 6.63 201,418,198,237.61 8.52 EAST JAVA 5 286,464,517,436.00 13.53 471,494,287,286.18 16.75 323,662,617,176.31 12.25 331,401,628,230.72 7.79 262,540,138,550.84 11.11 KALIMANTAN 6 68,410,654,079.24 3.23 103,391,973,974.23 3.67 93,636,972,236.17 3.54 130,971,396,065.57 3.08 72,437,567,577.71 3.07 UJUNG PANDANG 7.1 8,854,097,129.22 0.42 9,478,927,946.13 0.34 9,912,216,528.27 0.38 14,162,655,403.25 0.33 13,077,821,940.94 0.55 OTHERS 7.2 67,259,874,119.90 3.18 93,696,626,356.62 3.33 83,503,962,438.90 3.16 62,104,736,428.82 1.46 155,512,678,164.18 6.58 SULAWESI 7 76,113,971,249.12 3.60 103,175,554,302.75 3.67 93,416,178,967.17 3.54 76,267,391,832.07 1.79 168,590,500,105.12 7.13 OTHER ISLANDS 8 69,388,214,950.18 3.28 79,159,595,116.55 2.81 97,771,246,699.52 3.70 709,632,690,071.88 16.69 105,507,982,664.52 4.46 2,116,693,759,345.57 100.00 2,814,191,973,988.23 100.00 2,641,566,261,742.50 100.00 4,251,608,321,234.14 100.00 2,363,311,323,210.65 100.00
U/Y 2014
As At 31/12/2014
National Gross Premium By Cresta Zone
T O T A L
17
National Gross Premium By Cresta Zone
As at 31 December 2014
18
U/Y 2010
U/Y 2011
U/Y 2012
Amount
%
Amount
%
Amount
%
Amount
%
Amount
%
AGRICULTURAL A 20,828,909,822.51 0.98 23,897,315,368.61 0.85 29,419,229,652.86 1.11 34,876,464,798.31 0.82 18,675,258,226.35 0.79 COMMERCIAL C 434,837,251,208.41 20.54 750,839,421,933.93 26.68 642,472,639,574.03 24.32 1,716,969,212,831.83 40.38 619,524,056,147.17 26.21 INDUSTRIAL I 1,297,834,004,593.05 61.31 1,697,040,240,241.14 60.30 1,624,899,675,237.71 61.51 2,026,598,041,863.06 47.67 1,321,090,215,202.30 55.90 RESIDENTIAL R 363,193,593,721.56 17.16 342,414,996,444.56 12.17 344,774,717,277.90 13.05 473,164,601,740.95 11.13 404,021,793,634.83 17.10 2,116,693,759,345.53 100.00 2,814,191,973,988.24 100.00 2,641,566,261,742.50 100.00 4,251,608,321,234.15 100.00 2,363,311,323,210.65 100.00
As At 31/12/2014
National Gross Premium By Occupation
T O T A L
U/Y 2013
U/Y 2014
in IDR
Tab le 3.2
19
( In Billion IDR )
Agricultural, 23,543.59 Commercial, 450,450.16
Industrial, 1,225,796.55
Residential, 229,352.41
Agricultural, 25,850.47 Commercial, 945,861.14
Industrial, 1,315,566.65
Residential, 316,806.36
Agricultural, 14,812.27
Commercial, 403,332.90 Industrial, 856,931.74
Residential, 251,094.54
National Aggregate Exposure By Occupation
As at 31 December 2014
Agricultural, 17,593.98 Commercial, 314,262.20
Industrial, 1,067,155.49
Residential, 272,520.03
Agricultural, 20,170.31 Commercial, 538,353.55
Industrial, 1,358,413.29
Residential, 232,488.17
UY 2010
UY 2011
UY 2012
UY 2013
20
Tab le 3.3
In IDR
Amount
%
Amount
%
Amount
%
Amount
%
Amount
%
01. NAD 61,933,427,650.03 2.93 87,272,745,480.81 3.10 12,322,756,854.35 0.47 16,212,999,533.71 0.38 5,091,341,010.80 0.22 02. SUMATERA UTARA 76,076,514,331.93 3.59 106,711,477,778.64 3.79 96,548,956,246.51 3.65 133,177,503,866.76 3.13 75,727,909,010.11 3.20 03. SUMATERA BARAT 39,338,010,826.10 1.86 40,326,642,779.02 1.43 47,371,801,948.12 1.79 70,412,946,017.69 1.66 28,337,331,931.33 1.20 04. RIAU 33,033,443,273.00 1.56 34,916,965,244.00 1.24 35,217,466,736.98 1.33 55,756,882,454.75 1.31 34,736,850,618.73 1.47 05. JAMBI 5,242,221,847.08 0.25 7,938,259,820.08 0.28 10,791,807,426.72 0.41 12,343,542,592.75 0.29 6,807,811,027.90 0.29 06. SUMATERA SELATAN 39,281,214,918.39 1.86 31,091,594,331.29 1.10 42,225,257,071.65 1.60 48,975,548,628.88 1.15 36,216,851,619.98 1.53 07. BENGKULU 5,473,349,023.87 0.26 7,256,169,725.58 0.26 8,237,837,085.21 0.31 9,804,776,463.34 0.23 5,196,899,868.66 0.22 08. LAMPUNG 22,692,710,088.11 1.07 37,249,898,677.14 1.32 39,905,132,712.32 1.51 39,214,958,290.62 0.92 29,220,233,520.15 1.24 09. KEP BANGKA-BELITUNG 2,953,443,103.05 0.14 2,654,439,798.01 0.09 3,394,693,966.44 0.13 4,376,254,230.71 0.10 1,645,316,338.27 0.07 10. KEPULAUAN RIAU 12,936,141,313.44 0.61 18,784,485,619.28 0.67 20,595,747,545.93 0.78 27,469,310,363.17 0.65 25,636,141,063.80 1.08 11. JAKARTA 433,910,542,004.54 20.50 669,669,520,934.73 23.80 597,612,860,435.61 22.62 697,994,679,891.89 16.42 594,305,245,952.15 25.15 12. JAWA BARAT 504,454,579,276.75 23.83 549,775,612,533.25 19.54 649,202,133,991.13 24.58 1,205,838,311,325.53 28.36 566,618,351,732.30 23.98 13. JAWA TENGAH 81,521,601,724.06 3.85 151,888,826,113.28 5.40 133,607,366,530.92 5.06 188,465,060,856.00 4.43 103,390,538,888.04 4.37 14. DIY 15,038,341,066.72 0.71 17,756,951,036.21 0.63 17,336,047,824.33 0.66 17,682,952,803.43 0.42 12,465,810,681.92 0.53 15. JAWA TIMUR 286,464,517,436.00 13.53 471,494,287,286.19 16.75 323,662,617,176.32 12.25 331,401,628,230.73 7.79 262,540,138,550.84 11.11 16. BANTEN 282,430,861,183.92 13.34 293,676,973,437.22 10.44 318,709,380,287.11 12.07 475,609,487,714.66 11.19 228,838,501,048.32 9.68 17. BALI 54,063,520,550.42 2.55 60,357,067,500.68 2.14 72,961,917,600.29 2.76 682,785,893,657.11 16.06 78,210,871,889.87 3.31 18. NUSA TENGGARA BARAT 4,440,906,653.30 0.21 5,152,954,498.64 0.18 7,071,006,825.92 0.27 8,802,969,699.51 0.21 11,630,709,649.13 0.49 19. NUSA TENGGARA TIMUR 1,281,077,691.84 0.06 2,433,951,389.85 0.09 3,238,797,428.24 0.12 2,812,496,001.85 0.07 2,843,895,111.45 0.12 20. KALIMANTAN BARAT 3,715,242,385.16 0.18 6,039,986,630.20 0.21 5,583,831,650.53 0.21 7,801,543,847.70 0.18 7,862,944,530.08 0.33 21. KALIMANTAN TENGAH 9,889,548,328.95 0.47 10,262,245,474.31 0.36 10,661,044,693.59 0.40 17,958,489,273.68 0.42 17,515,051,704.80 0.74 22. KALIMANTAN SELATAN 12,861,818,728.25 0.61 23,762,331,278.15 0.84 13,295,154,786.58 0.50 37,315,778,410.83 0.88 12,567,430,084.75 0.53 23. KALIMANTAN TIMUR 41,944,044,636.88 1.98 63,327,410,591.57 2.25 64,096,941,105.46 2.43 67,895,584,533.35 1.60 34,492,141,258.09 1.46 24. SULAWESI UTARA 14,764,191,364.03 0.70 37,732,408,368.21 1.34 20,970,212,778.36 0.79 32,959,504,345.17 0.78 20,490,377,892.28 0.87 25. SULAWESI TENGAH 2,004,618,104.55 0.09 3,453,309,420.21 0.12 3,324,143,318.87 0.13 6,862,013,070.21 0.16 4,281,219,265.49 0.18 26. SULAWESI SELATAN 17,199,396,856.17 0.81 24,634,050,796.95 0.88 27,699,734,433.87 1.05 28,412,649,869.63 0.67 112,672,045,540.57 4.77 27. SULAWESI TENGGARA 21,176,342,881.42 1.00 10,519,505,924.99 0.37 11,914,673,955.76 0.45 2,269,405,998.90 0.05 25,118,283,517.11 1.06 28. GORONTALO 18,303,446,175.48 0.86 25,429,749,615.48 0.90 27,830,875,142.23 1.05 3,836,338,417.27 0.09 1,566,477,337.75 0.07 29. SULAWESI BARAT 2,665,975,867.48 0.13 1,406,530,176.92 0.05 1,676,539,338.07 0.06 1,927,480,130.89 0.05 4,462,096,551.91 0.19 30. MALUKU 1,748,451,819.08 0.08 1,761,141,005.57 0.06 2,358,964,475.46 0.09 3,456,936,294.54 0.08 2,912,579,382.63 0.12 31. MALUKU UTARA 736,016,880.37 0.03 1,055,956,776.04 0.04 1,479,457,700.98 0.06 1,033,934,795.32 0.02 987,939,649.35 0.04 32. PAPUA BARAT 2,543,602,599.57 0.12 3,177,814,430.49 0.11 4,823,778,402.01 0.18 4,192,732,314.06 0.10 3,250,714,401.89 0.14 33. PAPUA 4,574,638,755.60 0.22 5,220,709,515.28 0.19 5,837,324,266.62 0.22 6,547,727,309.50 0.15 5,671,272,580.19 0.24 T O T A L 2,116,693,759,345.54 100.00 2,814,191,973,988.27 100.00 2,641,566,261,742.49 100.00 4,251,608,321,234.14 100.00 2,363,311,323,210.64 100.00