Contents list available at IJRED website , ISSN : 2252-4940
Int. Journal of Renewable Energy Development (IJRED)
Journal homepage: www.ijred.com
Design and Economic Analysis of a Photovoltaic System: A Case Study
C.O.C. Oko
*, E.O. Diemuodeke, N.F. Omunakwe, and E. Nnamdi
Department of Mechanical Engineering, Faculty of Engineering, University of Port Harcourt, PMB 5323, Port Harcourt, NIGERIA
Article history:
Received July 22, 2012
Received in revised form August 8, 2012 Accepted August 15, 2012
Available online
ABSTRACT: This paper presents the design analysis of a photovoltaic (PV) system to power the CAD/CAM Laboratory at the Department of Mechanical Engineering, University of Port Harcourt. Life cycle cost and break-even point analyses are also carried out to assess the economic viability of the system. The unit cost of electricity for the designed PV system is high compared to the current unit cost of the municipally supplied electricity, but will be competitive with lowering cost of PV system components and favourable government policies on renewable energy. The approach and data provided are useful for designing solar systems in the area. The automated MS Excel spreadsheet developed could be used for the design and economic analyses of PV system in any other geographical region once the input data are sorted. Since about 90% of businesses in Nigeria currently own diesel generators, it is expected that future work should be devoted to the optimum combination of PV-Battery-Diesel system in electricity generation for optimum economic benefits to the country.
Keywords: photovoltaic system design, renewable energy technology, solar energy economics
1. Introduction
Many research works on the utilization of renewable energy resources such as solar energy for electricity generation are ongoing in most regions of the world. This is as a result of the uncertainties surrounding the global oil and gas supplies and prices, and the adverse environmental impact of fossil fuel exploitation. The situation is even compounded in Nigeria, where electricity supply is grossly inadequate and unreliable. Public and private organisations and some individuals supplement the electricity provided by the national electricity grid with one that is independently supplied using their own diesel generators. It is estimated that about 90% of businesses in Nigeria own diesel generators [1]. For the institutions of higher learning in Nigeria, students’ laboratory experiment, workshop practice, automated design and simulation are constantly disrupted from the epileptic municipal electricity supply by the Power Holding Company of Nigeria (PHCN). PHCN is the statutory body charged with the sole generation and supply of electricity in Nigeria. The institutions mitigate this by depending
heavily on electricity supply from diesel engine generators. But it has been shown that small to large electricity power demands can be met by the photovoltaic (PV) power systems [2].
P a g e |
radiation data and the electrical load data of a typical household in the considered site.
Markvart noted that on a reasonable sunny site of insolation 20 MJm-2day-1, power produced from solar
energy conversion technologies, PV and solar thermal, is significantly cheaper over extended use than that from diesel generators [6]. Ojosu argued that PV energy systems have special role to play in Nigeria power production, because of its substantial solar energy resources with daily solar radiation average of between 4 and 6 kW/m2/day [7]. Augustine and Nnabuchi
showed that Port Harcourt city, which is located at the latitude of 04°40'N and longitude of 07°10'E, has adequate sunshine for PV and solar thermal technologies [8].
Therefore, the purpose of this paper is to conduct a design and life cycle cost analysis, and simulation study of PV systems for the locality, and specifically, to develop one for the CAD/CAM laboratory at the Department of Mechanical Engineering, University of Port Harcourt, Port Harcourt, Nigeria, which is situated at a latitude of 04°40'N and longitude of 07°10'E.
2. Design and Economic Analysis
The PV system development mainly entails the design and life cycle analyses of the system. These are now considered in the following sub-sections.
2.1 System Description
The Photovoltaic (PV) system is composed of a variety of components in addition to the photovoltaic modules, a balance-of-system that wired together to
form the entire fully functional system capable of supplying electric power; and these system elements are:
PV cells, represent the fundamental power conversion units. They are made from semiconductors and convert sunlight to electricity. To increase the power output of PV cells, they are connected together to form larger units called modules. Modules, in turn, are connected in parallel and series to form a larger unit called panel.
A storage medium (battery bank), stores the electrical energy produced by the PV cells, and makes the energy available at night or on dark days (days of autonomy or no-sun-days).
A voltage regulator (or charge/discharge controller), reverses current and prevents battery from getting overcharged and overdischarged.
An inverter, converts a low DC-voltage into usable AC-voltage; it may be a stand-alone installation or grid-connected installation.
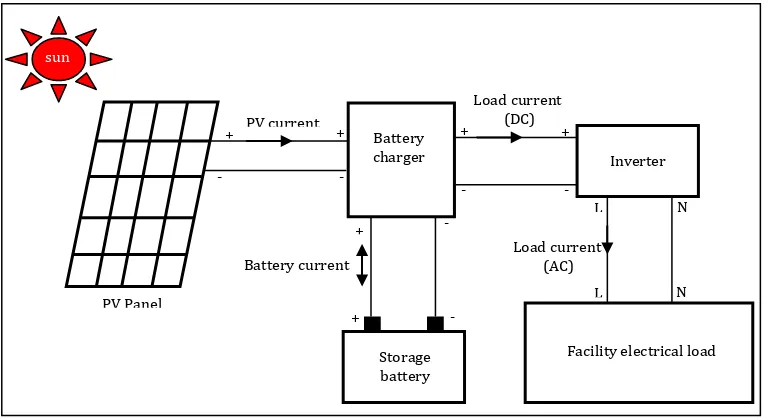
AC and DC loads, appliances and devices, which consume the power generated by the PV system. Figure 1 shows the configuration of the stand-alone PV system with all the functional components.
2.2 Design Analysis
The PV system analysis entails system sizing, which is the process of estimating the required voltage and current rating for each component of the PV system to meet the electrical demand of the facility.
Fig. 1 Configuration of the Stand-Alone PV System
Storage battery Battery
charger Inverter
Facility electrical load PV current
Battery current
Load current (DC)
Load current (AC)
PV Panel
+ +
- -
- -
- -
+
+ + +
L L
N N
sun
The daily energy demand, EL (kWh/day), from the solar
panel is given as [9]:
overall f
overall S
L
E
W
H
E
/
/
(1)where ES (kWh/day) is the estimated daily energy
demand; ηoverall (-) is the overall system efficiency,
which is the product of component efficiencies; Wf (kW)
is the power rating of the facility; and H (h/day) is the number of hours the facility is in use per day.
The overall system efficiency is given as:
INV B PV overall
(2)where ηPV (-) is the PV module efficiency; ηB (-) is the
battery efficiency; and ηINV (-) is the inverter efficiency.
The PV floor area, APV (m2), can be calculated by the
following equation [10]:
CF ave L PV
T
I
E
A
(3)where Iave (kWh/m2/day) is the average daily energy
(solar isolation) input over the year and TCF (-) is the
temperature correction factor.
The PV peak power, WPVP (kWp), at peak solar isolation
(PSI-kWp/m2) is given as [11]:
PV PV
PVP
A
PSI
W
(4)The total system direct current, IDC,sym [Ah], needed can
be calculated as follows [9]:
bus DC PVP sym DC
V
W
I
, ,
(5)where VDC,bus (V) is the DC bus voltage.
Modules are connected in series and parallel according to the system usage as follows:
i. The number of PV module in series, Nms (-), is
obtained as: mod , , DC bus DC ms
V
V
N
(6a)where VDC,mod (V) is the PV module rated voltage
ii. The string number of modules in parallel, Nmp (-)
(each containing Nms), is given as:
mod , , DC sym DC mp
I
I
N
(6b)Therefore, the total number of modules that make up the panel is given as
mp ms m
N
N
N
(7)According to Oko and Nnamchi the optimal tilt angle, s* (o), for a south facing fixed flat plate collector for the
geographical location under consideration is given as
[12]:
2 o
s2.9489 1.4050 0.0190 , for 4.858 13.017 [ ](8)
where φ [o] is the latitude of the location.
The storage capacity, SBC (kWh), of the battery can be
estimated according to the following relation [13, 14]:
C s BC B N E S DOD
(9)
where NC (day) is the largest number of continuous
cloudy days of the location and DOD (-) is the maximum permissible depth of discharge of the battery.
If the dc bus voltage, VDC,bus is known, then one can
present the storage capacity in Ampere-hour, S’BC (Ah),
as: bus DC BC BC
V
S
S
,'
1000
(10)
The total number of batteries, NB (-), is obtained as:
' , 1 ' BC BC B
S
S
N
(11)where S’1BC (Ah) is the capacity of one of the batteries
selected for the system.
With the knowledge of the number of batteries, the connection of the battery bank can then be easily obtained. The number of batteries in series, NBs (-), is
given as: B DC bus DC Bs
V
V
N
1 , ,
(12)where VDC,1B (V) is the voltage rating of one of the
batteries selected for the system.
The number of batteries in parallel, NBp (-), in string of
NBp is given as:
Bs B Bp
N
N
P a g e |
voltage regulator must be able to withstand the maximum current produced by the panel as well as the maximum load current. Sizing of the voltage regulator can be obtained by multiplying short circuit current of the modules connected in parallel by a safety factor, SF (-). The result is the rated current of the voltage regulator, IVR (A), which is given as:
VR mp SC
I N I SF (14)
The power requirement of the inverter, WINV (kW), is
given as:
fd INV
P
W
1
.
25
(15)where Pfd (kW) is the power demand of the facility.
2.3 Life Cycle Cost Analysis
The life cycle cost (LCC) of an item consists of the total cost of acquiring and operating the item over its lifetime, expressed as the present worth [10]. The costs of a stand-alone PV system include: acquisition costs, operating costs, maintenance costs and replacement costs. Although the initial cost of the PV system is relatively high, the replacement costs, mainly for the storage batteries, and maintenance costs are relatively low, and there are no fuel costs [6].
The LCC for a PV system can be expressed as:
PV BVRINV INST O M
q C LCC
q
q; 1,2,3,4,5,6 , , , , , &
6 1
(16)where Cq ($) is the present worth of a component and
PV, B, VR, INT, INST and O&M stand for PV panel, battery, voltage regulator, inverter, installation and operation and maintenance, respectively.
The present worth of the batteries is given as:
kn j k B B B
i
d
C
C
C
1 0 01
1
(17)where i (%) is the interest rate; d(%) is the inflation rate; CB0 ($) is the initial cost of the batteries; j (-) is the
number of replacements; n is the life span of the battery, usually 5 years [5] and N (yr) is the life span of the PV system, usually 20 years [15].
The present worth of the operation and maintenance cost, CO&M [$], is expressed as:
& & /
1
1
1
1
1
1
1
1
NO M O M y
d
i
i
C
C
d
d
i
(18)where CO&M/y ($) is the operation and maintenance cost
per year.
The annualized LCC (ALCC) of the PV system in term of the present day money can be expressed as:
1
1
1
1
1
Nd
i
ALCC
LCC
d
i
(19)Therefore, the unit electrical cost, UEC ($/kWh), is calculated from: s
E
ALCC
UEC
366
(20)Another parameter for measuring economic merit of a PV system is the break-even point (BEP) or the payback time (PBT), in years. The BEP is the number of years of
it takes to recover an investment’s initial cost, which is
calculated as follows [16]:
MC AP
UEC
Q
LCC
BEP
(21)where
Q
AP
E
S
366
24
(22)and QAP (kWh/year) is the annual energy production
and UECMC ($/kWh) is the cost of the conventional
municipal electricity supply.
3. Input Data for Design and Economic Analyses
The input data for the design and economic analyses of the PV system under study are now presented in the following subsections.
3.1 Meteorological Data
The facility to be powered by the PV system is located at Choba Park campus of the University of Port Harcourt, Nigeria, which has a geographical position of latitude and longitude of 04o4 ’N and 7o ’E,
respectively, with an average solar insolation and sunshine hours of 3.75 (kWh/m2/day) and 4.25 (h),
3.2 Facility Energy Demand
The power requirement of the CAD/CAM laboratory under consideration is estimated from the summation of power rating of the appliances in the facility, Table 1. Thus, the power rating of the facility is approximated to 10 kW, to account for future upgrade of the facility.
Table 1
Power Rating of the CAD/CAM Facility
S/No Appliance Quantity Unit Power
[kW/Unit]
Total Power
[kW]
1 Laptop 5 0.025 0.125
2 Desktop Computer 10 0.350 3.500
3 Printer 1 1.230 1.230
4 Scanners 4 0.040 0.160
5 Fluorescent light 12 0.040 0.480
6 Television 1 0.140 0.140
7 Ceiling fan 8 0.075 0.600
8 Air Conditioner 4 0.750 3.000
Grand Total 9.235
3.3 Design and Economic Data
The PV system design and economic analyses are based on the input data in Table 2. The costs of the PV components are based on Abd El-Shafy [10]. The inflation and interest rates in Nigeria are 9.40 and 9.25%, respectively [18].
4. Results and Discussion
The output data and key parameter simulation for the design and economic analyses of the PV system under study are now presented in the following subsections.
4.1 Design and Economic Data
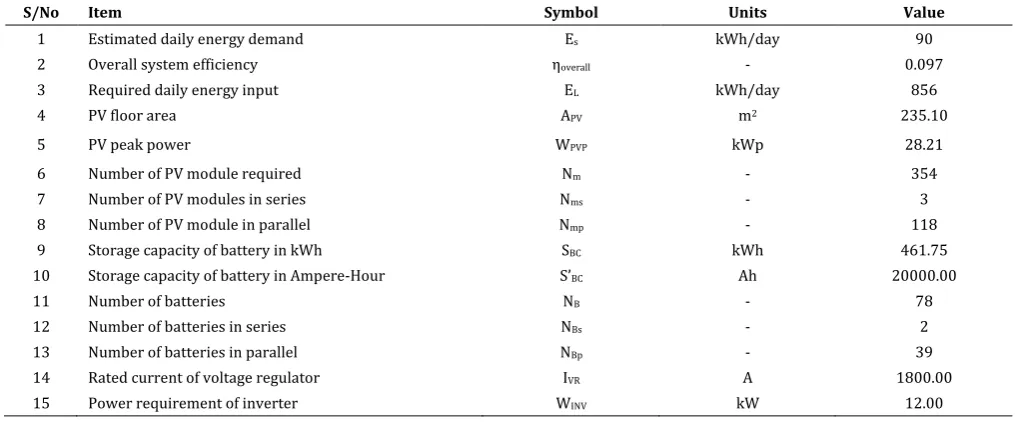
The computations were carried out, based on the input data in Tables 1 and 2, in a customized and elegant MS Excel spreadsheet for the design and economic analysis of PV system, on the basis of Equations (1) through (20). The design parameters are tabulated in Table 3, from where the cost of materials for the PV system is estimated in Table 4. This work adopted the overall system efficiency presented in Abd El-Shafy [10] and the PV peak power is based on the adopted available PV module in the Nigerian market.The life span of the system is taken as twenty (20) years [15], which is used to compute the LCC, the annualize life cycle cost (ALCC) and the unit electrical cost (UEC), Table 5.
Tabel 2
Input Data for the Design and Economic Analysis
S/No Item Symbol Units Value
1 Power rating of facility Wf kW 10.00
2 Average hours of operation of the facility per day H h 9.00
3 Average solar energy input Iav kWh/m2/day 3.75
4 Continuous cloudy days NC day 4
5 PV module efficiency ηPV - 0.12
6 Battery efficiency ηB - 0.90
7 Inverter efficiency ηINV - 0.90
8 Temperature correction factor TCF - 0.97
Selected PV Module Standard Test Data (DB F80)
9 Peak Solar Isolation PSI kW/m2 1.00
10 Maximum power WPV kW 0.08
11 Maximum voltage VDC,mod V 17.50
12 Short circuit current ISC A 5.03
13 DC bus voltage VDC,bus V 24.00
Selected Battery (Vision 6FM250D)
14 Battery capacity S1',BC Ah 250
15 Voltage
V
DC,1B V 12.0016 Depth of discharge DOD - 0.80
17 Safety factor SF - 1.25
Cost Estimate for the PV Components
Component: PV Battery Charger Inverter Installation M&O/year
P a g e |
Table 3
Design Parameters
S/No Item Symbol Units Value
1 Estimated daily energy demand Es kWh/day 90
2 Overall system efficiency ηoverall - 0.097
3 Required daily energy input EL kWh/day 856
4 PV floor area APV m2 235.10
5 PV peak power WPVP kWp 28.21
6 Number of PV module required Nm - 354
7 Number of PV modules in series Nms - 3
8 Number of PV module in parallel Nmp - 118
9 Storage capacity of battery in kWh SBC kWh 461.75
10 Storage capacity of battery in Ampere-Hour S’BC Ah 20000.00
11 Number of batteries NB - 78
12 Number of batteries in series NBs - 2
13 Number of batteries in parallel NBp - 39
14 Rated current of voltage regulator IVR A 1800.00
15 Power requirement of inverter WINV kW 12.00
Table 4
Priced Bill of Engineering Materials
S/No Item Quantity Unit Cost [US$] Total Cost [US$]
1 PV Module 28210.00 Wp 5 141050.00
2 Battery 20000.00 Ah 1.705 35000.00
3 Charger 1800.00 A 5.890 10602.00
4 Inverter 12000 W 0.831 9972.00
5 Installation/contingencies 10% of PV 14105.00
Grand Total PV system cost 210729.00
Table 5
Economic Parameters
S/No Item Symbol Present Worth (US$)
1 PV Module CPV 141050.00
2 Battery CB 137814.91
3 Charger CVR 9521.83
4 Inverter CINV 9972.00
5 Installation CINST 14105.00
6 Operation and Maintenance CO&M 57240.49
7 Life Cycle Cost (LCC) LCC 369321.98
8 Annualized LCC (ALCC) ALCC 18226.39
9 Unit Electrical Cost (UEC) per kWh UEC 0.60
10 Break Even Time BEP 10 years
One observes from Table 5 for the LCC analysis that the minimum unit electrical cost (UEC) per kWh of the designed system is 18.92% less than the value (0.74 US$/kWh) Abd El-Shafy obtained for Abu Rudies city of Sinai Peninsula, Egypt [10]. This low UEC is attributed to the more favorable economic index in Egypt, inflation rate of 3% and interest rate of 10%, as against 9.40%
and 9.25%, respectively, for Nigeria. If this present work is based on the Egyptian economic index one obtains for the UEC per kWh a value of $0.84, which is 13.51% higher than the one considered by Abd El-Shafy for the Egyptian site [10]. This increase is attributed to the higher insolation of 6.62 kWh/m2/day for the
location of the facility considered in this work. Therefore, the UEC per kWh of a PV system is a strong function of the meteorological data and the prevailing economic index.
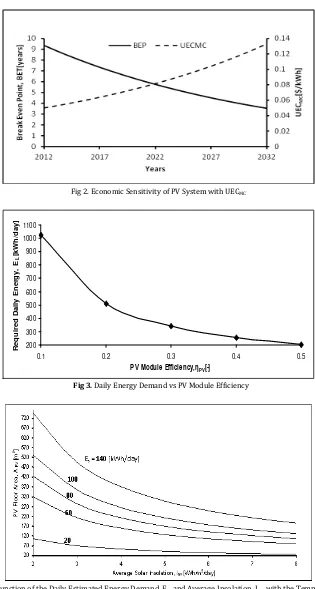
Also, from Table 5, the break-even point of the PV systems is ten (10) years, which means that the PV systems will pay for itself well before the warranted life
of the entire system is reached, allowing one to generates free electricity for the remaining ten (10) years of the useful live of the designed system. It is expected that municipal electricity cost will increase by 5% annually; once this is taken into account, the break-even point is only 6 - 7 years for PV systems that will be installed in the year 2020 as shown in Figure 2.
Fig 2. Economic Sensitivity of PV System with UECMC
Fig 3. Daily Energy Demand vs PV Module Efficiency
200 300 400 500 600 700 800 900 1000 1100
0.1 0.2 0.3 0.4 0.5
PV Module Efficiency,ηPV[-]
R
e
qu
ir
e
d
D
a
il
y
E
ne
rgy
,
E
L
[k
W
h/
da
y
P a g e |
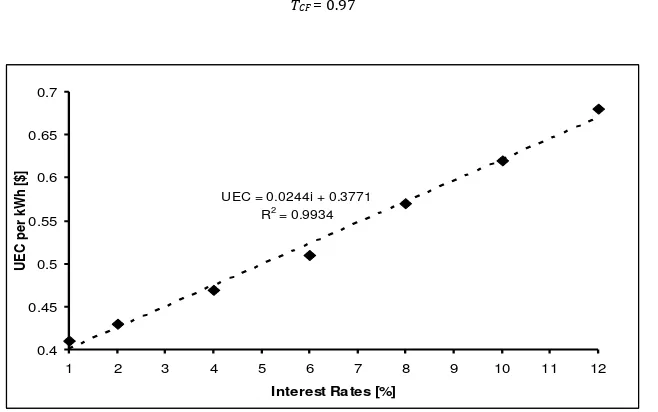
TCF = 0.97
UEC = 0.0244i + 0.3771 R2 = 0.9934
0.4 0.45 0.5 0.55 0.6 0.65 0.7
1 2 3 4 5 6 7 8 9 10 11 12
Interest Rates [%]
U
E
C
pe
r
kW
h
[$
]
Fig 5. Unit Electrical Cost per kWh vs Interest Rates
Presently, there are no energy policies in Nigeria, which encourage the utilization of renewable energy, as it is done in most developed countries. But there are strong indications the Nigerian government will soon give tax waiver for imported PV system components. If this is achieved one expects that the BEP would be reduced drastically as a result of subsequent LCC reduction.
4.2 Simulations on Key Parameters
It is interesting to see, graphically, based on the PV system under consideration, the relationships between some design and economic parameters such as the PV efficiency and the required daily energy, the floor area, the average insolation and daily estimated energy demand, the UEC, and the interest and inflation rates.
Figure 3 shows the variation of the daily energy requirement of the PV system with its efficiency; the daily energy requirement of the PV system is decreasing with increasing PV system efficiency. This is because high PV efficiency would definitely culminate into high energy generation. Therefore, intensive research is required to produce PV modules with high energy conversion efficiency to make PV system compete favourably with other energy technologies.
Figure 4 shows that the PV floor area of the system, at constant temperature correction factor of 0.97[-], decreases as the estimated daily energy demand, Es, and the average insolation, Iav, decreases and increases, respectively. This is expected because high solar insolation means abundant solar energy for electricity generation, thus, low PV floor area for the facility electrical energy demand.
As Figure 5 shows, the UEC per kWh of the PV system increases with increasing interest rate, at constant inflation rate. Thus, an appreciable reduction in the interest rate, and keeping inflation rate constant,
will encourage a wider application of the PV systems in the area. It is possible to predict the UEC of PV systems in climatic zone with Figure 5, as the prevailing interest rate moves.
5. Conclusion
A procedure for design and economic analyses of a stand alone PV system, embedded in a customized and elegant MS Excel spreadsheet, has been presented, and used for a facility located in Port Harcourt, Nigeria, at latitude 04o4 ’N and longitude 7o ’E. The automated
in most developed countries, there are strong indications that Nigerian government will soon adopt energy policies on green and sustainable energy technology that will favour PV system utilization. The expected government energy policies include tax exemptions or holidays and low interest rate on equipment and capital for projects on photovoltaic systems. It worth noting that electricity supply in Nigeria is grossly inadequate and unreliable; that about 90% of businesses in Nigeria own diesel generators. Therefore, future work should focus on the optimum combination of PV-Battery-Diesel system in electricity generation for optimum economic benefits to Nigeria.
References
[1] Energy Sector Management Assistance Program (2005) Nigeria: Expanding Access to Rural Infrastructure Issues and Options for Rural Electrification, Water Supply and Telecommunications, International Bank for Reconstruction and Development, World Bank, Washington D.C.
[2] Angelis-Dimakis A, Biberacher M, Dominguez J, Fiorese G, Gadocha S, Gnansounou E, Guariso G, Kartalidis A, Panichelli L, Pinedo I, and Robba M (2011) Methods and tools to evaluate the availability of renewable energy sources. J. Renewable and Sust. Energy Reviews Vol.15: 1182-1200.
[3] Kolhe M, Kolhe S, and Joshi JC (2002) Economic Viability of Stand-alone Solar Photovoltaic System in Comparison with Diesel-powered System for India. J. Energy Economics, 24 (2): 155-165.
[4] Ajan CW, Ahmed SS, Ahmad HBTF, and Mohd Zin AAB (2003) On the policy of photovoltaic and diesel generation mix for an off-grid site: East Malaysian perspectives. J. Solar Energy, 74: 453-467.
[5] Nafeh AA (2009) Design and Economic Analysis of a stand-alone PV system to electrify a remote area household in Egypt. Open Renewable Energy Journal, 2: 33-37.
[6] Markvart T (2000) Solar Electricity, Wiley, London.
[7] Ojosu JO (1990) The Iso-radiation Map for Nigeria. J. Solar and Wind Tech., 7 (5): 563-575.
[8] Augustine C and Nnabuchi MN (2009) Relationship between global solar radiation and sunshine hours for Calabar, Port Harcourt and Enugu, Nigeria. Int. Journal of Physical Sci., 4 (4): 182-188.
[9] Assad A (2010) A Stand-Alone Photovoltaic System, Case Study: A Residence in Gaza. J. of Applied Sciences in Environmental Sanitation, 5 (1): 81-91.
[10]Abd El-Shafy AN (2009) Design and Economic Analysis of a Stand-Alone PV System to Electrify a Remote Area Household in Egypt. The Open Ren. Energy Journal, 2: 33-37.
[11]Alamsyah TMI, Sopian K, Shahrir A (2003) In Technoeconomics Analysis of a Photovoltaic System to Provide Electricity for a Household in Malaysia. Proceedings in International Symposium on Renewable Energy: Environment Protection & Energy Solution for Sustainable Development, Kuola Lumpur, 387-396. [12]Oko COC and Ogoloma OB (2011) Generation of Typical
Meteorological Year for Port Harcourt Zone. Journal of Engineering Science and Technology, 6(2): 204-214.
[13]Wenham SR, Green MA, Watt ME (1994) Applied Photovoltaics, Centre for Photovoltaic Devices and Systems, Sydney.
[14]Mahmoud MM, Ibrik IH (2006) Techno-economic Feasibility of Energy Supply to Remote Villages in Palestine by PV-Systems, Diesel Generator and Electri Grid. Renewable Sustainable Energy Rev., 10: 128-138.
[15]Messenger R, and Ventre J (2000) Photovoltaic Systems Engineering, CRC Press LLC: Boca Raton, Florida.
[16]Al-Smairan M, Al-Adamat R, and Al-Nhoud O (2012) Techno-Economic Feasibility of Energy Supply of Remote Dump Site in Jordan Badia by Photovoltaic Systems, Diesel Generators and Electrical Grid. Research Journal of Applied Sciences, Engineering and Technology, Vol. 4(9): 1073-1081.
[17]Oko COC and Nnamchi SN (2012) Optimum Collector Tilt Angles for Low Latitudes. The Open Renewable Energy Journal, 5: 7-14. [18]Trading Economics (2011) World Economic Index,