The Performance Analysis of Civil Servant using Fuzzy
Inference System
–
Sugeno Method in Department of
Population Tomohon
Marlin Yuvina Tileng
Faculty of Information Technology Satya Wacana Christian UniversityDiponegoro Street, 52-60 Salatiga 50711, Indonesia
Eko Sediyono
Faculty of Information Technology Satya Wacana Christian University
Diponegoro Street, 52-60 Salatiga 50711, Indonesia
Irwan Sembiring
Faculty of Information Technology Satya Wacana Christian University Diponegoro Street, 52-60 Salatiga50711, Indonesia
ABSTRACT
Employee performance assessment is a way to know the quality of work performed by employees. This research was conducted to analyze the performance of existing employees in the Department of Population in Tomohon City by using Fuzzy Inference System Sugeno Method. Fuzzy model used the Sugeno fuzzy model order one. The process by doing substractive clustering to form membership functions and generate cluster centers and sigma, and the clustering of substractive fuzzy inference system will be established to create a rule. Overall analysis and variables is processed by using Matlab R2013a application assistance. In this research, the establishment of rule divided into two, namely staff and managers. Staff have four rules, while managers have five rule.
Keywords
Assesment Performance, Fuzzy Logic, Fuzzy Inference System Sugeno Method.
1.
INTRODUCTION
Performance assessment is a way to know the capabilities of each employee in an organization, because assessment of the managers can obtain materials considerations for developing human resources in the organization that he leads. On government agency, Civil Servants is required in organizing the task of government in community service apparatus because they are servant of country and community too. In an effort to improve the quality of performance of an employee, the government issued Government Regulation on Job Achievement Assessment of Civil Servant (Government Regulation No. 46/2011).
Employee performance assessment is very necessary in government agency, as it aims to gives evaluation for employees to improve performance. Assessment system conducted in each department in Tomohon, especially in the Department of Population under Government Regulation on List Of Assessment Work (Government Regulation No. 10/1979). List Of Assessment Work consists of eight (8) elements assessed, which consists of loyalty, achievement, responsibility, devotion, honesty, cooperation, initiative and leadership. Each element of the assessed valuation in the figure. if 91-100 (very good), 76-90 (good), 61-76 (enough), 51-61 (medium) and 50 and below (less). In the reality the objective of this assessment system is still less and just a formality, so that the performance assessment becomes invalid. Assessment system with List Of Assessment Work tended as a formality only and not directly related to what is done by civil servants.
This research was conducted to generate evaluation system of
criteria and sub-criteria assessment based on List Of Assessment Work. The completion of this research using Fuzzy Inference System of Sugeno method order one, which includes fuzzification process, the establishment of the rule, then deffuzikasi and testing..
2.
LITERATURE REVIEW
2.1
Research Preview
Research to determine how much laboratory assistants will be accepted at the time of recruitment by using fuzzy inference system sugeno method. This research is done to calculate the total of ideal assistant for a laboratory. The research result is a supporting tool for determine the ideal sum of accepted laboratory assistant in the recruitment process using rules, criterion that already determined such as previous total number of assistant, outgoing assistant and sum of practice participant [1]. Fuzzy inference system sugeno method also is used to predict bottled mineral water production. This research goal is to predict how many production total by applying the fuzzy inference system sugeno method order one based on variables total of demand, total of stock, production machine capability and available production cost [2]. Fuzzy inference system sugeno method to analyze the health, safety, and environment (HSE) in the combustion unit. The research is done to analyze the most suitable event, condition and application pattern for cement industry in determining HSE. The final result is the suitable sugeno method to determine the HSE value. The simulation design on the combustion unit of cement industry is using some membership functions such as trapezium, triangle and gaussian [3].
In this research, the fuzzy inference system with the Sugeno method is used to analyze employee performance assessment based on the variables input of criteria and sub-criteria. The end result is the establishment of the rule of staff and leadership, and also the grading of performance
2.2
Assessment Performance Employee
good = 76-90 enough = 61-75 medium = 51-60 less = 50 and below
2.3
Fuzzy Logic
Fuzzy logic is a logic that has fuzzy value or vagueness between right and wrong. In theoretical fuzzy logic, a value can be right and wrong at the same time. But how big is the “right” and “wrong” of the value is dependent on membership weight that it has [5]. Fuzzy logic is a method of problem solving that is very robust with a variety applications embedded and information processing. Fuzzy provides a simple way to infer from vague, ambiguous and imprecise information. [6]. Fuzzy logic is a way to map the input into an output space. Fuzzy logic use a kind of word term to describe the value of a variable. Fuzzy logic work by using degree of membership of a value and then used to determine the expected result based on determined specification. [7].
2.4
Fuzzy Inference System (FIS) Sugeno
Method
Fuzzy inference system is a popular methodology to implement fuzzy logic. Fuzzy inference system is one of the most famous applications of fuzzy logic and fuzzy set theory [8].
Sugeno method is introduced by Takagi-Sugeno Kang in the year 1985, so it also called TSK method. The system output (consequence) of Sugeno method is not in form of fuzzy sets but a constant or linear equation. According to Cox (1994), TSK method has two forms:
1. Sugeno model order zero The form in general:
IF (x1 is A1)o(x2 is A2)o(x3 is A3)o...o(xN is AN) THEN z=k
Where Ai is the i-the fuzzy set as the antecedence and k is a clear
constant as the consequence.
2. Sugeno model order one
The general form is :
IF (x1 is A1) o...o (xN is AN) THEN z=p1*x1+...+pN*xN+q
Where Ai is the i-th fuzzy set as antecedence and pi is the i-th firm constant and q also is a contant in the consequence. The defuzzification process is done by calculating the average value. In this research the membership function for Sugeno model ordo one is using Gaussian bell membership function and the equation is : [9]
2 2
2 ) (
) , ,
(
c x
e c x f
... (1)
2.5
Subtractive Clustering
Substractive Clustering based on the size of potential (density) of data points in some space. The basic concept ofsubstractive clusteringis determining the area within variable that has highest potential compared to other data point. A data point which has highest neighbor will become a cluster center, after subtracted with its density. The algorithm will chose other point that has highest neighbor to become the next cluster center. This process will iterate until all data points is tested.. If there are N data : X1,
X2,...,Xn and we state that the data is already normalized, the
density of point Xk can be calculated using equation:
k
D
N
j
r
j
X
k
X
Exp
1
(
/
2
)
2
... (2)
Where ||Xk-Xj|| is the distance between Xk and Xj, and r is
positive constant known as radius. After calculating the density of each points, then the point that has the highest density is chosen as cluster center.Then, other point’s density surrounding the chosen point will be subtracted using equation:
k D
b r
C X k X C
D k D
2 ) 2 / (
1 exp
* 1
... (3)
Where rb is a positive constant. The result of substractive
clustering is a cluster center matrix (C) and sigma (σ) that will be used in Gaussian bell membership function. [10]
2.6
Establishment of Fuzzy Inference System
with Subtractive Clustering
The design of fuzzy inference system based on the clustering result for Sugeno Method order one. Beforehand, we separate the input variables from output variables. For example, the number of input variable is m, and the output variable is i, the rules can be formed as followed lists:
[R1] IF (x1 is All) o (x2 is A12) o...o (xn is Alm) THEN (z= kl lxl+...+ kl mxm + kl0)
[R2] IF (x1 is A2 l) o (x2 is A22) o...o (xn is A2 m) THEN (z=
k2 lxl+...+ k2 mxm + k20)
...
[Rn] IF (x1 is All) o (x2 is A12) o...o (xn is Alm) THEN (z= kl lxl+...+ kl mxm + kl 0)
where :
Aijis the i-th rule and j-th variable of fuzzy sets as the
antecedence
Kijis the coefficient of the fuzzy output equation for i-th
rule and j-th (i=1,2,...,r; j=1,2,...,m), and k10 is the constant
for the fuzzy output equation for i-th rule
“o”-sign is used as the operator of the antecedence (in this research, it’s a product operator)
The number of rules created will the same as the cluster formed on previous step. For example, if the clustering process produce 5 cluster center, the fuzzy inference system rules will also have 5 rules. [9]
3.
METODOLOGY RESEARCH
In this research there are steps that will be done:
1. Problem identification, i.e. determining the criterion and sub-criteria that will be used to grade
2. Data gathering. In this step, manager grade it’s staff based on the criterion and sub-criteria that already determined. 3. Data processing that include:
- Fuzzification process which is: creating fuzzy set for each input variable and output variable. In this step we use subtractive clustering to get the membership function (MF) needed.
- Rule base forming by combining some input variable. We complete the steps by carrying clustering product into next step which is creating the consequence equation of the fuzzy rule base.
4.
RESULTS AND ANALYSIS
4.1
Determination of Criteria and Sub
Criteria
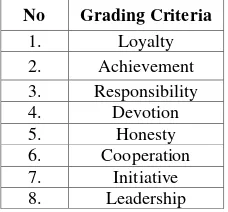
Grading criteria used is based on List Of Assessment Work grading that currently used in Department of Population when grading it’s officer. The grading criteria can be seen at Table 1.
Table 1. Criteria of List Of Assessment Work Grading
Each criteria or grading component on List Of Assessment Work has sub-criteria based on Government Regulation No. 10 year 1979. These sub-criteria can be seen at Table 2
Table 2. Sub-criteria of List Of Assessment Work Grading
Criteria Sub-Criteria
Loyalty
Never doubt the truth of Pancasila in words, attitudes, behavior and deeds.
Highly honor the country and the
government, always accentuate the country prominence above the self prominence, someone, or group.
Try to deepen the knowledge about Pancasila and Constitution of the Republic of Indonesia 1945, and always try to learn the state policy, government politics, and the government plans in order to do their work effectively and efficiently.
Not involved as sympathizer or member of group that try to change or betray Pancasila dan UUD 1945.
Not deliver languages or sentences or do something that can change or betray Pancasila, UUD 1945, the country, and government.
Achievement
Have skills in doing his/her duties. Have experience in their field or other field that correspond with the duties.
Mean to do his/her duties and without considering time.
Do his/ her duties effectively and efficiently. The work result extend the standard work, in quality and quantity.
Responsibility
Always finish their duties well and on time. Always in the work place in any condition. Always accentuate the official prominence more than self prominence, someone, or group.
Never blame to others for the mistakes made.
Never doubt the truth of Pancasila in words, attitudes, behavior and deeds.
Brave to endure the risks made or the things done.
Criteria Sub-Criteria
done.
Devotion
Obey the constitution and the civil laws applied.
Obey well the civil order that given by the head authorized.
Obey the work time provision. Give best service as their fields. Behave politely.
Honesty
Do their duties sincerely. Not misapply authority.
Report the work results to the head appropriately.
Cooperation
Know deeply others duty that correspond with his/her duty.
Appreciate others opinion.
Can adjust his/her opinion with others, if they are true.
Want to consider and accept good opinion from others.
Always able to cooperate with others as the time and duty scheduled.
Always ready to accept the decision made even though not agree.
Initiative
Without waiting direction and order from the head, make own decision or do something needed in doing his/her duty as long as not contradict with the head general policy.
Try to find new work procedures to obtain efficiency and maximum results.
Give advice that considered good and useful for the head, asked or not asked that correspond with the duty.
Leadership
Master the entirely of duties Make decision well and quickly Give opinion clearly to others Able to decide the priority well Act firmly and not take sides Give good examples
Try to bring up and develop cooperation Know the ability and the limitation of subordinates
Try to arouse spirit and activate the subordinates in doing their duties
Pay attention to the chance and support the development of subordinates
Want to consider the subordinates advices
4.2
The Analysis by using Fuzzy Inference
System Using Sugeno method
In this research, there are two steps that need to be done. First, subtractive clustering and then second, building fuzzy inference system using fuzzy subtractive clustering. The first step is needed to build the membership function (antecedence part of the rule) where the second step’s goal is to build Z part of the rule (consequence) using least squared method.
4.2.1
Subtractive Clustering
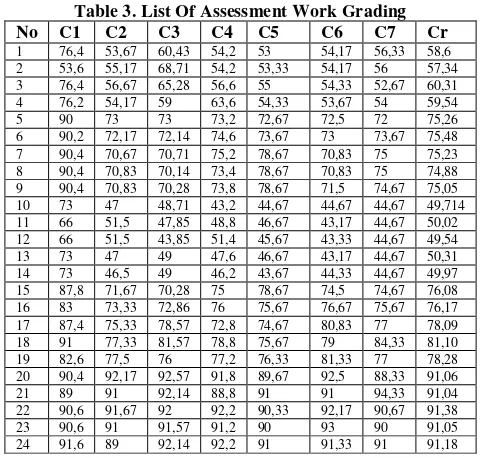
In the subtractive clustering, we need to input which data that need to be clustered. Data is taken from list of assessment work grading. (see table 3)
No Grading Criteria
1. Loyalty
2. Achievement
3. Responsibility
4. Devotion
5. Honesty
6. Cooperation
7. Initiative
Table 3. List Of Assessment Work Grading
No C1 C2 C3 C4 C5 C6 C7 Cr
1 76,4 53,67 60,43 54,2 53 54,17 56,33 58,6 2 53,6 55,17 68,71 54,2 53,33 54,17 56 57,34 3 76,4 56,67 65,28 56,6 55 54,33 52,67 60,31 4 76,2 54,17 59 63,6 54,33 53,67 54 59,54 5 90 73 73 73,2 72,67 72,5 72 75,26 6 90,2 72,17 72,14 74,6 73,67 73 73,67 75,48 7 90,4 70,67 70,71 75,2 78,67 70,83 75 75,23 8 90,4 70,83 70,14 73,4 78,67 70,83 75 74,88 9 90,4 70,83 70,28 73,8 78,67 71,5 74,67 75,05 10 73 47 48,71 43,2 44,67 44,67 44,67 49,714 11 66 51,5 47,85 48,8 46,67 43,17 44,67 50,02 12 66 51,5 43,85 51,4 45,67 43,33 44,67 49,54 13 73 47 49 47,6 46,67 43,17 44,67 50,31 14 73 46,5 49 46,2 43,67 44,33 44,67 49,97 15 87,8 71,67 70,28 75 78,67 74,5 74,67 76,08 16 83 73,33 72,86 76 75,67 76,67 75,67 76,17 17 87,4 75,33 78,57 72,8 74,67 80,83 77 78,09 18 91 77,33 81,57 78,8 75,67 79 84,33 81,10 19 82,6 77,5 76 77,2 76,33 81,33 77 78,28 20 90,4 92,17 92,57 91,8 89,67 92,5 88,33 91,06 21 89 91 92,14 88,8 91 91 94,33 91,04 22 90,6 91,67 92 92,2 90,33 92,17 90,67 91,38 23 90,6 91 91,57 91,2 90 93 90 91,05 24 91,6 89 92,14 92,2 91 91,33 91 91,18
We define some constant parameter for subtractive clustering, i.e. radius, squash factor, accept ratio, reject ratio, minX, maxX as such:
Jari-jari = 0.3 sqshFactor = 1.25 acceptRatio = 0.5 rejectRatio = 0.15
minX = 0 0 0 0 0 0 0 0
maxX = 100 100 100 100 100 100 100 100
Next, we normalize the input data:
m j
n i
j XMin j XMax
j XMin ij X ij
X , 1,2,..., ; 1,2,...,
...(4)
Normalized input data :
0.7640 0.5367 0.6043 0.5420 0.5300 0.5417 0.5633 0.5860 0.5360 0.5517 0.6871 0.5420 0.5333 0.5467 0.5600 0.5734 0.7640 0.5667 0.6529 0.5660 0.5500 0.5433 0.5267 0.6031 0.7620 0.5417 0.5900 0.6360 0.5433 0.5367 0.5400 0.5954 0.9000 0.7300 0.7300 0.7320 0.7267 0.7250 0.7200 0.7526 0.9020 0.7217 0.7214 0.7460 0.7367 0.7300 0.7367 0.7549 0.9040 0.7067 0.7071 0.7520 0.7867 0.7083 0.7500 0.7523 0.9040 0.7083 0.7014 0.7340 0.7867 0.7083 0.7500 0.7489 0.9040 0.7083 0.7029 0.7380 0.7867 0.7150 0.7467 0.7506 0.7300 0.4700 0.4871 0.4320 0.4467 0.4467 0.4467 0.4971 0.6600 0.5150 0.4786 0.4880 0.4667 0.4317 0.4467 0.5003 0.6600 0.5150 0.4386 0.5140 0.4567 0.4333 0.4467 0.4954 0.7300 0.4700 0.4900 0.4760 0.4667 0.4317 0.4467 0.5031 0.7300 0.4650 0.4900 0.4620 0.4367 0.4433 0.4467 0.4997 0.8780 0.7167 0.7029 0.7500 0.7867 0.7450 0.7467 0.7608 0.8300 0.7333 0.7286 0.7600 0.7567 0.7667 0.7567 0.7617 0.8740 0.7533 0.7857 0.7280 0.7467 0.8083 0.7700 0.7809 0.9100 0.7733 0.8157 0.7880 0.7567 0.7900 0.8433 0.8110 0.8260 0.7750 0.7600 0.7720 0.7633 0.8133 0.7700 0.7828 0.9040 0.9217 0.9257 0.9180 0.8967 0.9250 0.8833 0.9106 0.8900 0.9100 0.9214 0.8880 0.9100 0.9100 0.9433 0.9104 0.9060 0.9167 0.9200 0.9220 0.9033 0.9217 0.9067 0.9138 0.9060 0.9100 0.9157 0.9120 0.9000 0.9300 0.9000 0.9105 0.9160 0.8900 0.9214 0.9220 0.9100 0.9133 0.9100 0.9118
Next, we calculate the first potential (density) of each data point and choose the highest density (potential) by using the equation (2). Density result : (see Table. 4)
Table 4. Point Of Data Potential
1 2 3 4 5 6 7 8
2.7399 1.2254 2.5945 2.4571 6.7421 7.2475 6.9547 6.8704
9 10 11 12 13 14 15 16
7.0147 4.0299 4.0204 3.6160 4.3069 4.2177 7.3455 6.7209
17 18 19 20 21 22 23 24
5.6734 3.5981 5.1795 4.6581 4.4109 4.8047 4.7963 4.6968
From the above matrix, we can see that the highest density is on data point 15 which is 7.3455. Therefore, the 15-th data point is chosen as cluster center.
After we choose the highest potential (density) then we loop the process. In this research, there are 4 loops. Iteration stops at the fourth loop because there are no data point that have potential to be cluster center. Iteration will be stop when the ratio <reject ratio. The iteration process will produce number of cluster, cluster center and sigma.
Equation for cluster center:
j
XMin
j
XMin
j
XMax
ij
Center
ij
Center
*
(
)
... (5)Equation for cluster sigma :
8
/
)
max
(
*
j
XMin
j
X
j
r
j
... (6)As the end result on the fourth iteration with radius=0.3; accept ratio = 0.5; reject ratio=0.15; squash factor = 1,25; minX =[0 0 0 0 0 0 0] and maxX = [100 100 100 100 100 100 100 100]; we got four cluster which has center (C):
87.80 71.67 70.28 75.00 78.67 74.50 74.67 76.08 90.60 91.67 92.00 92.20 90.33 92.17 90.67 91.38 73.00 47.00 49.00 47.60 46.67 43.17 44.67 50.31 76.40 56.67 65.28 56.60 55.00 54.33 52.67 60.31
and sigma (σ) :
10.61 10.61 10.60 10.61 10.61 10.61 10.61 10.61
4.2.2
Establish a Fuzzy Inference System with
Subtractive Clustering
Next step is to complete the consequence part of the fuzzy rule using sugeno method order one. We take the cluster center and sigma from previous step as such:
60.3143 52.6667 54.3333
55.000043.166744.666750.3143 46.666792.166790.666791.3762 90.3333
74.5000 74.5000 74.5000 78.6667
56.6000 65.2857 47.0000
76.400047.000049.000047.6000 73.000091.666792.000092.2000 90.6000
75.0000 70.2857 71.6667 87.8000
C
10.606610.606610.606610.606610.606610.606610.6066
The equation is solved based on the resulting cluster thus we can obtain Z equation for each rule as the output. The process is by calculating degree of membership for each data point and then normalize until we get U matrix. The matrix U is obtained by using the equation:
ki μ ) i(m k d ki *μ ij X k ij
d dan 1
... (7)
Normalization process is calculated by dividing dkij and
dki(j+1)against total degree of membership of data point i on
cluster k:
r
k ki
k ij d k ij d
1
... (8)
r
k ki
k m i d k
m i d
1 ) 1 ( ) 1 (
... (9)
The solution is below: Rule number 1
10.6315 14.4915 9.6414 9.5617 0.2859 0.1683 0.0957 0.1048 0.0795 23.3337 22.1209 22.6566 21.9427 22.9776
0 0.2139 0.6607 1.3638 0.6940 8.1675 8.2424 8.3529 8.0131 7.9587 We got U matrix:
Only column 1- 8 printed, column 11-32 is 0
0.0018 0.0013 0.0015 0.0013 0.0013 0.0013 0.0014 0.0000 0.0000 0.0000 0.0000 0.0000 0.0000 0.0000 0.0000 0.0000 0.0050 0.0037 0.0042 0.0037 0.0036 0.0035 0.0034 0.0001 0.0054 0.0038 0.0042 0.0045 0.0038 0.0038 0.0038 0.0001 67.6178 54.8455 54.8455 54.9958 54.5951 54.4699 54.0942 0.7513 76.2275 60.9877 60.9675 63.0441 62.2553 61.6919 62.2553 0.8451 82.1473 64.2155 64.2587 68.3349 71.4851 64.3669 68.1532 0.9087 81.4019 63.7828 63.1610 66.0940 70.8364 63.7828 67.5347 0.9005 83.4889 65.4181 64.9123 68.1580 72.6526 66.0338 68.9584 0.9235 0.0000 0.0000 0.0000 0.0000 0.0000 0.0000 0.0000 0.0000 0.0000 0.0000 0.0000 0.0000 0.0000 0.0000 0.0000 0.0000 0.0000 0.0000 0.0000 0.0000 0.0000 0.0000 0.0000 0.0000 0.0000 0.0000 0.0000 0.0000 0.0000 0.0000 0.0000 0.0000 0.0000 0.0000 0.0000 0.0000 0.0000 0.0000 0.0000 0.0000 87.8000 71.6667 70.2857 75.0000 78.6667 74.5000 74.6667 1.0000 67.0175 59.2123 58.8278 61.3654 61.0963 61.9037 61.0963 0.8074 45.1421 38.9097 40.5821 37.6012 38.5653 41.7504 39.7705 0.5165 23.2678 19.7733 20.8570 20.1483 19.3472 20.1995 21.5632 0.2557 41.2659 38.7180 37.9686 38.5681 38.1351 40.6331 38.4682 0.4996 0.0256 0.0262 0.0263 0.0260 0.0254 0.0262 0.0251 0.0003 0.0234 0.0240 0.0243 0.0234 0.0240 0.0240 0.0248 0.0003 0.0214 0.0216 0.0217 0.0217 0.0213 0.0217 0.0214 0.0002 0.0300 0.0301 0.0303 0.0302 0.0298 0.0308 0.0298 0,0003 0.0320 0.0311 0.0322 0.0322 0.0318 0.0319 0.0318 0.0003
The next process is the same for each rule (cluster) up to rule #4 to obtain final normalized U matrix. The z vector as the output vector is in form of:
Z= [z1 z2 ... zn]T
From vector k, matrix U and vector z are then formed this linear equation:
U*k = z
The above equation is used to find output coefficient value for each rule for each variables (kij, i=1,2,...,r; and j=1,2,...,m+1). Matrix U is not a square matrix, that’s why we use least squared method to solve the above equation.
This is normalized U matrix:
Column 1- 10
0.0021 0.0015 0.0017 0.0015 0.0015 0.0015 0.0016 0.0000 0.0000 0.0000 0.0003 0.0003 0.0004 0.0003 0.0003 0.0003 0.0003 0.0000 0.0000
0.0000
0.0048 0.0035 0.0041 0.0035 0.0034 0.0034 0.0033 0.0001 0.0000 0.0000 0.0077 0.0055 0.0059 0.0064 0.0055 0.0054 0.0054 0.0001 0.0000 0.0000 89.9506 72.9599 72.9599 73.1598 72.6267 72.4602 71.9604 0.9995 0.0098 0.0079 90.1672 72.1404 72.1166 74.5729 73.6399 72.9735 73.6399 0.9996 0.0135 0.0108 90.3786 70.6499 70.6975 75.1822 78.6480 70.8166 74.9822 0.9998 0.0126 0.0098 90.3793 70.8171 70.1268 73.3832 78.6486 70.8171 74.9828 0.9998 0.0088 0.0069 90.3793 70.8171 70.2696 73.7831 78.6487 71.4836 74.6496 0.9998 0.0102 0.0080
0.0000 0.0000 0.0000 0.0000 0.0000 0.0000 0.0000 0.0000 0.0000 0.0000 0.0000 0.0000 0.0000 0.0000 0.0000 0.0000 0.0000 0.0000 0.0000 0.0000 0.0000 0.0000 0.0000 0.0000 0.0000 0.0000 0.0000 0.0000 0.0000 0.0000 87.7736 71.6451 70.2646 74.9775 78.6430 74.4776 74.6442 0.9997 0.0207 0.0169 82.9414 73.2816 72.8057 75.9464 75.6133 76.6126 75.6133 0.9993 0.0530 0.0468 87.0553 75.0362 78.2615 72.5129 74.3722 80.5145 76.6963 0.9961 0.3430 0.2957 85.4608 72.6260 76.6062 74.0034 71.0608 74.1912 79.1999 0.9391 5.5391 4.7072 81.9533 76.8932 75.4050 76.5956 75.7357 80.6965 76.3971 0.9922 0.6460 0.6061 0.0264 0.0269 0.0271 0.0268 0.0262 0.0270 0.0258 0.0003 90.3736 92.1397 0.0267 0.0273 0.0277 0.0267 0.0273 0.0273 0.0283 0.0003 88.973 90.9727 0.0213 0.0216 0.0217 0.0217 0.0213 0.0217 0.0214 0.0002 90.5787 91.6451 0.0304 0.0305 0.0307 0.0306 0.0302 0.0312 0.0302 0.0003 90.5696 90.9695 0.0334 0.0324 0.0336 0.0336 0.0332 0.0333 0.0332 0.0004 91.5666 88.9676 Column 11-Column 20
0.0000 0.0000 0.0000 0.0000 0.0000 0.0000 8.3653 5.8762 6.6166 5.9346 0.0000 0.0000 0.0000 0.0000 0.0000 0.0000 3.1140 3.2050 3.9921 3.1489 0.0000 0.0000 0.0000 0.0000 0.0000 0.0000 3.1309 2.3222 2.6755 2.3195 0.0000 0.0000 0.0000 0.0000 0.0000 0.0000 5.4612 3.8821 4.2285 4.5582 0.0079 0.0079 0.0079 0.0079 0.0078 0.0001 0.0000 0.0000 0.0000 0.0000 0.0108 0.0112 0.0111 0.0110 0.0111 0.0002 0.0000 0.0000 0.0000 0.0000 0.0098 0.0104 0.0109 0.0098 0.0104 0.0001 0.0000 0.0000 0.0000 0.0000 0.0068 0.0071 0.0077 0.0069 0.0073 0.0001 0.0000 0.0000 0.0000 0.0000 0.0079 0.0083 0.0089 0.0081 0.0084 0.0001 0.0000 0.0000 0.0000 0.0000 0.0000 0.0000 0.0000 0.0000 0.0000 0.0000 70.9524 45.6817 47.3479 41.9883 0.0000 0.0000 0.0000 0.0000 0.0000 0.0000 63.0073 49.1648 45.6871 46.5872 0.0000 0.0000 0.0000 0.0000 0.0000 0.0000 64.0191 49.9543 42.5409 49.8573 0.0000 0.0000 0.0000 0.0000 0.0000 0.0000 70.0082 45.0738 46.9918 45.6492 0.0000 0.0000 0.0000 0.0000 0.0000 0.0000 70.6745 45.0187 47.4390 44.7282 0.0166 0.0177 0.0185 0.0176 0.0176 0.0002 0.0000 0.0000 0.0000 0.0000 0.0465 0.0485 0.0483 0.0490 0.0483 0.0006 0.0000 0.0000 0.0000 0.0000 0.3084 0.2857 0.2930 0.3172 0.3022 0.0039 0.0000 0.0000 0.0000 0.0000 4.9652 4.7965 4.6058 4.8087 5.1333 0.0609 0.0000 0.0000 0.0000 0.0000 0.5944 0.6038 0.5970 0.6361 0.6022 0.0078 0.0000 0.0000 0.0000 0.0000 92.5444 91.7732 89.6405 92.4730 88.3075 0.9997 0.0000 0.0000 0.0000 0.0000 92.1152 88.7733 90.9727 90.9727 94.3050 0.9997 0.0000 0.0000 0.0000 0.0000 91.9783 92.1783 90.3120 92.1449 90.6453 0.9998 0.0000 0.0000 0.0000 0.0000 91.5407 91.1694 89.9698 92.9688 89.9698 0.9997 0.0000 0.0000 0.0000 0.0000 92.1093 92.1664 90.9668 91.3001 90.9668 0.9996 0.0000 0.0000 0.0000 0.0000 Column 21-Column 30
5.8032 5.9309 6.1682 0.1095 68.0325 47.7890 53.8103 48.2639 47.1954 48.2342 3.0985 3.1760 3.2534 0.0581 50.4857 51.9613 64.7218 51.0508 50.2345 51.4904 2.2539 2.2266 2.1583 0.0410 73.2643 54.3409 62.6062 54.2770 52.7426 52.1033 3.8940 3.8463 3.8702 0.0717 70.7311 50.2791 54.7656 59.0354 50.4338 49.8150 0.0000 0.0000 0.0000 0.0000 0.0397 0.0322 0.0322 0.0323 0.0320 0.0320 0.0000 0.0000 0.0000 0.0000 0.0192 0.0154 0.0154 0.0159 0.0157 0.0156 0.0000 0.0000 0.0000 0.0000 0.0089 0.0069 0.0069 0.0074 0.0077 0.0069 0.0000 0.0000 0.0000 0.0000 0.0119 0.0093 0.0092 0.0097 0.0104 0.0093 0.0000 0.0000 0.0000 0.0000 0.0105 0.0082 0.0082 0.0086 0.0091 0.0083 43.4138 43.4138 43.4138 0.9720 2.0476 1.3183 1.3664 1.2117 1.2528 1.2528 44.5506 41.2093 42.6413 0.9547 2.9927 2.3352 2.1700 2.2128 2.1160 1.9573 44.2961 42.0328 43.3261 0.9700 1.9809 1.5457 1.3163 1.5427 1.3706 1.3006 44.7541 41.3976 42.8361 0.9590 2.9918 1.9262 2.0082 1.9508 1.9126 1.7691 42.2756 42.9210 43.2437 0.9681 2.3255 1.4813 1.5610 1.4718 1.3911 1.4123 0.0000 0.0000 0.0000 0.0000 0.0057 0.0047 0.0046 0.0049 0.0051 0.0048 0.0000 0.0000 0.0000 0.0000 0.0056 0.0049 0.0049 0.0051 0.0051 0.0051 0.0000 0.0000 0.0000 0.0000 0.0017 0.0015 0.0015 0.0014 0.0014 0.0016 0.0000 0.0000 0.0000 0.0000 0.0001 0.0001 0.0001 0.0001 0.0001 0.0001 0.0000 0.0000 0.0000 0.0000 0.0007 0.0006 0.0006 0.0006 0.0006 0.0007 0.0000 0.0000 0.0000 0.0000 0.0000 0.0000 0.0000 0.0000 0.0000 0.0000 0.0000 0.0000 0.0000 0.0000 0.0000 0.0000 0.0000 0.0000 0.0000 0.0000 0.0000 0.0000 0.0000 0.0000 0.0000 0.0000 0.0000 0.0000 0.0000 0.0000 0.0000 0.0000 0.0000 0.0000 0.0000 0.0000 0.0000 0.0000 0.0000 0.0000 0.0000 0.0000 0.0000 0.0000 0.0000 0.0000 0.0000 0.0000 0.0000 0.0000
Column 31-Column 32 50.1636 0.8905 52.7463 0.9419 50.5051 0.9590 50.1244 0.9282 0.0317 0.0004 0.0157 0.0002 0.0073 0.0001 0.0099 0.0001 0.0087 0.0001 1.2528 0.0280 2.0254 0.0453 1.3406 0.0300 1.8306 0.0410 1.4229 0.0319 0.0049 0.0001 0.0051 0.0001 0.0015 0.0000 0.0001 0.0000 0.0006 0.0000 0.0000 0.0000 0.0000 0.0000 0.0000 0.0000 0.0000 0.0000 0.0000 0.0000
Using least squared method, we can get the following k coefficients:
From the k coefficients matrix above, we can build Z part for each rule, so that:
Z1 = 0,6313X1+ 2,2082X2+( -0,0399X3) + 0,5428X4 + 0,5829X5 + 0,2715X6
0,3723X7 +( -267,8862)
Z2 = -238,3828 X1+ (-217,6611X2) + 317,4616 X3 + 199,0879X4 +
(-426,9637X5) + 190,2301X6 + 166,7087X7 + 0
Z3 = 0,2478X1+ 0,3535X2 + 0,2015X3 + 0,1209X4 + (-0,0003X5) + 0X6 + 0X7 +0
Z4 = 0,1857X1+ 0X2 + 0,3690X3 + 0,2103X4 + 0X5 + 0X6 + 0,2032X7 +0
The above process is the calculation process for staff, the same process is performed for building Z part for manager’s rule until we obtain the k coefficients matrix below:
0,66605743 -0,04975054 0 0,27951477 0 0 0 0 0 0 0,46211815 0 0 0 0 0,16290604 0 0 0 0 0 0,203285960 0 0,79504179 0 0 0 0,58525386 0 0 0,31827622 0 0 0 0 0 0,6602402 0 0 0 0 0 0 0 0
And thus, we produce these Z equations:
Z1 = 0,66605743X1+ (-0,04975054X2)+( 0X3) + 0,27951477X4 + 0X5 + 0X6 +
0X7 +0X8+
Z2 = 0X1+ 0,46211815X2 + 0X3 + 0X4 + 0X5 + 0X6 + 0,16290604X7 +
0X8+0X9
Z3 = 0X1+ 0X2 + 0X3 + 0,20328596X4 + 0X5 + 0X6 + 0,79504179X7 +0X8+0X9
Z4 = 0,58525386X1+ 0X2 + 0X3 + 0,31827622X4 + 0X5 + 0X6 + 0X7 +0X8+0X9
Z5 = 0,6602402X1+ 0X2 + 0X3 + 0X4 + 0X5 + 0X6 + 0X7 +0X8++0X9
As we can see, there are differences between staff’s rules and Manager’s rules, which is, there are four rules for staff, where the rules for manager is five.
4.2.3
Establishment of Rule
In this research, the rules is categorized into two parts: for staff and for manager. Staff has 4 rules where manager has 5 rules. The following lists are rules for staff:
[R1] IF(C1 is in1cluster1) and (C2 is in2cluster1) and (C3 is in3cluster1) and (C4 is in4cluster1) and (C5 is in5cluster1) and (C6 is in6cluster1) and (C7 is in7cluster1) THEN (out is Z1)
[R2] IF(C1 is in1cluster2) and (C2 is in2cluster2) and (C3 is in3cluster2) and (C4 is in4cluster2) and (C5 is in5cluster2) and (C6 is in6cluster2) and (C7 is in7cluster2) THEN (out is Z2)
[R3] IF(C1 is in1cluster3) and (C2 is in2cluster3) and (C3 is in3cluster3) and (C4 is in4cluster3) and (C5 is in5cluster3) and (C6 is in6cluster3) and (C7 is in7cluster3) THEN (out is Z3)
[R4] IF(C1 is in1cluster4) and (C2 is in2cluster4) and (C3 is in3cluster4) and (C4 is in4cluster4) and (C5 is in5cluster4) and (C6 is in6cluster4) and (C7 is in7cluster4) THEN (out is Z4)
These are rules for Managers:
[R1] IF(C1 is in1cluster1) and (C2 is in2cluster1) and (C3 is in3cluster1) and (C4 is in4cluster1) and (C5 is in5cluster1) and (C6 is in6cluster1) and (C7 is in7cluster1) and (C8 is in8cluster5) THEN (out is Z1)
[R2] IF(C1 is in1cluster2) and (C2 is in2cluster2) and (C3 is in3cluster2) and (C4 is in4cluster2) and (C5 is in5cluster2) and (C6 is in6cluster2) and (C7 is in7cluster2) and (C8 is in8cluster5) THEN (out is Z2)
[R3] IF(C1 is in1cluster3) and (C2 is in2cluster3) and (C3 is in3cluster3) and (C4 is in4cluster3) and (C5 is in5cluster3) and (C6 is in6cluster3) and (C7 is in7cluster3) and (C8 is in8cluster5) THEN (out is Z3)
[R4] IF(C1 is in1cluster4) and (C2 is in2cluster4) and (C3 is in3cluster4) and (C4 is in4cluster4) and (C5 is in5cluster4) and (C6 is in6cluster4) and (C7 is in7cluster4) and (C8 is in8cluster5) THEN (out is Z4)
[R5] IF(C1 is in1cluster5) and (C2 is in2cluster5) and (C3 is in3cluster5) and (C4 is in4cluster5) and (C5 is in5cluster5) and (C6 is in6cluster5) and (C7 is in7cluster5) and (C8 is in8cluster5) THEN (out is Z5)
After we form both rules for staff and manager, we must put these rules on test then compare it to existing List Of Assessment Work. Beforehand, we must calculate z and alpha-predicate for each rule. Both values will be used on defuzzification process using weighted average method as seen on this equation:
) ...(10 ...
...
2 1
2 2 1 1
n n nz
z z Z
In the following part, we will take one example each from performance grading and fuzzy calculation process for staff and manager. (see Table. 5 and Table. 6)
Table 5. Staff’s average grade for each category Cr 1 2 3 4 5 6 7 Nilai 72,6 69,3 68,2 67,7 67,3 68,1 69,5
Table 6. Manager’s average grade for each category Cr 1 2 3 4 5 6 7 8
Nilai 90,5 73,4 71,9 73,8 73,3 72,7 72,5 72,6
From the table above, we must calculate z and alpha-predicate value for each rule. Alpha-predicate can be obtained by multiplication all
µ
values. Theµ
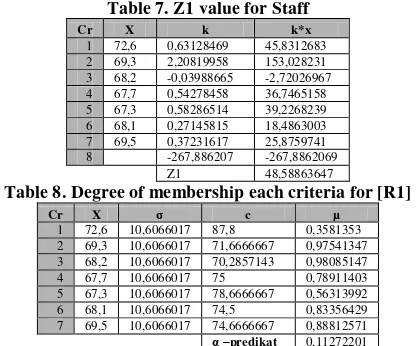
values are degree of membership values that calculated using equation (1). On the next following tables, we can observe the value of z and alpha-predicate for each rules: (see Table. 7 – Table 14)Table 7. Z1 value for Staff
Cr X k k*x
1 72,6 0,63128469 45,8312683 2 69,3 2,20819958 153,028231 3 68,2 -0,03988665 -2,72026967 4 67,7 0,54278458 36,7465158 5 67,3 0,58286514 39,2268239 6 68,1 0,27145815 18,4863003 7 69,5 0,37231617 25,8759741 8 -267,886207 -267,8862069
Z1 48,58863647
Table 8. Degree of membership each criteria for [R1]
Cr X σ c µ
1 72,6 10,6066017 87,8 0,3581353 2 69,3 10,6066017 71,6666667 0,97541347 3 68,2 10,6066017 70,2857143 0,98085147 4 67,7 10,6066017 75 0,78911403 5 67,3 10,6066017 78,6666667 0,56313992 6 68,1 10,6066017 74,5 0,83356429 7 69,5 10,6066017 74,6666667 0,88812571
α –predikat 0,11272201
Based on the both tables above, z value for [R1] and alpha-predicate value for [R1] for staff is 316.474743 and 0.11272201
Table 9. Z2 value for Staff
Cr x k k*x
1 72,6 -238,382787 -17306,5903 2 69,3 -217,661065 -15083,9118 3 68,2 317,461632 21650,8833 4 67,7 199,08788 13478,2495 5 67,3 -426,963742 -28734,6598 6 68,1 190,230082 12954,6686 7 69,5 166,708676 11586,253
8 0 0
Z2 -1455,10755
Table 10. Degree of membership each criteria for [R2]
Cr X σ c µ
1 72,6 10,6066017 90,6 0,23692776 2 69,3 10,6066017 91,6666667 0,10823913 3 68,2 10,6066017 92 0,08066011 4 67,7 10,6066017 92,2 0,06940629 5 67,3 10,6066017 90,3333333 0,09461579 6 68,1 10,6066017 92,1666667 0,07621157 7 69,5 10,6066017 90,6666667 0,13652677
The z value and alpha-predicate value for [R2] are -1455.10755 and 1.4134E-07.
Table 11. Z3 value for Staff
Cr x k k*x
1 72,6 0,24777168 17,9882241 2 69,3 0,35348861 24,4967605 3 68,2 0,20150532 13,7426631 4 67,7 0,12091489 8,18593773 5 67,3 -0,00033536 -0,02256952 6 68,1 0 0 7 69,5 0 0
8 0 0
Z3 64,3910159
Table 12. Degree of membership each criteria for [R3]
Cr X σ c µ
1 72,6 10,6066017 73 0,99928914 2 69,3 10,6066017 47 0,10968115 3 68,2 10,6066017 49 0,19429066 4 67,7 10,6066017 47,6 0,16602781 5 67,3 10,6066017 46,6666667 0,15074689 6 68,1 10,6066017 43,1666667 0,06310327 7 69,5 10,6066017 44,6666667 0,06451457
α -predikat 2,1698E-06
The z value and alpha-predicate value for [R3] are 64.3910159 and 2.1698E-06.
Table 13. Z4 value for Staff
Cr x k k*x
1 72,6 0,18574589 13,4851516 2 69,3 0 0 3 68,2 0,36900176 25,16592 4 67,7 0,20131865 13,6292725 5 67,3 0 0 6 68,1 0 0 7 69,5 0,20317791 14,1208651
8 0 0
Z4 66,4012091
Table 14. Degree of membership each criteria for[R4]
Cr X σ c µ
1 72,6 10,6066017 76,4 0,93783826 2 69,3 10,6066017 56,6666667 0,49196964 3 68,2 10,6066017 65,2857143 0,9629566 4 67,7 10,6066017 56,6 0,57833615 5 67,3 10,6066017 55 0,51048195 6 68,1 10,6066017 54,3333333 0,43071182 7 69,5 10,6066017 52,6666667 0,28382918
α -predikat 0,01603532
The z value and alpha-predicate value for [R2] are 66.4012091 and 0.01603532.
Using the same method, we can compute z and alpha-predicate value for Manager’s rules (see Table. 15 – Table. 24).
Table 15. Z1 value for Manager
Cr X k k*x
1 90,5 0,66605743 60,2781977 2 73,4 -0,0497505 -3,6516895 3 71,9 0 0 4 73,8 0,27951477 20,6281904 5 73,3 0 0 6 72,7 0 0 7 72,5 0 0 8 72,6 0 0
9 0 0
Z1 77,2546985
Table 16. Degree of membership each criteria for [R1]
Cr X σ c µ
1 90,5 0,10606602 90 1,49453E-05 2 73,4 3,65927759 76,5 0,698485043 3 71,9 4,10627009 74,8571429 0,771583645 4 73,8 3,7335238 75,8 0,866337904 5 73,3 3,74766594 75 0,902231998 6 72,7 3,8890873 76 0,697676326 7 72,5 4,20728535 75 0,838164242 8 72,6 3,95336973 76,2727273 0,649513605
α -predikat 2,39124E-06
The z value and alpha-predicate value for manager’s [R1] are 77.2546985 and 2.39124E-06.
Table 17. Z2 value for Manager
Cr x k k*x
1 90,5 90,5 0 2 73,4 73,4 0,462118148 3 71,9 71,9 0 4 73,8 73,8 0 5 73,3 73,3 0 6 72,7 72,7 0 7 72,5 72,5 0,16290604 8 72,6 72,6 0,375344744
9 0
Z2 72,98018841
Table 18. Degree of membership each criteria for [R2]
Cr X σ c µ
1 90,5 0,10606602 90,4 0,64118039 2 73,4 3,65927759 90,5 1,8116E-05 3 71,9 4,10627009 90,4285714 3,7911E-05 4 73,8 3,7335238 90,6 4,0107E-05 5 73,3 3,74766594 91 1,4331E-05 6 72,7 3,8890873 90,6666667 2,3206E-05 7 72,5 4,20728535 90,6666667 8,9421E-05 8 72,6 3,95336973 90,4545455 3,7229E-05
α -predikat 1,9554E-32
The z value and alpha-predicate value for manager’s [R1] are 72.98018841 and 1.9554E-32.
Table 19. Z3 value for Manager
Cr x K k*x
1 90,5 0 0 2 73,4 0 0 3 71,9 0 0 4 73,8 0,20328596 15,00250417 5 73,3 0 0 6 72,7 0 0 7 72,5 0,79504179 57,64053012 8 72,6 0 0
9 0 0
Z3 72,6430343
Table 20. Degree of membership each criteria for [R3]
Cr X σ c µ
1 90,5 0,10606602 91 1,4945E-05 2 73,4 3,65927759 90,6666667 1,4628E-05 3 71,9 4,10627009 90,4285714 3,7911E-05 4 73,8 3,7335238 91 2,4624E-05 5 73,3 3,74766594 91 1,4331E-05 6 72,7 3,8890873 91 1,5561E-05 7 72,5 4,20728535 91 6,3314E-05 8 72,6 3,95336973 90,9090909 2,2004E-05
α -predikat 6,3405E-38
For [R3] z3 value is 72.6430343 and alpha-predicate is 6.3405E-38.
Table 21. Z4 value forManager
Cr x K k*x
1 90,5 0,58525386 52,96547418 2 73,4 0 0 3 71,9 0 0 4 73,8 0,31827622 23,48878504 5 73,3 0 0 6 72,7 0 0 7 72,5 0 0 8 72,6 0 0
9 0 0
Z4 76,45425922
Table 22. Degree of membership each criteria for [R4]
Cr X σ c µ
1 90,5 0,10606602 90,4 0,64118039 2 73,4 3,65927759 76 0,77691736 3 71,9 4,10627009 75,1428571 0,73209929 4 73,8 3,7335238 77,2 0,66056619 5 73,3 3,74766594 74,3333333 0,96270068 6 72,7 3,8890873 75,5 0,77168908 7 72,5 4,20728535 75 0,83816424 8 72,6 3,95336973 76,6363636 0,5937995
α -predikat 0,08907257
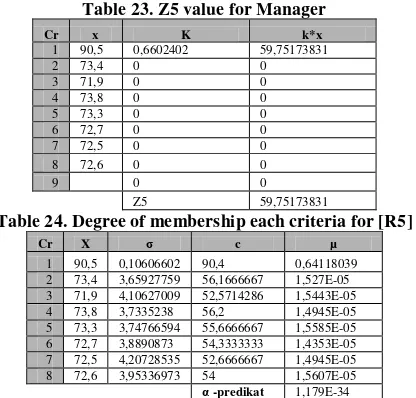
Table 23. Z5 value for Manager
Cr x K k*x
1 90,5 0,6602402 59,75173831
2 73,4 0 0
3 71,9 0 0
4 73,8 0 0
5 73,3 0 0
6 72,7 0 0
7 72,5 0 0
8 72,6 0 0
9 0 0
Z5 59,75173831
Table 24. Degree of membership each criteria for [R5]
Cr X σ c µ
1 90,5 0,10606602 90,4 0,64118039 2 73,4 3,65927759 56,1666667 1,527E-05 3 71,9 4,10627009 52,5714286 1,5443E-05 4 73,8 3,7335238 56,2 1,4945E-05 5 73,3 3,74766594 55,6666667 1,5585E-05 6 72,7 3,8890873 54,3333333 1,4353E-05 7 72,5 4,20728535 52,6666667 1,4945E-05 8 72,6 3,95336973 54 1,5607E-05
α -predikat 1,179E-34
The z value for [R5] is 59.75173831with alpha-predicate 1.179E-34.
After we got all of z value and alpha-predicate value for each rule for staff and manager, we can use equation (10) to find final grade (Z) for each staff and manager. We take one example from staff grading: 8055732 , 50 01603532 , 0 06 1698 , 2 07 4134 , 1127220 , 0 4012091 , 66 * 01603532 , 0 3910159 , 64 * 06 1698 , 2 ) 1075 , 1455 ( * 07 4134 , 1 58863647 , 48 * 11272201 , 0 Z E E E E Z
The next after we got final Z value is to describe this value in the same manner as List Of Assessment Work ranging, so, that staff is in the range “Medium”. Using the same method, we grade other staff and compare all the result with List Of Assessment Work.
This one is an example for manager grading using defuzzification.
Based on the Z value and applied to List Of Assessment Work ranging, the manager is in the range of “Good”. We use the same method for other manager and compare it with existing List Of Assessment Work grading system.
Table 23. Comparison between Fuzzy Inference Systems with List Of Assessment Work
No C1 C2 C3 C4 C5 C6 C7 C8
List Of Assessment Work Grade Fuzzy Grade Fuzzy Description List Of Assessment Work Description
1 76,4 53,67 60,42 54,2 53 54,16 56,33 0 58,6 58,6 medium medium 2 76,4 56,67 65,28 56,6 55 54,33 52,67 0 60 60.31 medium medium 3 90 73 73 73,2 72,67 72,5 72 0 75,25 75,27 medium medium 4 90,4 56,16 52,57 56,2 55,67 54,33 52,67 0 59,68 58,41 medium medium 5 91 90,67 90,42 91 91 91 91 90,9 90,84 90,84 verry good verry good 6 90,4 90,5 90,42 90,6 91 90,67 90,67 90,45 90,54 90,57 verry good verry good 7 90,4 90 90,14 91,4 90,67 90,67 92,33 90,63 90,65 90,68 verry good verry good 8 90,8 89,83 91,28 89,4 90 90,83 91 90,63 90,52 90,52 verry good verry good
Based on the above table, we can see how fuzzy inference system we built compared to List Of Assessment Work. Grading using proposed fuzzy inference system has almost the same result as List Of Assessment Work where the description from fuzzy inference system compared to List Of Assessment Work is 100% the same. This shows us that Fuzzy Inference System using sugeno method can be applied for staff performance grading.
5.
CONCLUSION
Based on the discussed result above we can conclude that fuzzy inference system using sugeno method order one can be applied into employee performance assessment system of
Departement of Population in Tomohon City. Performance grading would be objective because for each criterion there are more sub-criteria that should be graded until we got averaged graded for the criteria. Rule modeling is separated into two parts, i.e. for staff and manager. For staff, there are four rules where for manager, there are five rules.
There should be further research using the same model and method to achieve higher result using more data sample. In
the future research, ones should build more complex system using mode variable category.
6.
REFERENCES
[1] Ramdhani Indra, Imam Syaifuddin Rifkan, Noviana Endarsari, Sheila Nurul Huda. 2012. “Fuzzy Inference System dengan Metode Sugeno untuk Penentuan Banyaknya Asisten Laboratorium yang Diterima pada Saat Rekrutmen”. Seminar Nasional Aplikasi Teknologi Informasi (SNATI). Yogyakarta. ISSN: 1907-5022.
[2] Suwandi, Mohammad Isa Irawan, Imam Mukhlash. 2011. “Aplikasi Sistem Inferensi Fuzzy Metode Sugeno dalam Memperkirakan Produksi Air Mineral dalam Kemasan”. Prosiding Seminar Nasional Penelitian, Pendidikan dan Penerapan MIPA, Fakultas MIPA. Universitas Negeri Yogyakarta.
Semen”. Jurnal Tesis. Institut Teknologi Sepuluh November.
[4] Badan Kepegawaian Negara. 2010“Penilaian Kinerja PNS”.http://www.bkn.go.id/in/peraturan/pedoman/pedo man-penilaian-pns.html.
[5] Triayudi Agung, Nazori AZ. 2012. “Analisa Sistem Penilaian Kinerja Guru Menggunakan Fuzzy Inference System Mamdani: Studi Kasus UPT Dinas Pendidikan Kec. Penengahan Lampung Selatan”. Jurnal TICOM. Vol. 1 No. 1. ISSN: 2302-3252.
[6] Rusmiari, Darma-Putra, Arya-Sasmita. 2013. Fuzzy Logic Method for Evaluation of Difficulty Level of Exam and Student Graduation. IJCSI International Journal of Computer Science Issues. Vol. 10. Issue 2. No. 2. ISSN:1694-0784.
[7] Kusumadewi Sri, Idham Guswaludin. 2005. Fuzzy Multi-Criteria Decision Making. Media Informatika. Vol. 1. Juni 2005. 25-38. ISSN: 0854-4743.
[8] Abdullah Lazim, Mohd Nordin Abd Rahman. 2012. Employee Likelihood of Purchasing Health Insurance using Fuzzy Inference System. IJCSI International Journal of Computer Science Issues. Vol. 9. Issue 1. No. 2. ISSN:1694-0814.
[9] Kusumadewi Sri, Hari Purnomo. 2010. “Aplikasi Logika Fuzzy untuk Pendukung Keputusan Edisi ke-2”. Graha Ilmu. Yogyakarta.