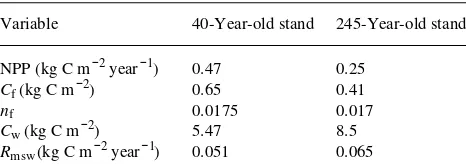
Summary Several explanations have been advanced to ac-count for the decline in forest net primary productivity (NPP) with age in closed-canopy stands including the hypotheses that: (1) sapwood maintenance respiration rate increases, reducing the availability of carbon to support new growth; (2) stomatal conductance and hence photosynthetic efficiency decline; and (3) soil nutrient availability declines. To evaluate these hy-potheses we applied the ecosystem model G’DAY to a 40- and a 245-year-old stand of lodgepole pine (Pinus contorta Dougl. ex Loud.), growing on infertile soils. Net primary productivity estimated from biomass data was 0.47 and 0.25 kg C m−2 year−1 and foliar nitrogen/carbon ratio (N/C) was 0.0175 and 0.017 for the 40- and 245-year-old stands, respectively.
Productivities of the young and old stands were derived from a graphical analysis of the G’DAY model. The graphical analysis also indicated that the observed age-related decline in NPP can be explained in terms of interacting processes associ-ated with Hypotheses 2 and 3. However, the relative impor-tance of these two hypotheses differed depending on key model assumptions, in particular those relating to variation in soil N/C ratio. Thus, if we assumed that soil N/C ratio can vary significantly during stand development, then Hypotheses 2 and 3 jointly explain the decline in NPP, whereas if we assumed that soil N/C ratios are constant, then Hypothesis 3 alone explains the decline in NPP. The analysis revealed that only a small fraction of the decline of NPP can be explained in terms of increasing sapwood respiration.
Keywords: forest decline, net primary productivity, nitrogen availability, photosynthetic efficiency, Pinus contorta, respira-tion, stand age, woody litter.
Introduction
For closed-canopy forests, both net primary productivity (NPP) and wood yield decline as stands age (Turner and Long 1975, Attiwill 1979, Waring and Schlesinger 1985, Attiwill and Leeper 1987, Borman and Siddle 1990, Kozlowski et al. 1991, Ryan 1991, Long and Smith 1992, Ryan and Waring 1992). Although the age-related decline in forest NPP appears to be a universal phenomenon, its physiological mechanisms
are not well understood. The decline has been attributed to increasing amounts of respiring sapwood tissue (Peet 1980, Waring and Schlesinger 1985, Kozlowski et al. 1991, Yoder et al. 1994). However, Ryan (1991) and Ryan and Waring (1992) found that sapwood maintenance respiration was only 5% higher in a 245-year old lodgepole pine stand than in a 40-year old stand, and they concluded that this small increase in respi-ratory load could not account for a 40% decline in measured NPP. Ryan and Waring (1992) identified two other factors contributing to the lower NPP in the 245-year-old stand com-pared with the 40-year-old stand: (1) photosynthesis and sto-matal conductance of 1-year-old needles were 16 to 22% lower in the older stand; and (2) foliar biomass was 37% lower in the older stand. An age-related decline in gas exchange rates has also been reported by Yoder et al. (1994) who proposed that the decline was associated with changes in canopy hydraulic resis-tance which affects canopy water potential and stomatal con-ductance. An age-related decline in foliar biomass is well documented (Gholz and Fisher 1982, Madgwick 1985, Waring and Schlesinger 1985, Ryan and Waring 1992, Binkley et al. 1995, Gower et al. 1995, Vose et al. 1995) and is associated with a reduction in NPP as a result of a decrease in the amount of photosynthetically active radiation (PAR) absorbed by the forest canopy.
Several other studies have questioned whether increasing sapwood respiration alone can explain the decline in NPP as stands age. Borman and Siddle (1990) concluded from studies of a Picea sitchensis chronosequence that the decline in NPP could not be explained by increased respiratory losses and attributed the decline to reduced nutrient availability (cf. Gholz et al. 1985, Binkley et al. 1995). Other investigators have concluded that large declines in NPP observed in aging forest stands are associated with reduced N availability (Grier et al. 1981, Gower et al. 1995, Schulze et al. 1995). Declining N availability may also affect allocation of NPP because below-ground allocation of NPP increases with declining N availabil-ity (Keyes and Grier 1981, Cannell 1985, Santantonio 1989, Lambers and Poorter 1992, Ågren and Wikstrom 1993, Kirschbaum et al. 1994) and stand age (Grier et al. 1981, Meier et al. 1985, Ryan and Waring 1992). Increased belowground
Declining forest productivity in aging forest stands: a modeling
analysis of alternative hypotheses
DANUSE MURTY,
1ROSS E. M
CMURTRIE
1and MICHAEL G. RYAN
21 School of Biological Science, University of New South Wales, Sydney, NSW 2052, Australia
2 USDA Forest Service, Rocky Mountain Forest and Range Experiment Station, 240 West Prospect Road, Fort Collins, CO 80526-2098, USA
Received March 2, 1995
allocation has been associated with both reduced stem produc-tion and reduced NPP (Cannell 1985, Santantonio 1989).
Accumulation of woody litter may contribute to a decline in soil N availability. Because woody litter has a very low nitro-gen/carbon (N/C) ratio, as it accumulates and decomposes, large amounts of N can be immobilized from throughfall, N-fixation and soil reserves (Turner 1977, Grier 1978, Foster and Lang 1982, Fahey 1983, Chapin et al. 1986, Stevenson 1986, Rayner and Boddy 1988). Zimmerman et al. (1995) concluded that woody debris immobilizes large amounts of N, resulting in decreased N availability and NPP (cf. Pastor et al. 1987, Polglase et al. 1992). The rate of N immobilization by woody litter depends on its rate of breakdown by microbial decomposers, which in turn varies with climate (Hunt 1977, Parton et al. 1987, Jenkinson 1990, O’Connell 1990, Bonan and Van Cleve 1992) and with litter quality and particle size (Adams and Attiwill 1986, Chapin et al. 1986, Rayner and Boddy 1988, Johnson 1993). There is considerable evidence that woody litter decay rates decline as stands age (Turner and Long 1975, Pearson et al. 1987, Polglase and Attiwill 1992).
Because both physiological and soil nutrition processes have been invoked to explain the decline in productivity with age, we have attempted to integrate and analyze these proc-esses by applying the ecosystem model G’DAY (Generic De-composition And Yield (Comins and McMurtrie 1993)) to the two lodgepole stands studied by Ryan (1991) and Ryan and Waring (1992). The model G’DAY simulates growth and de-composition processes in forest ecosystems (McMurtrie et al. 1992, Comins and McMurtrie 1993, Comins 1994, Kirschbaum et al. 1994, McMurtrie and Comins 1995). How-ever, because the G’DAY model does not incorporate aging effects on maintenance respiration, photosynthetic efficiency and N availability, we modified the model to simulate age-de-pendent effects.
The objective of the study was to assess whether G’DAY can be used to test three hypotheses put forward to explain the decline in productivity over time. The hypotheses tested were that: (1) sapwood maintenance respiration rate increases, re-ducing C availability to support plant growth; (2) stomatal conductance declines, leading to reduced canopy photosyn-thetic efficiency; and (3) nitrogen immobilization in decom-posing woody litter increases, reducing N availability to support tree growth. We parameterized the model with data obtained from the two stands studied by Ryan (1991) and Ryan and Waring (1992), and then used the parameterized model to predict the NPP of the same stands. Predictions were based on several assumptions about how the stands differ in amount of respiring sapwood, their photosynthetic efficiency, and rates of N immobilization in decaying woody litter.
Model description
The G’DAY model of Comins and McMurtrie (1993)
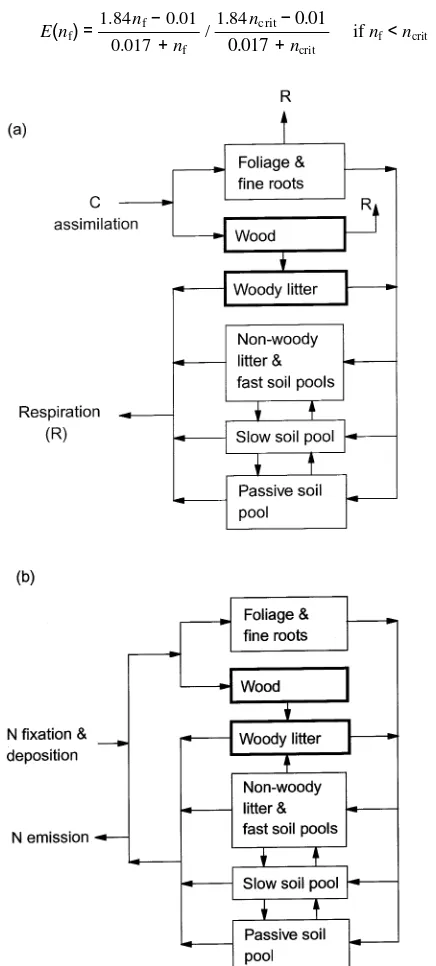
The G’DAY model (Comins and McMurtrie 1993), hereafter referred to as CM, consists of a set of 10 differential equations describing C and N dynamics of various tree and soil pools. The model’s structure is illustrated schematically in Figure 1.
We assume that annual net primary production NPP (kg C m−2 year−1) is proportional to absorbed photosynthetically active radiation, APAR (Monteith 1977):
NPP =εE(nf)APAR, (1)
where ε is maximum net PAR utilization efficiency, and E(nf) represents its dependence on the foliar N/C ratio (nf) (Kirschbaum et al. 1994):
E(nf)=
1.84nf− 0.01 0.017 + nf
/ 1.84ncrit−0.01 0.017+ncrit
if nf<ncrit (2a)
E(nf)=1 if nf≥ncrit, (2b)
where ncrit represents the nf ratio below which production is limited by N. The APAR is calculated from Beer’s law (Jarvis and Leverenz 1983):
APAR=Io(1 − exp(−kσCf)), (3)
where Iois incident PAR, k is the light extinction coefficient, σ is leaf area per unit carbon and Cf is foliar carbon mass.
Carbon acquired through photosynthesis is distributed to foliage, fine roots and woody tissue in fixed proportions, af/ar/aw, respectively. Senescence rates of the biomass compo-nents are fixed. Plant litter is subdivided into four pools: aboveground and belowground structural and metabolic frac-tions. Carbon from decomposing litter enters three soil pools: active, slow and passive, with decay time constants of order 1--5, 20--50 and 200--2000 years, respectively (Parton et al. 1987). Decomposition rates are functions of soil water and air temperature. The G’DAY model simulates fluxes of N corre-sponding to each C flux, and N fluxes associated with atmos-pheric deposition, biological fixation, soil mineralization, nutrient uptake, soil gaseous emission and leaching.
Fast and slow pools in the G’DAY model
Foliage, fine roots, the four litter pools and active soil organic matter (SOM) have turnover times of 1 to 5 years. The other pools (slow and passive SOM and woody biomass) have turn-over times of much more than 5 years. In the G’DAY simula-tions, pools with short turnover times stabilize rapidly, leading to an effective equilibrium where foliage, fine roots, litter and active SOM are equilibrated, whereas slow and passive SOM and wood are not (Comins 1994, McMurtrie and Comins 1995). The equilibrated pools are designated fast variables and the nonequilibrated pools are designated slow variables. (The fast-variable equilibrium differs from the longer-term equilib-rium considered by CM who treated the slow SOM as a fast variable.)
To predict forest growth response 50 to 100 years after an instantaneous doubling of atmospheric CO2, CM developed an equilibrium-based version of G’DAY based on an analytical method called two-timing. Two-timing consists in: (i) dividing variables into fast and slow relative to a chosen timescale; (ii) calculating the equilibrium of the fast variables with slow variables kept constant; and (iii) substituting this equilibrium into the original difference equations for the slow variables. This leads to a simplified model for the slow variables alone. In this paper, we consider only stages (i) and (ii) of the two-timing method. Once fast pools have reached equilibrium, fluxes of C and N into these pools match fluxes out. The productivity of young and old forest stands can be evaluated from considerations of C and N conservation at this effective equilibrium.
Photosynthetic and nitrogen cycling constraints to production
The equilibrium foliar C mass (Cf) can be evaluated by equat-ing leaf production and leaf fall:
Cf=afNPP/sf, (4)
where parameters af and sf represent the proportion of NPP allocated to foliage and the specific leaf senescence rate, re-spectively. (See Appendix 1 for definitions of all symbols.) By substituting Equation 4 into Equations 1 and 3, Cf can be eliminated to obtain:
NPP
1 − exp
−
kσafNPP sf
=IoεE(nf). (5)
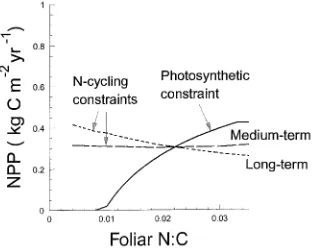
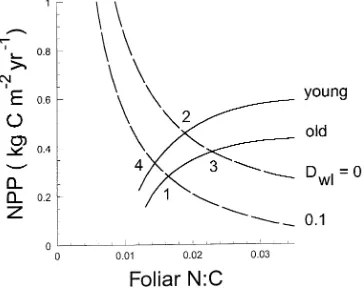
Equation 5 can be solved to express NPP as a function of nf; this relationship is called the photosynthetic constraint to pro-duction. It is illustrated in Figure 2 for the parameter values specified in Appendix 1. The photosynthetic constraint has a positive slope reflecting the strong N dependence of PAR utilization efficiency, assumed in Equation 2.
The photosynthetic constraint (Equation 5) is derived from considerations of C conservation at the effective equilibrium; a second constraint to production is obtained by invoking N conservation. At the effective equilibrium, N fluxes into and out of the aggregated fast pools are equal:
NA+ NF+NRs+NRp+NRwl=NSs+NSp+NSw+NE, (6) where NA and NF are rates of N input from atmospheric depo-sition and N fixation, respectively. The variables NRs, NRp and NRwl are net rates of N release through decomposition of slow and passive SOM and woody litter, respectively; NE is the gaseous N emission rate from soil; and NSs, NSp andNSw are rates of N sequestration in the slow and passive soil pools and
in woody biomass, respectively. An expression for the rate of N sequestration in new wood (NSw) is obtained by multiplying woody C production (awNPP) by the N/C ratio of new wood, nw, and deducting the fraction (rw) of N attained by new wood through retranslocation from old wood:
NSw=awNPPnw(1 −rw). (7a)
Analogous expressions for N fluxes into slow and passive SOM are derived by multiplying C sequestration rates, ex-pressed as proportions of litterfall C subsequently entering soil storage, by N/C ratios of newly formed slow and passive SOM, nso and npo, respectively. Under the further assumption of equilibrated foliar and root carbon (cf. Equation 4), CM ob-tained:
NSs=(afbsf+arbsr)NPPnso (7b)
and
NSp=(afbpf+arbpr)NPPnpo, (7c)
where bif and bir represent the fractions of leaf and root litterfall C which subsequently enter the slow (i = s) and passive (i = p) soil pools, respectively. The sequestration coefficients bif and bir are functions of litter lignin/N ratios (Parton et al. 1987).
Rates of N release from decomposing slow and passive SOM (NRs andNRp , respectively) depend on pool N contents and temperature- and moisture-dependent specific decomposi-tion rates, but not directly on NPP. An equadecomposi-tion for NE is obtained by assuming soil gaseous N emissions are propor-tional to the rate of N mineralization (Nmin ) with proportional-ity constant x:
NE=xNmin. (8)
At the fast-variable equilibrium, N uptake by plants (U), given by
U= Nmin(1−x), (9a)
is balanced by N export through leaf and root litterfall and wood growth:
U=(awnw(1 −rw)+ afnfl+arnrl)NPP, (9b)
where nfl andnrl are N/C ratios of senescing leaves and roots. We assume that N/C ratios of foliage and roots are proportional to those of live tissues (nfl = λfnf and nrl = λrnr), where λf and λr are the ratios of litter N/C to live tissue N/C for leaf and root, respectively. Combining Equations 8 and 9 to eliminate Nmin and U gives an expression for NE:
NE= x
1 −x(awnw(1 −rw)+afnfl+arnrl)NPP. (10)
Finally, when the above expressions for NSw, NSs, NSp and NE are substituted into Equation 6, we obtain an equation relating NPP to nf, which is called the N-cycling constraint to produc-tion:
NPP =(NA+NF+ NRs+NRp+ NRwl)/(awnw[1 −rw]
+af[bsfnso+ bpfnpo] +ar[bsrnso+ bprnpo]
+ x
1− x [awnw[1 −rw] + afnfl+arnrl]). (11)
Equation 11 applies when all fast pools are in equilibrium. Simulations of G’DAY for P. radiata D. Don predict that this canopy closure condition is achieved by age approximately 20 years (McMurtrie and Comins 1995). We therefore call Equa-tion 11 the medium-termN-cycling constraint to production. Once stands have achieved this closed state, the fast pools remain in effective equilibrium, whereas the other pools (slow and passive SOM and woody biomass) gradually change as trees age. As shown by McMurtrie and Comins (1995), slow SOM gradually approaches equilibrium (passive SOM and woody biomass remain unequilibrated). When its equilibrium condition, NRs = NSs,is substituted into Equations 6, the N-cy-cling constraint is:
NA+NF+NRp+NRwl=NSp+NSw+NE (12)
or
NPP =(NA+NF+NRp+NRwl)/(awnw[1 −rw]
+afbpfnpo+arbprnpo+ x
1 − x [awnw[1 −rw]+ afnfl+arnrl]). (13)
This is called the long-term N-cycling constraint to produc-tion. The relationships in Equations 11 and 13 are illustrated in Figure 2 as functions of nf. The downward slope of the long-term N-cycling constraint with increasing nf is due to the increased proportional loss of mineralized nitrogen through gaseous losses (NE, given by Equation 10); as a result of these increased N losses, less N is available to support tree growth. The slight positive slope of the medium-term N-cycling con-straint is due to the effect of increasing nf on litter quality; if nf increases, litter quality (defined by its lignin/N ratio, Aber et al. 1990) increases, leading to reduced C sequestration coeffi-cients (bsf, bsr, bpf, and bprin Equation 11) and hence to in-creased availability of N to support plant growth. The gaseous emission effect, which gives the long-term N-cycling con-straint its negative slope, is present in both Equations 11 and 13; however, in Equation 11 it is masked by the stronger litter quality effect on rates of soil C storage, particularly into slow SOM.
photosynthetic constraint curve with the medium-term N-cy-cling constraint gives production and nf achieved when all fast pools are equilibrated (i.e., at the medium-term equilibrium). The intersection with the long-term N-cycling constraint gives the long-term equilibrium when the slow soil pool is also equilibrated. Both constraint curves are shown in Figure 2. Because the medium-term N-cycling constraint shown in Fig-ure 2 is actually evaluated with the slow soil pool at equilib-rium, the medium- and long-term equilibria coincide. The advantage of the graphical analysis (Figure 2) over an analysis based on model simulations is the insight the graphical ap-proach provides into how individual parameters affect NPP, and the qualitative understanding it offers into the model’s dynamic behavior.
Plant respiration
Because CM’s model does not explicitly represent plant respi-ration (Hypothesis 1) or effects of age on stomatal conductance and photosynthetic efficiency (Hypothesis 2), and woody litter decay is ignored (i.e., NRwl = 0 in Equations 11 and 13; Hy-pothesis 3), we have modified G’DAY to incorporate these aging mechanisms.
The C sinks associated with maintenance and construction respiration were incorporated in Equation 1:
NPP =GPP −(Rc+Rm) (14a)
where GPP is gross primary production, and Rc and Rm are construction and maintenance respiration rates, respectively. Gross primary production is defined here as net daytime carb-on gain and is proporticarb-onal to APAR:
GPP =εoE(nf)APAR, (14b)
where εo is maximum gross PAR utilization efficiency. We assumed that total construction respiration represents 25% of NPP (Ryan 1991):
Rc= 0.25NPP. (15a)
Following Ryan (1991) and Ryan and Waring (1992), we model maintenance respiration as the sum of:
Rm=Rmf+Rmr+Rmsw, (15b)
where Rm is total annual maintenance respiration, and Rmf, Rmr and Rmsw are annual maintenance respiration rates of foliage (dark period only), fine roots and sapwood, respectively. Both foliage and fine root respiration rates are functions of mean annual air temperature (Ta) and their nitrogen contents (Nf and Nr,respectively):
Rmf= 0.5R0NfQ10Ta/10 (15c)
Rmr=R0NrQ10Ta/10, (15d)
where the value of R0, the respiration rate per unit nitrogen content corresponding to a temperature of 0 °C, is derived from Ryan (1991) and Q10 is 2.0. The factor of 0.5 is included because GPP, given by Equation 14b, is net of daytime foliar respiration, so that Rmf represents night respiration only.
Sapwood respiration is assumed to depend on mean air temperature and sapwood volume. Assuming constant mean sapwood density (Ryan 1991), we convert Ryan and Waring’s (1992) equation for sapwood respiration to a function of tem-perature and sapwood C content (Csw):
Rmsw= 0.00876CswQ10′Ta/10, (15e) where Q10′ = 1.94. An empirical equation for sapwood C is derived from measurements of woody biomass for three lodge-pole pine stands aged 40, 65 and 245 years and assuming that branches and coarse roots are composed entirely of sapwood (Ryan 1991):
Csw=1.11Cw0.77. (16)
Thus, given values of Nf, Nr and Cw, maintenance respiration can be calculated from Equations 15 and 16.
Substituting Equations 3, 14b and 15a into Equation 14a, we obtain a modified photosynthetic constraint:
Rm is given by Equations 15b to 16 evaluated at the fast-vari-able equilibrium where
with sapwood maintenance respiration calculated using ob-served values of Cw in the young and old stands.
Equation 17 can be solved to express NPP as a function of nf. This relationship replaces Equation 5 as the photosynthetic constraint to production. It is illustrated in Figure 3a for pa-rameter values given in Appendix 1.
Age-dependent stomatal conductance and photosynthetic efficiency
Stomatal conductance, hydraulic conductance and canopy ar-chitecture are not explicitly represented in CM’s model. We assume that gross PAR utilization efficiency (εo) declines with age; the implicit assumption here is that photosynthesis corre-lates with stomatal conductance.
Woody litter decay
NRwl=dwlCwl(nwl−bswnso− bpwnpo), (18a)
where Cwl is woody litter carbon, nwl is N/C ratio of woody litter, dwl is its specific decay rate,and bsw and bpw are fractions of decomposing woody litter carbon which subsequently enter the slow and passive soil pools. Equation 18a applies at the medium-term equilibrium. In the long-term, once the slow soil pool is equilibrated, the net rate of N release in woody litter decay is
NRwl′= dwlCwl(nwl− bpw′npo) (18b)
where bpw′ is the fraction of woody litter decay entering passive SOM in the long-term:
bpw′=bpw+ bswbps
1−bss
. (18c)
Because nwl is much less than that of SOM, woody litter decay usually leads to immobilization of N from soil reserves (i.e., NRwl < 0); in that case, inclusion of the woody litter decay term (NRwl ) in Equation 11 will lower the N-cycling constraint curve. However, N immobilization in decomposing woody litter does not continue indefinitely. In the long term, woody litter decay can become an N source (i.e., NRwl′, given by Equation 18b, can be positive even though NRwl given by Equation 18a is negative); this sign difference between NRwl
and NRwl′ is possible because the value of bps /(1 − bss) is considerably less than one.
Parameterization of the model for stands of lodgepole pine
To test the hypotheses put forward to explain the decline in productivity during stand development, we parameterized the model for two adjacent even-aged stands of lodgepole pine (P. contorta) growing in Frazer Experimental Forest near Win-ter Park, Colorado, USA. The forest lies in the subalpine region (39°54′ Ν, 105°52′ W, 2800 m asl) with a 3-month growing season, mean annual air temperature of 3.8 °C, mean growing season temperature of 14.5 °C, and mean growing season incident PAR of 1.164 GJ m−2 (averaged over 10 years). Stands were aged 40 and 245 years at the time of measurement. Methods used to estimate tree biomass components, above-ground NPP, belowabove-ground C allocation and respiration rates are described by Ryan (1991) and Ryan and Waring (1992).
Estimated stand properties and parameter values for the older stand are listed in Table 1 and Appendix 1, respectively. Woody biomass (Cw) of the younger stand was 35% less than that of the older stand (5.47 versus 8.5 kg C m−2, Ryan and Waring 1992) and gross PAR utilization efficiency (εo) was assumed to be 16% lower for the older stand (Yoder et al. 1994).
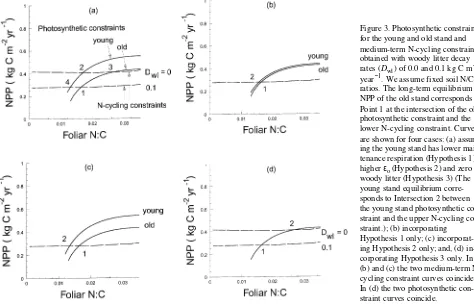
Our objective in parameterizing the model was to derive the photosynthetic and N-cycling constraint curves for the two Figure 3. Photosynthetic constraints for the young and old stand and medium-term N-cycling constraints obtained with woody litter decay rates (Dwl ) of 0.0 and 0.1 kg C m−2 year−1. We assume fixed soil N/C ratios. The long-term equilibrium NPP of the old stand corresponds to Point 1 at the intersection of the old photosynthetic constraint and the lower N-cycling constraint. Curves are shown for four cases: (a) assum-ing the young stand has lower main-tenance respiration (Hypothesis 1), higher εo (Hypothesis 2) and zero woody litter (Hypothesis 3) (The young stand equilibrium corre-sponds to Intersection 2 between the young stand photosynthetic straint and the upper N-cycling con-straint.); (b) incorporating
lodgepole pine stands. Values of several parameters listed in Appendix 1 were estimated indirectly, as enumerated below.
1. Potential gross PAR utilization efficiency (εo), defined in Equation 14b, was inferred from estimated GPP and APAR, and nf.
2. Foliar senescence rate (sf) was estimated from the fraction of the total foliar C present in 1-year-old foliage (Schoettle 1989).
3. Fahey (1983) obtained a specific woody litter decay rate (dwl ) for lodgepole pine of 0.016 year−1, which is comparable to the rates found in other cold temperate forests (Harmon et al. 1986). However, because dwl was not measured in either lodgepole pine stand under study, and there is evidence that total woody litter (Cwl ) was lower in the young stand than in the old stand, we used four different values of Dwl, represented by the product of dwlCwl (Equations 18a and 18b); namely, 0.0 in the young stand and 0.05, 0.1 and 0.07 kg C m−2 year−1 in the old stand. The value 0.07 kg C m−2 year−1 represents the value of Dwl for the long-term equilibrium of woody litter biomass (when Dwl = dwlCwl = swCw = awNPP).
4. The N/C ratio of new wood (nw) was derived based on relative values of sapwood and heartwood N/C given by Pear-son et al. (1987).
5. Fractions of leaf and root litter entering slow and passive SOM (bif, and bir, where i = s or p) and other soil C partition coefficients were derived from an analysis of the CENTURY model of Parton et al. (1987).
6. The gaseous N emission fraction (x = 0.01) was taken from Kirschbaum et al. (1994).
7. Estimates of slow and passive SOM are required to evalu-ate net release of N from the slow and passive pools (NRs and NRp , respectively). Measurements of total SOM are available (10.6 kg C m−2), but not of its breakdown into active, slow and passive components. We assumed constant passive SOM for both stands (Cp = 4 kg C m−2, N. Scott, personal communica-tion). For the old stand, we estimated slow SOM by assuming that its soil C and N contents are in equilibrium.
8. For the young stand, there is considerable uncertainty about slow SOM and woody litter decay rate. We made two assumptions: (1) the young stand has the same amount of slow SOM as the old stand; and (2) all woody litter has been removed from the young stand (Cwl = 0 and consequently Dwl = 0 and NRwl = 0). We thus assume that soil C and N reserves of the younger stand are identical to the older stand (the young stand had been reestablished on an old forest site which had equilibrated soil pools); this assumption is reasonable because
the two stands had similar histories and there were no large losses of slow SOM during reestablishment of the young stand.
Results
We used the equilibrium-based analysis of G’DAY to make predictions under a variety of assumptions about how the two stands differ in amount of respiring sapwood (Hypothesis 1), gross PAR utilization efficiency (εo) (Hypothesis 2), and rates of N immobilization in decaying woody litter (Hypothesis 3).
Hypotheses 1, 2 and 3 combined
Figure 3a illustrates the photosynthetic and N-cycling con-straints derived for the stands assuming that, compared with the old stand, the young stand has lower maintenance respira-tion (Hypothesis 1), higher gross PAR utilizarespira-tion efficiency (Hypothesis 2), and lower woody litter decay rate (Dwl = 0.1 and 0 kg C m−2 year−1 in the old and young stands, respec-tively; Hypothesis 3). The photosynthetic constraint curve (Equation 17) was higher for the young stand than the old stand because of its greater photosynthetic efficiency and reduced respiratory costs. For the old stand, the appropriate medium-term N-cycling constraint curve was given by Equation 11 with equilibrated slow soil pool (Point 7 above), whereas the me-dium-term N-cycling constraint for the young stand was given by Equation 11 with NRwl = 0 and Cs and Ns equal to their values for the old stand (Point 8 above).
The N-cycling constraint of the young stand was higher than that of the older stand because the young stand had less woody litter, and hence reduced N immobilization. Woody tissue has a low N/C ratio and decaying woody litter immobilizes large amounts of N (Equation 18a), which reduces soil N availability to support tree growth. Predicted NPPs of the old and young stands, which are given by Intersections 1 and 2, respectively, in Figure 3a, were 0.28 and 0.41 kg C m−2 year−1; i.e., modeled NPP was 45% higher for the young stand. The model predicts nf ratios of 0.0164 and 0.017 for the old and young stands, respectively. The comparable measured NPPs were 0.25 and 0.47 kg C m−2 year−1 and the measured n
f ratios were 0.017 and 0.0175for the old and young stands, respectively.
Hypotheses 1, 2 and 3 considered separately
Figure 3a incorporates all three hypotheses for the decline of NPP as stands age. Figures 3b--d consider three other cases, each incorporating only one of the hypotheses. For Case 1, which incorporates Hypothesis 1 only (Figure 3b), we assume that sapwood maintenance respiration rate is lower in the younger stand but assume no change in photosynthetic effi-ciency (εo) and no reduction of woody litter with stand age (i.e., Dwl = 0.1 kg C m−2 year−1 in both stands). Modeled NPPs of the old and young stands, which are given by Intersections 1 and 2, respectively, were not significantly different (see Ta-ble 2) because reduced maintenance respiration had little im-pact on the photosynthetic constraint curve and no effect on the N-cycling constraint (Figure 3b).
For Case 2, we assume that the younger stand has higher gross PAR utilization efficiency (εo) but that the stands have Table 1. Values of some variables estimated from field data for the
40-and 245-year-old st40-ands of P. contorta.
equal amounts of sapwood C and the same woody litter C (Hypothesis 2 only, Figure 3c). Under these assumptions, there was a negligible difference in modeled NPPs of the young and old stands (cf. Intersections 1 and 2, Table 2) because, even though the photosynthetic constraint curves differed consider-ably, the N-cycling constraints were almost horizontal.
For Case 3, we assume that the only difference between the stands is that the young stand has no woody litter (Hypothe-sis 3 only, Figure 3d). This assumption affects the N-cycling constraint curve, but not the photosynthetic constraint. Mod-eled NPP of the younger stand was 0.41 kg C m−2 year−1 (Intersection 2). Thus Case 3 accounts for the entire NPP difference seen in Figure 3a. However, Case 3 was unable to reproduce the nf ratios. Figure 3d gave nf = 0.0164 and 0.0269 for the old and young stands, respectively, whereas the meas-ured values were 0.017 and 0.0175 (Table 1).
Hypotheses 1 and 2 considered jointly
Hypotheses 1 and 2 affect the photosynthetic constraint only, whereas Hypothesis 3 affects the N-cycling constraint only. Thus, the photosynthetic constraints for the old and young stands in Figure 3a differed because the younger stand had higher photosynthetic efficiency and reduced respiration. Similarly, the N-cycling constraints differed because of re-duced woody litter decay rate (Dwl) in the young stand. In Figure 3, Intersection 3 between the old stand photosynthetic constraint and the upper N-cycling constraint therefore
repre-sents the equilibrium obtained for Case 3 (Hypothesis 3 only). Similarly, Intersection 4 inFigure 3a represents the equilib-rium obtained when Hypotheses 1 and 2 are combined. Thus the four intersections in Figure 3a can be used to determine whether the reduced growth of the young stand was due to changes in C substrate availability (Hypotheses 1 and 2) or N availability (Hypothesis 3).
Variable soil N/C ratio
For Figure 3a, we assume that slow soil N/C is a fixed constant throughout stand development. However, there is evidence that soil N/C may vary depending on the quality of litter substrate (Aber et al. 1990, Baldock et al. 1992, Escudero et al. 1992). Figure 4 illustrates the consequences of assuming that the N/C ratio of newly formed slow SOM is proportional to nfl. (We use the relationship nso = 4.0nfl.) The shape of the medium-term N-cycling constraint is highly sensitive to assumptions about variability of soil N/C (McMurtrie and Comins 1995). Under the assumption of fixed soil N/C, the medium-term N-cycling constraint was almost horizontal (Figure 3). However, for variable soil N/C ratio, the N-cycling constraint declined steeply with increasing nf (Figure 4) because, if the N/C ratio of newly formed SOM increases, NSs increases relative to NRs thereby reducing availability of soil N to support plant growth. When all three aging hypotheses are included (Figure 4), modeled NPPs of the old and young stands were 0.28 and 0.40 kg C m−2 year−1 (Intersections 1 and 2, respectively),
repre-Table 2. G’DAY parameter values and predicted NPP and nf for young and old stands for each figure. (Predictions for the old stand for Figures 3a--d are identical.) Symbols: Rmsw = sapwood maintenance respiration (kg C m−2 year−1), derived from Equations 15e and 16, εo = maximum gross PAR utilization efficiency (kg C GJ−1), ε = maximum net PAR utilization efficiency (kg C GJ−1, value given for Figure 2 only), Dwl = woody litter decay rate (kg C m−2 year−1), soil N/C = fixed (F; n
so = 0.035) or variable (V; nso = 4.0nfl), NPP = predicted net primary production (kg C m−2 year−1), and n
f = predicted foliar N/C ratio.
Figure Stand Rmsw εo Dwl Soil N/C ar NPP nf
(Intersection)
2 - 0 (ε = 0.46) 0 F 0.58 0.327 0.0206
3a Old (1) 0.065 1.05 0.1 F 0.58 0.280 0.0164
Young (2) 0.046 1.25 0 F 0.58 0.407 0.0170
(3) 0.065 1.05 0 F 0.58 0.411 0.0269
(4) 0.046 1.25 0.1 F 0.58 0.280 0.0129
3b Young (Case 1) 0.046 1.05 0.1 F 0.58 0.280 0.0157
3c Young (Case 2) 0.065 1.25 0.1 F 0.58 0.280 0.0134
3d Young (Case 3) 0.065 1.05 0 F 0.58 0.411 0.0269
4 Old (1) 0.065 1.05 0.1 V 0.58 0.280 0.0164
Young (2) 0.046 1.25 0 V 0.58 0.400 0.0167
(3) 0.065 1.05 0 V 0.58 0.342 0.0196
(4) 0.046 1.25 0.1 V 0.58 0.335 0.0144
5 Old 0.065 1.05 0.1 V 0.58 0.280 0.0164
Young 0.046 1.25 0 V 0.41 0.458 0.0188
6a Old 0.065 1.05 0.05 V 0.58 0.309 0.0177
Young 0.046 1.25 0 V 0.58 0.397 0.0166
6b Old 0.065 1.05 0.05 V 0.58 0.309 0.0177
Young 0.046 1.25 0 V 0.41 0.455 0.0187
- Old 0.065 1.05 0.07 V 0.58 0.303 0.0164
Young 0.046 1.25 0 V 0.58 0.405 0.0159
- Old 0.065 1.05 0.07 V 0.58 0.303 0.0164
senting 43% higher productivity in the young stand than in the old stand. Simulated nf ratios were 0.0164 and 0.0167 in the old and young stands, respectively; these values were slightly lower than the measured values of 0.017 and 0.0175. If we assume that εo and respiratory load are identical in the two stands, but that woody litter decay (Dwl) is zero in the young stand (Intersection 3, Figure 4), then modeled NPP of the young stand was 0.34 kg C m−2 year−1 (i.e., 22% higher than that of the old stand); this represents the response to Hypothe-sis 3 alone. Alternatively, if we assume that woody litter decay is unaltered in the young stand, but that both sapwood respira-tion and photosynthetic efficiency differ (Intersecrespira-tion 4, Figure 4), then the model predicts an NPP of 0.335 kg C m−2 year−1 (i.e., 20% higher than in the old stand); this represents the combined response to Hypotheses 1 and 2. (If we consider responses to the two hypotheses influencing the photosyn-thetic constraint separately, we find that the increased produc-tivity was predominantly due to higher εo, cf. Figures 3b and 3c.)
Sensitivity to allocation of NPP below ground
Figures 3 and 4 consider the consequences of declining N availability under the assumption that carbon allocation is unaltered as stands age. There is evidence, however, that re-duced N availability leads to increased belowground allocation (Keyes and Grier 1981, Cannell 1985, Santantonio 1989, Lambers and Poorter 1992, Ågren and Wikstrom 1993, Kirschbaum et al. 1994). Biomass studies indicate that root allocation is higher and wood allocation is lower in the old stand than in the young stand (af/ar/aw = 0.17/0.41/0.42 in the young stand compared with 0.19/0.58/0.23 in the old stand). The effect of altered allocation on the constraint curves is shown in Figure 5 where N-cycling constraints are shown for the young and old stands with litter decay rates, Dwl = 0 and 0.1 kg C m−2 year−1, respectively. The N-cycling constraint of the young stand was considerably higher than the correspond-ing curve in Figure 4, where we assumed af/ar/aw =
0.19/0.58/0.23. Hence, simulated NPP of the young stand (0.46 kg C m−2 year−1) was higher than that obtained assuming that allocation changes with age (0.40 kg C m−2 year−1, Figure 4). The simulated nf of the young stand (0.0188) was also higher than in Figure 4. Of the simulations discussed, the results shown in Figure 5 are most consistent with field data (cf. Tables 1 and 2).
Sensitivity to woody litter decay rate
For both stands, there is uncertainty about the assumed rate of woody litter decay (Dwl). For Figures 3--5, we assumed Dwl = 0 and 0.1 kg C m−2 year−1 for the young and old stands, respec-tively. Figure 6 illustrates the consequences of assuming Dwl = 0.05 kg C m−2 year−1. In this case, predicted NPPs of the old and young stands were 0.31 and 0.40 kg C m−2 year−1, respec-tively (assuming fixed allocation, Figure 6a) and 0.31 and 0.46 kg C m−2 year−1, respectively (assuming lower belowground allocation in the young stand, Figure 6b). The constraint curves shown in Figures 6a and 6b were similar in shape to those of Figures 4 and 5, respectively; the main difference was that, with lower Dwl, the N-cycling constraints were closer together. Consequently, the difference between modeled NPPs of the young and old stands was less than predicted with Dwl = 0.1 kg C m−2 year−1 (Table 2).
As an alternative to the above values of Dwl, we considered the consequences if woody biomass and woody litter are equilibrated in the old stand. At this old-growth equilibrium, Dwl can be derived by equating wood production, woody litter production and woody litter decay:
awNPP =swCw=dwlCwl= Dwl. (19) For the parameter values listed in Appendix 1, Equation 19 gave Dwl = 0.07 kg C m−2 year−1 for the old stand. Predicted values of NPP for the young and old stands were 0.40 and 0.30 kg C m−2 year−1, respectively, assuming fixed allocation coef-ficients but variable soil N/C ratios, and 0.46 and 0.30 kg C m−2 Figure 4. Photosynthetic and N-cycling constraint curves analogous to
Figure 3a, but assuming that soil N/C ratios vary with nf. We assume the relationship nso = 4.0nfl, where nso and nfl are N/C ratios of newly formed SOM and senescent foliage, respectively.
year−1, respectively, assuming variable allocation coefficients and variable soil N/C ratios.
Discussion
The simulations indicate that, for N-limited stands, changes in NPP with age can be explained in terms of two interacting processes: declining gross canopy photosynthetic efficiency and declining N availability as a result of increasing N immo-bilization in woody litter. The effect of declining N availability is even more important than the decline in gross canopy pho-tosynthetic efficiency if it leads to increased allocation below-ground (Figure 5). The decline in NPP was only weakly associated with increasing sapwood respiration. However, our conclusions about the relative importance of the three compet-ing hypotheses are sensitive to assumptions about the flexibil-ity of soil N/C ratios. Thus, if we assume that the soil N/C ratio varies significantly with stand age, then both N availability and gross photosynthetic efficiency are important, whereas if soil N/C ratios are constant, declining N availability is primarily responsible for the modeled decline in NPP.
For a given nf, the photosynthetic constraint of the young lodgepole pine stand can be 25% or more higher than that of the older stand (Figure 3a). This difference arises because the young stand has higher PAR utilization efficiency (εo) than the old stand; changes in sapwood respiratory load contributed little to the difference (Figure 3b versus Figure 3c). Such a large percentage change in modeled photosynthetic productiv-ity might suggest that high εo can explain the higher productiv-ity of young stands. However, scrutiny of both constraint curves reveals that nutrient cycling processes play a more important role than either εo or respiratory costs.
The main features of the analysis are summarized below. 1. Our explanation of aging process is strongly dependent on several assumptions, particularly woody litter decay rates and soil N/C ratios; hence to obtain reliable estimates of forest NPP it is important to model both woody litter accumulation and cycling of soil N and C correctly.
2. Declining soil N availability significantly reduced simu-lated NPP for the older lodgepole pine stand. The decline in NPP was related to woody litter accumulation on the ground and to a lesser extent increasing belowground allocation.
3. The age-related decline in NPP cannot be attributed solely to the young stand’s lower stemwood respiratory load and higher PAR utilization efficiency.
We assumed that both young and old stands can be regarded as effective equilibrium systems. However, several studies suggest that woody biomass and woody litter pools are rarely in equilibrium because of frequent disturbance and species succession (Cottam 1980, Franklin and Hemstrom 1980, Har-mon and Hua 1991). Often the whole or a part of the forest is destroyed by fire or wind before equilibrium is established (Heinselman 1980, Harmon et al. 1991). Therefore, the valid-ity of our equilibrium-based approach depends on the fre-quency of major disturbances and the time required to achieve effective equilibrium after a disturbance. McMurtrie and Comins (1995) provide evidence that the effective equilibrium is achieved within two decades of disturbance.
Acknowledgments
We are grateful to David King for helpful advice in the early phases of model development and Roddy Dewar, David King and Miko Kirschbaum for comments on the manuscript. The work was sup-ported by the NGAC Dedicated Research Grants Scheme and the Australian Research Council.
References
Aber, J.D., J.M. Melillo and C.A. McClaugherty. 1990. Predicting long-term patterns of mass loss, nitrogen dynamics and soil organic matter formation from initial fine litter chemistry in temperate forest ecosystems. Can. J. Bot. 68:2201--2208.
Adams, M.A. and P.M. Attiwill. 1986. Nutrient cycling and nitrogen mineralization in eucalypt forests of south-eastern Australia. Plant Soil 92:319--339.
Ågren, G.I. and J.F. Wikstrom. 1993. Modelling carbon allocation----a review. N.Z. J. For. Res. 23:343--353.
Attiwill, P.M. 1979. Nutrient cycling in a Eucalyptus obliqua (L’Herit)
forest. III. Growth, biomass and net primary production. Aust. J. Bot. 27:439--458.
Attiwill, P.M. and G.W. Leeper. 1987. Forest soils and nutrient cycles. Melbourne Univ. Press, Melbourne, 202 p.
Baldock, J.A., J.M. Oades, A.G. Waters, X. Peng, A.M. Vassallo and M.A. Wilson. 1992. Aspects of the chemical structure of organic materials as revealed by solid-state 13C NMR spectroscopy. Bio-geochemistry 16:1--42.
Binkley, D., F.W. Smith and Y. Son. 1995. Nutrient supply and declines in leaf area and production in lodgepole pine. Can. J. For. Res. 25:621--628.
Bonan, G.B. and K. Van Cleve. 1992. Soil temperature, nitrogen mineralization, and carbon source--sink relationships in boreal for-ests. Can. J. For. Res. 22:629--639.
Borman, B.T. and R.C. Siddle. 1990. Changes in productivity and distribution of nutrients in a chronosequence at Glacier Bay Na-tional Park, Alaska. J. Ecol. 78:561--578
Cannell, M.G.R. 1985. Dry matter partitioning in tree crops. In
Attrib-utes of Trees as Crop Plants. Eds. M.G.R. Cannell and J.E. Jackson. Inst. Terrestrial Ecol., Huntingdon, U.K., pp 160--193.
Chapin, F.S., III., P. Vitousek and K. Van Cleve. 1986. The nature of nutrient limitation in plant communities. Am. Nat. 127:148--158. Comins, H.N. 1994. Equilibrium analysis of integrated plant--soil
models, for prediction of the nutrient-limited growth response to CO2-enrichment. J. Theor. Biol. 71:369--385.
Comins, H.N. and R.E. McMurtrie. 1993. Long-term biotic response of nutrient-limited forest ecosystems to CO2-enrichment: equilib-rium behavior of integrated plant--soil models. Ecol. Appl. 3:666--681.
Cottam, G. 1980. Patterns of succession in different forest ecosystems.
In Forest Successsion Concepts and Application. Eds. D.C. West,
H.H. Shugart and D.B. Botkin. Springer-Verlag, New York, pp 178--184.
Escudero, A., J.M. del Arco, I.C. Sanz and J. Ayala. 1992. Effects of leaf longevity and retranslocation efficiency on the retension time of nutrients in the leaf biomass of different woody species. Oecolo-gia 90:80--87.
Fahey,T.J. 1983. Nutrient dynamics of aboveground detritus in lodge-pole pine (Pinus contorta ssp. latifolia) ecosystems, Southeastern
Wyoming. Ecol. Monog. 53:51--72.
Foster, J.R. and G.E. Lang. 1982. Decomposition of red spruce and balsam fir boles in the White Mountains of New Hampshire. Can. J. For. Res.12:617--626.
Franklin, J.F. and M.A. Hemstrom. 1980. Aspects of succession in the coniferous forests of the Pacific Northwest. In Forest Succession
Concepts and Application. Eds. D.C. West, H.H. Shugart and d.B. Botkin. Springer-Verlag, New York, pp 212--229.
Gholz, H.L. and R.F. Fisher. 1982. Organic matter production and distribution in slash pine (Pinus elliottii) plantations. Ecology
63:1827--1839.
Gholz, H.L., R.F. Fisher and W.L. Pritchett. 1985. Nutrient dynamics in slash pine plantation ecosystems. Ecology 66:647--659. Gower, S.T., H.L. Gholz, K. Nakane and V.C. Baldwin. 1995.
Produc-tion and carbon allocaProduc-tion patterns of pine forests. In Environmental Constraints on the Structure and Productivity of Pine Forest Eco-systems: A Comparative Analysis. Eds. H.L. Gholz, S. Linder and R.E. McMurtrie. Ecol. Bull. 43:115--135.
Grier, C.C. 1978. A Tsuga heterophylla--Picea sitchensis ecosystem of
coastal Oregon: decomposition and nutrient balances of fallen logs. Can. J. For. Res. 8:198--206.
Grier, C.C., K.A. Vogt, M.R. Keyes and R.L. Edmonds. 1981. Biomass distribution and above- and below-ground production in young and mature Abies amabilis zone ecosystems of the Washington
Cas-cades. Can. J. For. Res. 11:155--167.
Harmon, M.E. and C. Hua. 1991. Coarse woody debris dynamics in two old-growth ecosystems. Comparying a deciduous forest in China and conifer forest in Oregon. BioScience 41:604--610. Harmon, M.E., S. Brown and S.T. Gower. 1991. Consequences of tree
mortality to the global carbon cycle. In Proc. Carbon Cycling in Boreal Forest and Sub-arctic Ecosystems: Biospheric Responses and Feedbacks to Global Climate Change. Eds. T.S. Vinson and T.P. Kolchugina. Dept. Civil Engineering, Oregon State Univ., Corval-lis, Oregon, pp 167--177.
Harmon, M.E., J.F. Franklin, F.J. Swanson, P. Sollins, S.V. Gregory, J.D. Lattin, N.H. Anderson, S.P. Cline, N.G. Aumen, J.R. Sedell, G.W. Lienkaemper, K. Cromack, Jr. and K.W. Cummins. 1986. Ecology of coarse woody debris in temperate ecosystems. Adv. Ecol. Res. 15:133--302.
Heinselman, M.L. 1980. Fire and succession in the conifer forests of northern North America. In Forest Successsion Concepts and
Ap-plication. Eds. D.C. West, H.H. Shugart and D.B. Botkin. Springer-Verlag, New York, pp 374--405.
Hunt, H.W. 1977. A simulation model for decomposition in grass-lands. Ecology 58:469--484.
Jarvis, P.G. and J.W. Leverenz. 1983. Productivity of temperate, de-ciduous and evergreen forests. In Physiological Plant Ecology IV.
Ecosystem Processes: Mineral Cycling, Productivity and Man’s Influence. Eds. O.L. Lange, P.S. Nobel, C.B. Osmond and H. Ziegler. Springer-Verlag, Berlin, pp 233--280.
Jenkinson, D.S. 1990. The turnover of organic carbon and nitrogen in soil. Philos. Trans. R. Soc. Lond. B Biol. Sci. 329:361--368.
Johnson, D.W. 1993. Carbon in forest soils----research needs. N.Z. J. For. Sci. 23:354--366.
Keyes, M.R. and C.C. Grier. 1981. Above- and below-ground net production in 40-year-old Douglas-fir stands on low and high pro-ductivity sites. Can. J. For. Res. 11:599--605.
Kirschbaum, M.U.F., D.A. King, H.N. Comins, R.E. McMurtrie, B.E. Medlyn, S. Pongracic, D. Murty, H. Keith, R.J. Raison, P.K. Khanna and D.W. Sheriff. 1994. Modelling forest response to increaseing CO2 concentration under nutrient-limited conditions. Plant Cell Environ. 17:1081--1099.
Kozlowski,T.T., P.J. Kramer and S.G. Pallardy. 1991. The physiologi-cal ecology of woody plants. Academic Press, NY, 657 p. Lambers, H. and H. Poorter. 1992. Inherent variation in growth rate
between higher plants: a search for physiological causes and eco-logical consequences. Adv. Ecol. Res. 23:187--261.
Long, J.N. and F.W. Smith. 1992. Volume increment in Pinus contorta
var. latifolia: the influence of stand development and crown
dynam-ics. For. Ecol. Manage. 53:53--64.
Madgwick, H.A.I. 1985. Dry matter and nutrient relationships in stands of Pinus radiata. N.Z. J. For. Sci. 15:324--336.
McMurtrie, R.E. and H.N. Comins. 1995. The temporal response of forest ecosystems to doubled atmospheric CO2 concentration. Global Change Biol. In press.
McMurtrie, R.E., H.N. Comins, M.U.F. Kirschbaum and Y-P. Wang. 1992. Modifying existing forest growth models to take account of effects of elevated CO2. Aust. J. Bot. 40:657--677.
Meier, C.E., C.C. Grier and D.W. Cole. 1985. below- and aboveground N and P use by Abies amabilis stands. Ecology 66:1928--1942.
Monteith, J.L. 1977. Climate and the efficiency of crop production in Britain. Philos. Trans. R. Soc. Lond. Ser. B Biol. Sci. 281:277--294. O’Connell, A.M. 1990. Microbial decomposition (respiration) of litter in eucalyptus forests of south-western Australia: an empirical model based on laboratory incubations. Soil Biol. Biochem. 22:153--160.
Parton, W.J., D.S. Schimel, C.V. Cole and D.S. Ojima. 1987. Analysis of factors controlling soil organic matter levels in Great Plains grasslands. Soil Sci. Soc. Am. J. 51:1173--1179.
Pastor, J., R.H. Gardner, V.H. Dale and W.M. Post. 1987. Successional changes in nitrogen availability as a potential factor contributing to spruce decline in boreal North America. Can. J. For. Res. 17:1394--1400.
Peet, R.K. 1980. Changes in biomass and production during secondary forest succession. In Forest Successsion Concepts and Application.
Eds. D.C. West, H.H. Shugart and D.B. Botkin. Springer-Verlag, New York, pp 324--338.
Polglase, P.J. and P.M. Attiwill. 1992. Nitrogen and phosphorus cy-cling in relation to stand age of Eucalyptus regnans F. Muell.: I.
return from plant to soil. Plant Soil 142:156--166.
Polglase, P.J., P.M. Attiwill and M.A. Adams. 1992. Nitrogen and phosphorus cycling in relation to stand age of Eucalyptus regnans
F. Muell.: II. N mineralization and nitrification. Plant Soil 142:167--176.
Rayner, A.D.M. and L. Boddy. 1988. Fungal decomposition of wood. Its biology and ecology. John Wiley and Sons, Brisbane, 587 p. Ryan, M.G. 1991. A simple method for estimating gross carbon
budgets for vegetation in forest ecosystems. Tree Physiol. 9:255--266.
Ryan, M.G. and R.H. Waring. 1992. Maintenance respiration and stand development in a subalpine lodgepole pine forest. Ecology 73:2100--2108.
Santantonio, D. 1989. Dry-matter partitioning and fine-root produc-tion in forests----new approaches to a difficult problem. In Biomass
Production by Fast Growing Trees. Eds. J.S. Pereira and J.J. Landsberg. Kluwer Academic Publishers, Dordrecht, Boston, Lon-don, pp 57--72.
Schoettle, A.W. 1989. Potential effects of premature needle loss on the foliar biomass and nutrient retention of lodgepole pine. In
Transac-tions, Effects of Air Pollution on Western Forests. Eds. K.K. Olson and A.S. Lefohn. Air and Waste Management Assoc., Pittsburgh, pp 443--454.
Schulze, E.-D., W. Schulze, F.M. Kelliher, N.N. Vygodskaya, W. Ziegler, K.I. Kobak, H. Koch, A. Arneth, W.A. Kusnetsova, A. Sogatchev, A. Issajev, G. Bauer and D.Y. Hollinger. 1995. Above-ground biomass and nitrogen nutrition in a chronosequence of pristine Dahurian Larix stands in Eastern Siberia. Can. J. For. Res.
In press.
Stevenson, F.J. 1986. Cycles of soil: carbon, nitrogen, phosphorus, sulphur, micronutrients. Wiley, New York, 380 p.
Turner, J. 1977. Effects of nitrogen availability on nitrogen cycling in a Douglas-fir stand. For. Sci. 23:307--316.
Turner, J. and J.N. Long. 1975. Accumulation of organic matter in a series of Douglas-fir stands. Can. J. For. Res. 5:681--690. Vose, J.M., P.M. Dougherty, J.N. Long, F.W. Smith, H.L. Gholz and
P.J. Curran. 1995. Factors influencing the amount and distribution of leaf area in pine stands. In Environmental Constraints on the
Structure and Productivity of Pine Forest Ecosystems: A Compara-tive Analysis. Eds. H.L. Gholz, S. Linder and R.E. McMurtrie. Ecol. Bull. 43:102--114.
Waring, R.H. and W.H. Schlesinger. 1985. Forest ecosystems concepts and management. Academic Press, Orlando, San Diego, New York, 340 p.
Yoder, B.J., M.G. Ryan, R.H. Waring, A.W. Schoettle and M.R. Kauf-mann. 1994. Evidence of reduced photosynthetic rates in old trees. For. Sci. 40:513--527.
Appendix 1
Model variables and parameters, including parameterization for the old stand for Figure 3. Abbreviations: APAR = absorbed photosynthetically active radiation, C = carbon, GPP = gross primary production, N = nitrogen, NPP = net primary production, PAR = photosynthetically active radiation, SOM = soil organic matter. Subscripts: f = foliage, p = passive, r = fine roots, s = slow, w = wood, wl = woody litter.
Symbol Definition Value Units
Variables
bij (i = p,s; j = f,r) Fractions of leaf and root litterfall C which are sequestered in passive and slow SOM
Cf, Cw, Cwl,Cs , Csw C Content of foliage, wood, and woody litter slow SOM and sapwood kg C m−2
Csf, Csr, Cswl, Csp C Fluxes into slow SOM from decomposing foliage, fine root and woody litter, kg C m−2 year−1 and passive SOM
CRs Net C release from slow SOM decay kg C m−2 year−1
dwe Specific decomposition rate of woody litter year−1
E Function for N dependence of ε
-GPP, NPP Gross and net primary production kg C m−2 year−1
NRp, NRs, NRwl Net rates of N release from passive and slow soil and woody litter pools kg N m−2 year−1 NSp, NSs, NSw Rates of N sequestration in passive and slow SOM and wood kg N m−2 year−1
Nf, Nr N Contents of foliage and fine roots kg N m−2
Nmin Rate of N mineralization kg N m−2 year−1
nf, nr, nfl, nrl N/C Ratio of foliage, fine roots, foliage litter and fine root litter
-Rc, Rm Rates of construction and maintenance respiration kg C m−2 year−1
Rmf, Rmr, Rmsw Rates of foliage, fine root and sapwood maintenance respiration kg C m−2 year−1
U Rate of N uptake kg N m−2 year−1
Parameters
af, ar, aw Fraction of NPP allocated to foliage, fine roots and wood in the old stand 0.19, 0.58, 0.23
-bps Fraction of C release from slow SOM entering passive SOM 0.032
-bsp Fraction of C release from passive SOM entering slow SOM 0.16
-bss Fraction of C release from slow SOM which re-enters slow SOM 0.15
-bsw, bpw Fraction of C release from woody litter pool entering slow and passive SOM 0.32, 0.0017
-Cp Carbon content of passive SOM 4.0 kg C m−2
Dwl Woody litter decay rate: first value for the young stand and the following 0, 0.05, 0.1, 0.06 kg C m−2 year−1 three values for the old stand
dp, ds Specific decomposition rates of passive and slow SOM 0.00046, 0.013 year−1
Io Incident PAR over active growing season 1.164 GJ m−2
k PAR extinction coefficient 0.5
-NA Rate of atmospheric N deposition 0.00021 kg N m−2 year−1
NF Rate of N fixation 0 kg N m−2 year−1
nw, nwl N/C Ratios of passive SOM, new wood and senescing woody litter 0.1, 0.00139, 0.0007
-npo, nso N/C Ratios of newly formed passive and slow SOM 0.1, 0.035
-ncrit Foliar N/C ratio below which photosynthesis is N limited 0.035
-Q10, Q10′ Temperature dependence of maintenance respiration 2.0, 1.94
-rw Fraction of N in new wood obtained by retranslocation from existing wood 0.6
-R0 Respiration rate corresponding to 0 °C 27 kg C kg−1 N year−1
sf, sr Rate of foliage and fine roots senescence 0.12, 1 year−1
Ta Mean annual air temperature 3.8 °C
x Gaseous N emission fraction 0.01
-ε Maximum net PAR utilization efficiency 0.46 kg C GJ−1
εo Maximum gross PAR utilization efficiency 1.05 kg C GJ−1
σ Leaf area per unit of carbon 7.6 m2 kg−1 C
-Appendix 2
Equilibrium C content of the slow pool
Estimates of slow soil pool C and N are required to evaluate net release of N from slow SOM (NRs ). We estimate slow SOM of the old stand under the assumption that slow pool C and N are equilibrated, i.e., that C flux into the slow pool matches efflux:
Csf+Csr+Csp+Cswl=CRs, (A1)
where Csf, Csr,Cswl and Csp are influxes to the slow pool arising from decomposition of leaf, fine root, woody litter and passive SOM, respectively, and CRs is net release of C through decom-position of slow SOM:
CRs=dsCs(1 −bss), (A2)
where bss represents the fraction of decomposing slow pool C which reenters the slow pool. Analysis of the CENTURY model gives bss = 0.15.
We let bsf and bsr represent the proportions of leaf and fine root litter C subsequently entering slow SOM, to obtain:
Csf+Csr=(afbsf+arbsr)NPP. (A3)
When passive SOM decomposes, a proportion (bsp ) of its carbon loss enters slow SOM, giving:
Csp=dpCpbsp, (A4)
where dp is the decay rate of passive SOM and bsp , representing the fraction of C released through decomposition of passive SOM, which subsequently enters slow SOM, is evaluated from the CENTURY model of Parton et al. (1987).
The C flux from decaying woody litter into slow SOM is
Cswl=dwlCwlbsw, (A5)
where dwl is the woody litter decay rate, Cwl represents forest floor woody litter C and bsw is the fraction of woody litter C subsequently entering slow SOM.
There are no measurements of forest floor woody litter for either of the P. contorta stands considered here; in this paper we ran the model for four constant values of the product dwlCwl = Dwl (0for the young stand and 0.05, 0.1 and 0.07 kg C m−2 year−1 for the old stand). Equilibrium slow pool C is obtained by substituting Equations A2--A5 into Equation A1:
Cs=(
afbsf+arbsr)NPP+dpCpbsp+ Dwlbsw ds(1 −bss)
, (A6)