Summary Three independent methods were used to evaluate transpiration of a boreal forest: the branch bag, sap flow and eddy covariance methods. The branch bag method encloses several thousand needles and gives a continuous record of branch transpiration. The sap flow method provides a continu-ous record of sap velocity and an estimate of tree transpiration. The eddy covariance method typically measures evaporation rates between a forest and the atmosphere. We deployed an extra eddy covariance system below the forest to estimate canopy transpiration by difference.
The three systems detected small water vapor fluxes despite a plentiful supply of energy to drive evaporation. We also observed that transpiration rates were low even when the soil was well supplied with water. Low rates of transpiration were attributed to the canopy’s low leaf area index and the marked reduction in stomatal conductance as vapor pressure deficits increased. Water vapor fluxes, derived from the sap flow method, lagged behind those derived by the branch bag method by 1 to 2 h. The sap flow method also suffered from sampling errors caused by the non-uniformity of flow across the sapwood and the spatial variability of sapwood cross sec-tion throughout the forest. Despite technical difficulties asso-ciated with hourly measurements, daily totals of transpiration agreed well with values derived from micrometeorological systems.
Keywords: canopy transpiration, eddy covariance method, jack pine, Pinus banksiana, transpiration rate, water loss, water vapor flux.
Introduction
Boreal forests occupy about 11% of the earth’s terrestrial surface (Bonan and Shugart 1989) and are a globally important ecosystem. They are located in a continental climate that is characterized by very cold winters and relatively warm but short summers. Coniferous boreal species require at least one month with a mean temperature above 10 °C to regenerate (Köppen 1936), and their geographical extent is limited north-ward by the July 10 °C climatic isotherm. Because of the large area covered by boreal forests, the manner in which they
regulate their water use may significantly influence global climate and water balance. Boreal forests are usually estab-lished on flat land that has been eroded by glaciers and con-tains many lakes and streams. Thus, despite low precipitation in these regions (about 400 mm year−1 in the area of this study), the boreal forests do not appear to be short of water; however, they experience a high evaporative demand during summer as a result of high solar irradiances and air dryness.
To understand how trees in boreal forests control water loss, we used three techniques to study a stand of Pinus banksiana Lamb. (one of the three main species of the area) at three levels: branch, tree and whole ecosystem. We measured water vapor exchange rates of branches for 2.5 weeks near a site where water vapor fluxes were monitored by micrometeorological techniques. The branch-scale measurements were continuous and provided an average measure of gas exchange on many needles. Sap flow was recorded on five trees for about 4.5 months and used to calculate transpiration at the stand level. Transpiration was also calculated from microme-teorological measurements of water vapor fluxes above and below the forest canopy. Although sap flow determination has become a routine long-term measurement on forest stands (Granier et al. 1996) and has already been compared to mi-crometorological measurements above a forest canopy (Gra-nier et al. 1990), it has not previously been compared with branch-scale measurements.
Materials and methods Site characteristics
This work was conducted under the auspices of the BOREAS experiment (Sellers et al. 1995), an international study of the energy and matter exchanges of the boreal forest on a large area in Canada. Our research took place in the Southern Study Area. The region is covered with pure and mixed stands of black spruce (Picea mariana (Mill.) BSP) and white spruce (Picea glauca (Moench) Voss), aspen (Populus tremuloides Michx.) and jack pine (Pinus banksiana). Spruce stands occupy wet sites with limited drainage, whereas jack pine stands are estab-lished on sandy soils that are well drained and nutrient-poor.
Transpiration of a boreal pine forest measured by branch bag, sap
flow and micrometeorological methods
B. SAUGIER,
1A. GRANIER,
2J. Y. PONTAILLER,
1E. DUFRÊNE
1and D. D. BALDOCCHI
3 1 Ecophysiologie Végétale, CNRS URA 2154, Bâtiment 362, Université Paris-Sud, 91405 Orsay cedex, France2 INRA, Unité d’Ecologie Forestière, 54280 Champenoux, France 3
Atmospheric Turbulence and Diffusion Division, NOAA/ARL, P.O. Box 2456, Oak Ridge, TN 37831, USA
Received October 8, 1996
Field measurements were conducted on a jack pine stand on relatively flat land near Nipawin, Saskatchewan, Canada (53°54′59″ N, 104°41′31″ W; elevation 579 m).
Stand characteristics were determined by various BOREAS investigators. The stand was between 75 and 90 years old. Stand density was 1875 stems ha−1, mean diameter at breast height was 0.117 m, and basal area was 21.9 m2 ha−1. Canopy height varied between 12 and 15 m with a mean of 13.5 m. Some seasonal variation in canopy structure was observed. A flush of needles and male cones occurred in early June and needle yellowing, with appreciable loss of 2-, 3- and 4-year-old needles, occurred in September. Chen (1996) estimated leaf area index (LAI, one-half of total surface area of needles per unit ground area) of the site to be 1.89, 2.27 and 2.22 on Days 146, 210 and 253, respectively.
The understory was sparse, with isolated groups of alder (Alnus crispa (Ait.) Pursh). Ground cover consisted of bear-berry (Arctostaphylos uva-ursi (L.) K. Spreng.), bog cranberry (Vaccinium vitis-ideae L.), and lichens (Cladina and Cladonia spp.) that formed a nearly continuous cover.
The soil was a coarse-textured sand and was classified as a degraded Eutric Brunisol/Orthic Eutric Brunisol. Volumetric soil water measurements were made with a neutron probe by a team led by Dr. R. Cuenca (Oregon State University, Corvallis, OR). Total soil water content in the 0--170 cm layer decreased from 211 to 125 mm from May to September.
Sap flow measurements were started in spring (May 1, 1994) and continued until September 16. Branch bag measurements were limited to a 2.5 week-period between July 28 and August 16. Micrometeorological measurements were performed from May 21 to September 13.
Branch bags
Two translucent bags were installed on branches of two jack pine trees. The measurement system was supported by a scaf-fold tower. The branch bag gas exchange system has been described in detail by Dufrêne et al. (1993). Briefly, an acrylic frame supported large enclosures (200 and 260 dm3) consisting of 75 µm thick polypropylene film, which is transparent to solar radiation and, to a large extent, transparent to thermal infrared radiation. This feature helped to minimize the green-house effect inside the bags. A blower located on the scaffold-ing near the branch injected air into the bag at a high flow rate (about 50 dm3 s−1) through a flexible duct. On the bag, the air inlet and outlet were fitted with thin one-way Plexiglas flaps. These flaps opened with the air flow and closed by gravity when the flow stopped. The upper wall of the bag was remov-able to accommodate the branch and a slot in the side of the branch bag accommodated the stem. A plastic cover was then fitted onto this slot and the opening around the stem was sealed with neoprene foam. Air flowed through the bags nearly con-tinuously, except during measurements, which occurred for 5 min every half-hour. When the flow was stopped, the bag was sealed by the flaps and two small fans were switched on inside the bag to stir the air.
Conditions within the bags were recorded every 20 s, air temperature and relative humidity were monitored with
Vais-ala HMB 30YB probes (VaisVais-ala OY, Helsinki, Finland) pro-tected by a white hood, and photosynthetically active radiation (PAR) was measured with laboratory-made gallium arsenide sensors that were calibrated against an LI-190B sensor (Li-Cor, Inc., Lincoln, NE). A 21X data logger (Campbell Scien-tific, Logan, UT) was used to drive the system and to log the data.
Branch transpiration rate, E, was computed as:
E=(V/v)(de/dt)/(pS),
where V is bag volume (m3), v is the volume of one mole of air (m3 mol−1), S is half the total needle area (m2), de/dt is the increase in water vapor pressure (e, hPa) during time t (s), and p is atmospheric pressure (hPa).
Relative error in E was expressed as:
∆E/E=∆V/V+∆(de/dt) / (de/dt)+∆S/S.
Sap flow
Sap flow was monitored with 2-cm long radial sap flowmeters (Granier 1985, 1987). Each sensor had two probes, one was heated continuously at a constant power, the other one was not heated. The temperature difference (Tdiff) between the two probes was measured every 10 s with a copper-constantan thermocouple connected to a Campbell CR10 data logger and averaged every 30 min. Sap flow density F (10−6 m3 m−2 s−1 or µm s−1) was computed as:
F= 119(Tdiff, max/Tdiff)1.23,
where Tdiff, max is the maximum value of Tdiff recorded at night when transpiration is near zero. The Tdiff, max changed slightly from day to day. To determine the extent of this variation, Tdiff, max was plotted against time. Local maxima of Tdiff, max were then determined and linear interpolations were made between these values. Values of Tdiff, max ranged from 10 to 15 °C between sensors, and for a given sensor the variation was within 1 °C during the entire period.
Sap flow was measured on six trees that were selected to represent the diameter distribution of the stand. Circumfer-ences at breast height of these trees ranged from 25.6 to 52.1 cm, and their heights ranged between 10.5 to 14.7 m. For a given tree, sap flow was calculated as the product of sap flux density and sapwood area. Stand sap flow T (per unit ground area) was computed from the formula:
T=Ast
∑
i
(Fipi),
where Ast is stand sapwood area per unit ground area (m2 ha−1), Fi is mean sap flux density of trees in circumference class i, Ai is sapwood area of trees in class i, and pi is the Ai/Ast ratio.
The sensor installed on the smallest tree malfunctioned after four weeks, but the remaining five sensors worked properly from May 1, 1994 (Day Of Year 121) to September 16, 1994 (DOY 259). This time span covered most of the growing period. Sapwood thickness was determined on fresh cores taken on a sample of 20 surrounding trees on four perpendicu-lar radii. To identify the sapwood, which is more translucent than heartwood because of its higher water content, cores were observed in front of a light source. A relationship between tree circumference at breast height (C, cm) and sapwood area (A, cm2) was established:
A= 5.8 − 0.46C + 0.0441C2 (r2 = 0.89).
Estimated stand sapwood area was 12.3 m2 ha−1, i.e., 56% of basal area (21.9 m2 ha−1).
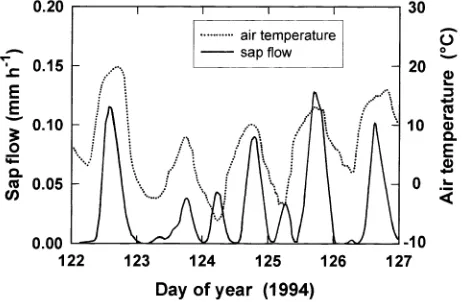
Low temperatures induced xylem freezing in early May. A sequence of four days is presented in Figure 1. When air temperature remained above --3 °C, sap flow showed diurnal variations that paralleled air temperature (Days 122 and 123 in Figure 1); however, this synchronism ceased when air tem-perature dropped below --3 °C (Days 124 and 125). Freezing of the xylem released heat near the cold probe of the sap
flowmeter, decreasing the temperature difference between the two probes and producing an apparent increase in sap flow; thawing of the xylem produced the opposite effect.
Micrometeorological fluxes
The eddy covariance method was used to measure evaporation rates. Two systems were employed to measure canopy transpi-ration. One system was mounted above the forest and the other system was placed 1.8 m aboveground. Details of the equip-ment and measureequip-ment methods are given by Baldocchi et al. (1996). Wind and virtual temperature fluctuations were meas-ured with 3-dimensional sonic anemometers (Applied Tech-nology Inc., Boulder, CO). Carbon dioxide and water vapor fluctuations were measured with an open path, infrared gas analyzer, developed at NOAA/ATDD (Auble and Meyers 1992). Additional measurements were made of: soil heat flux density (flux plates at 1 cm below the soil surface and tempera-ture sensors at depths of 2, 4, 8, 16 and 32 cm), heat storage into the trunks, PAR and net radiation above and below the tree canopy, and profiles of air temperature, humidity and CO2 concentration. Net radiation should be equal to the sum of sensible heat, latent heat, soil heat transfer and canopy heat storage. Baldocchi et al. (1996) were able to close the energy balance within 11% for short-term measurements (30-min averages) and for 24-h periods. A mean bias between net radiation at the forest floor and its energy balance components was only 10 W m−2. This reasonable level of energy balance closure provided the rationale for computing the tree canopy evaporation as the difference between water vapor fluxes measured above and below the canopy.
Results
Branch bag measurements
Figure 2 presents 6 days of branch bag measurements of transpiration. Maximum transpiration rates were low, with values slightly above 1 mmol m−2 s−1. With the same tech-nique, Dufrêne et al. (1993) measured maximum transpiration rates of up to 2.2 mmol m−2 s−1 on European beech. Because
inertia of the bag was small, the system responded to rapid changes in sunlight, as observed on Day 218, which was a cloudy and partly cloudy day. The method yielded small nega-tive values of evaporation at night.
In general, photosynthetic photon flux density (the only component of radiation that was measured inside the bags), varied in parallel with most variations in transpiration (Fig-ure 3). This correlation was not expected because, in forests, and especially in coniferous forests that are closely coupled to the atmosphere, transpiration is usually determined by the vapor pressure deficit of the air (VPD) and stomatal conduc-tance. To determine how stomata controlled transpiration, av-erage stomatal conductance was computed for the whole branch, assuming needle temperature was equal to air tempera-ture measured inside the bag. Because needle temperatempera-ture was slightly above air temperature during daytime, this procedure underestimated stomatal conductance, but the error was small because air inside the bags was well stirred by the two in-ner fans. Stomatal conductance ranged from 40 to 80 mmol
m−2 s−1. Stomata are known to respond to light and to VPD.
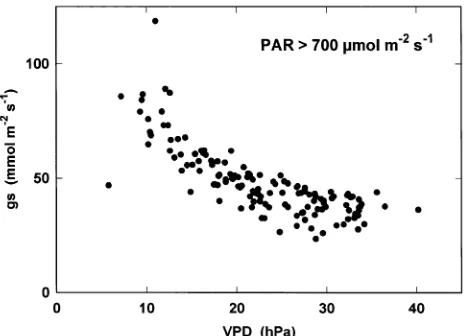
To separate the effects of these factors, we plotted stomatal conductance, gs, against PAR at low values of VPD (< 15 hPa, Figure 4) and against VPD at high PAR values (> 700 µmol m−2 s−1, Figure 5). Figure 4 shows the usual hyperbolic in-crease in gs with increasing PAR, with half the maximum value being reached at about 250 µmol m−2 s−1. Figure 5 shows a decrease in gs from 80 to 40 mmol m−2 s−1 when VPD increases from 10 to 30 hPa, indicating that as VPD increased from 10 to 30 hPa, transpiration rate, E (= gsVPD), increased slightly from 0.8 to 1.2 mmol m−2 s−1.
Sap flow versus branch bag measurements
Although the branch bag technique provided accurate meas-urements of transpiration and of its dependence on climatic factors, measurements only covered a 2.5-week period. Fur-thermore, they could not give a true average of transpiration under fluctuating conditions because measurements lasted
Figure 2. Variations in transpiration rate of a branch over a 6-day period at the beginning of August 1994.
Figure 3. Branch transpiration rate as a function of incident PAR over a 2.5 week measurement period in August 1994.
Figure 4. Average stomatal conductance of a branch versus incident PAR, for VPD values below 15 hPa. Data from two branch bags.
only 100 s every half-hour. Because sap flow measurements were performed at the stand level from May to mid-September, this method provided an estimate of transpiration over the entire season. A direct comparison between measurements of sap flow and transpiration for a clear day indicated that sap flow lagged behind transpiration (Figure 6). Even with a 1-h time lag, the curves differed: sap flow started later and more abruptly than transpiration. Sap flow also reached a maximum sooner and decreased more slowly than transpiration in the afternoon and evening.
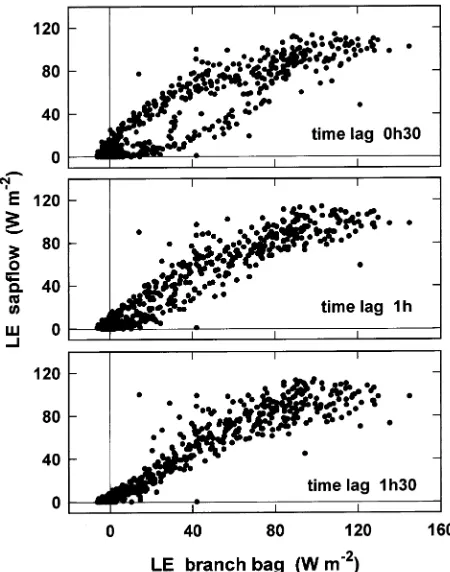
The explanation for this time lag is complex. It is at least partly a result of changes in water storage in the wood and needles above sap flow sensors (at 1.3 m height). To obtain an empirical estimate of the time lag, sap flow was plotted against branch transpiration for three time lag periods (Figure 7). A half-hour time lag clearly gave a hysteresis loop, whereas there was a better fit for the 1 h and 1.5 h time lags. Values of the square of the correlation coefficient (r2) between the sap flow and transpiration were 0.855, 0.906 and 0.902 for time lags of 0.5, 1 and 1.5 h, respectively (n = 673). A 1-h lag was finally retained for subsequent analysis. It was a compromise, because the time lag is not constant (e.g., Loustau et al. 1996). For instance, a comparison of two sets of data on a cloudy day with two peaks of solar radiation (Day 208 of Figure 2, data not shown) indicated that the time lag was in excess of 2 h. This longer time lag occurred because transpiration rate was low and it took more time to change the amount of water stored above the sap flow sensors.
Sap flow versus micrometeorological measurements
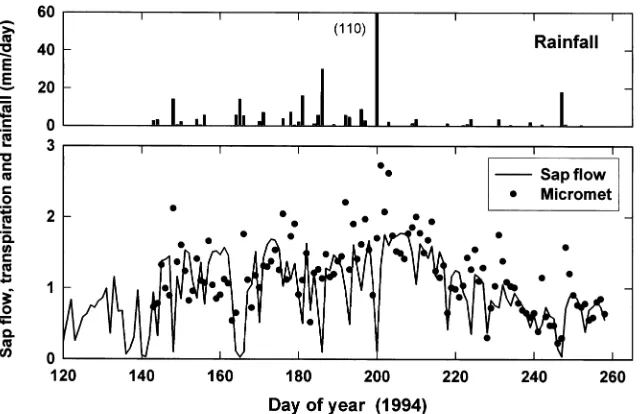
We compared daily values of stand sap flow and canopy evaporation, computed as the difference between water vapor fluxes above (Ec for canopy evaporation) and below the tree canopy (Es for soil evaporation). Because Es was not available for the whole period of measurement, Ec -- Es was regressed against Ec for the period of common measurements. On aver-age Ec -- Es equalled 0.76Ec. We then compared sap flow with
this parameterized estimate of tree evaporation (Figure 8). There was a good overall agreement between the two data sets. Discrepancies arose mainly during wet days or immediately after a rainy period. When there was rain, the eddy flux system measured evaporation from the wet canopy that was not re-corded by sap flow sensors. Also, when the soil was wet, Ec increased significantly. Once the tree canopy had dried, 0.76Ec
Figure 6. Latent heat fluxes of transpi-ration measured by the branch bag and sap flow methods. Sap flow meas-ured at time t is plotted at time t -- 1 hour (time lag of 1 h). To provide a better graphical comparison, values of branch bag transpiration were multi-plied by 2 (which is close to the LAI value of 2.3 recorded at that time). Data are from branch Bag 1 on Au-gust 5, 1994.
might have been an overestimate of actual tree transpiration because soil evaporation was still substantial. Despite these limitations, the agreement between the two methods was good, especially during cycles of soil drying (Days 233 to 247, and 250 to 258). However, there were also a few days with nearly zero sap flow that had no counterpart in the micrometeorologi-cal estimates. Again, these were rainy days for which a signifi-cant water vapor flux was not followed by a sap flow of the same magnitude.
Figure 8 also shows that the rates of tree transpiration were low. Daily totals of transpiration did not exceed 1.8 mm per day from sap flow estimates, and were slightly over 2 mm per day from micrometeorological estimates. These rates are low when compared with the available energy (daily net radiation divided by the latent heat of vaporization), which exceeded an equivalent of 6 mm per day on sunny days. Thus, most of the time, less than one-third of net radiation was used for tree transpiration. This reflected the low LAI (maximum of 2.3), the large needle aggregation in this forest, and the low values of stomatal conductance which ranged between 40 and 80 mmol m−2 s−1. This finding shows that most of the available energy at the land surface warmed the surface and the air.
Discussion
We studied the regulation of water loss by a boreal forest stand by three different methods at the branch, tree and stand levels. Branch bag measurements provided strong evidence that trees had low transpiration rates because they had low stomatal conductances. However, although stomatal conductance de-creased from 80 to 40 mmol m−2 s−1 when VPD increased from 10 to 30 hPa, a small increase in transpiration occurred (from 0.8 to 1.2 mmol m−2 s−1), indicating that stomatal control was not strong enough to prevent a slight increase in E with increas-ing VPD.
Stomatal response to PAR showed the usual hyperbolic shape, with complete stomatal opening at PAR values above 500 µmol m−2 s−1. Thus, the increase in E observed at high values of PAR (Figure 3) did not result from stomatal opening but from an increase in VPD that increased the driving force for transpiration (VPD was partly correlated with PAR, r2 = 0.515 for n = 673). This slight increase in E at high VPDs conflicts with data obtained at the stand scale by Baldocchi and Vogel (1996) on the same site using the eddy covariance method. They showed a modest reduction in transpiration with increasing atmospheric VPD. This differential response of transpiration to humidity deficits may be a result of scaling. In the branch bag, when stomatal closure was caused by an increase in VPD, leaf temperature increased, heating the bag and causing a further increase in both VPD and transpiration. In the open air, the increase in leaf temperature was smaller, because of strong coupling with the air and high eddy diffusiv-ity. Thus, VPD rarely exceeded 15 hPa in open air (Baldocchi et al. 1996), preventing further increases in transpiration.
The values of stomatal conductance determined in this study (40 to 80 mmol m−2 s−1) are small. Teskey et al. (1994) reported values ranging from 60 to 360 mmol m−2 s−1 for maximum stomatal conductance, gs,max, of various pine species. Thus, gs,max of jack pine appears to be in the lower range of these values. Schulze et al. (1994) examined values of maximum stomatal conductance in the context of leaf nitrogen concen-tration for various plant species and found that evergreen conifers have a mean gs,max of 5.5 mm s−1 or 220 mmol m−2 s−1 with a mean nitrogen concentration of 11 mgN gDM−1. At our site, the nitrogen concentration of jack pine needles was 10.3 mgN gDM−1 (data supplied by Dr. B. Middleton), implying that stomatal conductance of this species is below the average for evergreen conifers. However, with the data for all groups of plant species, Schulze et al. (1994) obtained a linear relation-ship between maximum stomatal conductance and nitrogen concentration, with a slope of 0.3 mm s−1 (or 12 mmol m−2 s−1)
per mgN gDM−1, which would give a gs,max of about 124 mmol m−2 s−1 for jack pine, a value relatively close to that observed. Several models have been proposed to explain the variations in stomatal conductance with environmental variables such as VPD and PAR. Some are purely empirical (Jarvis 1976, Lo-hammar et al. 1980). Others are partly empirical, based on a relationship between stomatal conductance and CO2 assimila-tion (Ball et al. 1987, Leuning 1995), with a theoretical inter-pretation given by Dewar (1995) in terms of guard cell function. Monteith (1995) has proposed several ways of ex-perimentally testing such models. Based on plots of leaf con-ductance versus transpiration rate or VPD, he distinguished three patterns. The most common pattern involves a linear decrease in stomatal conductance with increasing transpira-tion; i.e., an increase in VPD leads to a decrease in gs but this decrease is not strong enough to cause a decrease in transpira-tion. This was the pattern we observed for our branch bag measurements. The equation of Monteith (1995) may be writ-ten in the form of a linear regression of stomatal resistance (1/gs) versus VPD (cf. Hall and Kaufmann 1975):
1/gs= 1/gs,max+ VPD/Emax,
where gs,max and Emax are the maxima of gs and E, respectively. We applied this linear model to our branch bag data and obtained values of 200 mmol m−2 s−1 and 1.3 mmol m−2 s−1 for gs,max and Emax, respectively. Although uncertainty is relatively large on the intercept that gives gs,max, it is small on the slope that gives Emax. This value of Emax represents the maximum transpiration under any condition and was close to the highest values that we recorded for transpiration (see Figure 2). Our Emax value is low compared with reported values of 3 to 9 mmol m−2 s−1 for various grasses (Figure 7 in Monteith 1995) and the value of 35 mmol m−2 s−1 for sunflower (Fig-ure 3 in Monteith 1995).
We believe that Emax has greater significance for trees than for herbs because trees have the additional constraint to avoid cavitation in the stem. If trees use stomatal regulation to keep the water potential in the stem above the threshold value causing cavitation, as has been suggested (Cochard 1992), then Emax may be determined by the conductivity of the wood to liquid water and the ratio of sapwood area to leaf area, which will impose a limit on transpiration and thus on stomatal conductance and CO2 assimilation. The finding that Emax for Pinus banksiana is close to the maximum values that we recorded may mean that the low stomatal conductances and strong response to VPD observed in this species enable it to thrive in environments with high evaporative demand.
Scaling Emax to the stand scale for a jack pine stand with an LAI of 2.3 yields a maximum stand transpiration of 1.3 mmol m−2 s−1 times 2.3, or 3 mmol m−2 s−1. If this maximum value is maintained for 8 h a day, it leads to a daily transpiration rate of 1.6 mm per day, which is in good agreement with that recorded by the sap flow sensors. Thus, the value of Emax is an important component of the water balance and should be a more useful characteristic of a tree species than maximum stomatal conductance.
The low transpiration rates of our jack pine stand (Figure 8) represent, on a daily basis, about one-third of the energy available in net radiation. We conclude, therefore, that most of the net radiation warms the air above the forest. This conclu-sion is also supported by the fact that the ground vegetation is formed mainly of lichens that dry quickly after rain and then act as a mulch, leading to low evaporation rates at the soil level. At the stand level, low transpiration rates were caused by low stomatal conductances and a low leaf area index (maximum of 2.3). The low LAI may be caused by a lack of nitrogen. In boreal ecosystems, low soil temperatures limit decomposition rates and release of mineral nitrogen. For example, Linder (1987) has shown that irrigation and fertilization increased LAI from 1.95 (control, half of total leaf area) to 5.2 in a stand of Pinus sylvestris L. in Sweden. The finding that needle nitrogen concentration was not especially low does not mean nitrogen is not limiting, because trees probably regulate leaf area to avoid excessively low nitrogen concentrations in the needles.
Conclusion
Three methods were used to study transpiration at the branch, tree and stand levels. Branch bags gave detailed information on the way that transpiration varied with environmental vari-ables, and have the advantage over classical cuvette systems of being automated, providing a continuous record of a relatively large sample of needles. Sap flow sensors were easy to install, consumed less power than the other two techniques, and also gave a long-term continuous record. On the other hand, their hourly values were less reliable than those of the branch bags. Although micrometeorological measurements are the refer-ence for measuring ecosystem water losses, the estimate of stand transpiration from the two eddy-flux systems was less accurate than values derived from single systems, as a result of errors compounded by taking differences. Nethertheless, they provided a good complement and check to the other methods. This technique is also less intrusive, although it is costly and difficult to implement.
The study was undertaken to determine how boreal forests keep water loss low enough to avoid water stress despite relatively low precipitation and high evaporative demand in summer. We conclude that water loss was minimized as a result of low values of LAI (maximum 2.3 in our stand) and stomatal conductance (40 to 80 mmol m−2 s−1). Low LAI may result from a lack of nitrogen caused by low decomposition rates of litter and soil organic matter induced by low soil temperatures. Jack pine also appeared to have a low value of maximum stomatal conductance, and limited its maximum transpiration rate to about 1.3 mmol m−2 s−1 by strong stomatal closure in response to the diurnal increase in VPD. Low transpiration rates also explain why boreal forests are a strong heat source during the daytime.
Acknowledgments
and Forrest Hall for the scientific leadership they provided when conducting the BOREAS experiment. We also thank CNRS/Pro-gramme Environnement for funding the French team. DDB was sup-ported by a project funded by the NOAA Office of Global Change.
References
Auble, D. and T.P. Meyers. 1992. An open path, fast response infrared absorption gas analyzer for H2O and CO2. Boundary-Layer
Me-teorol. 59:243--256.
Baldocchi, D.D. and C.A. Vogel. 1996. Energy and CO2 flux densities
above and below a temperate broad-leaved forest and a boreal pine forest. Tree Physiol. 16:5--16.
Baldocchi, D.D., C.A. Vogel and B. Hall. 1996. Seasonal variation of carbon dioxide exchange rates above and below a boreal jack pine forest. J. Geophys. Res. In press.
Ball, J.T., I.E. Woodrow and J.A. Berry. 1987. A model predicting stomatal conductance and its contribution to the control of photo-synthesis under different environmental conditions. In Progress in
Photosynthesis Research. Ed. I. Biggins. Martinus Nijhoff Publish-ers, Netherlands, pp 221--224.
Bonan, G.B. and H.H. Shugart. 1989. Environmental factors and eco-logical processes in boreal forests. Annu. Rev. Ecol. Syst. 20:1--28. Chen, J.M. 1996. Optically based methods for measuring seasonal
variation in leaf area index in boreal conifer stands. Agric. For. Metorol. In press.
Cochard, H. 1992. Vulnerability of several conifers to air embolism. Tree Physiol. 11:73--83.
Dewar, R.C. 1995. Interpretation of an empirical model for stomatal conductance in terms of guard cell function. Plant Cell Environ. 18:365--372.
Dufrêne, E., J.Y. Pontailler and B. Saugier. 1993. A branch bag technique for simultaneous CO2 enrichment and assimilation
meas-urements on beech (Fagus sylvatica L.). Plant Cell Environ. 16:1131--1138.
Granier, A. 1985. Une nouvelle méthode pour la mesure du flux de sève brute dans le tronc des arbres. Ann. Sci. For. 42:193--200. Granier, A. 1987. Evaluation of transpiration in a Douglas-fir stand by
means of sap flow measurements. Tree Physiol. 3:309--320. Granier, A., V. Bobay, J.H.C. Gash, J. Gelpe, B. Saugier and W.J.
Shuttleworth. 1990. Vapor flux density and transpiration rate: com-parisons in a stand of maritime pine (Pinus pinaster Ait.) in Les Landes forest. Agric. For. Meteorol. 51:309--319.
Granier, A., P. Biron, N. Bréda, J.Y. Pontailler and B. Saugier. 1996. Transpiration of trees and forests stands: short and long-term monitoring using sap flow methods. Global Change Biol. 2:265--274.
Hall, A.E. and M.R. Kaufmann. 1975. Stomatal response to environ-ment with Sesamum indicum L. Plant Physiol. 55:455--459.
Jarvis, P.G. 1976. The interpretation of the variations in leaf water potential and stomatal conductance found in canopies in the field. Phil. Trans. Roy. Soc. London, Series B, Biol. Sci. 273:593--610. Köppen, W. 1936. Das geographischen System der Klimate. In
Hand-buch der Klimatologie, Part C. Eds. W. Köppen and R. Geiger. Gebrüder Bornträger, Berlin.
Linder, S. 1987. Responses to water and nutrition in coniferous eco-systems. In Potentials and Limitations of Ecosystem Analysis. Eds.
E.-D. Schulze and H. Zwölfer. Ecological Studies 61, Springer-Ver-lag, Berlin, pp 180--222.
Lohammar, T., S. Larsson, S. Linder and S.O. Falk. 1980. FAST----Simulation models of gaseous exchange in Scots pine. Ecol. Bull. 32:505--523.
Loustau, D., P. Berbigier, P. Roumagnac, C. Arruda-Pacheco, J.S. David, M.I. Ferreira, J.S. Pereira and R. Tavares. 1996. Transpira-tion of a 64-year-old maritime pine stand in Portugal. 1. Seasonal course of water flux through maritime pine. Oecologia 107:33--42. Leuning, R. 1995. A critical appraisal of a combined
stomatal-photo-synthesis model for C3 plants. Plant Cell Environ. 18:339--355.
Monteith, J.L. 1995. A reinterpretation of stomatal responses to hu-midity. Plant Cell Environ. 18:357--364.
Sellers, P.J., F.G. Hall, H. Margolis, B. Kelly, D. Baldocchi, G. den Hartog, J. Cihlar, M. Ryan, B. Goodison, P. Crill, J. Ranson, D. Lettenmaier and D. Wickland. 1995. Boreal Ecosystem--Atmos-phere Study (BOREAS): an overview and early results from the 1994 field year. Bull. Am. Meteorol. Soc. 96:1549--1577. Schulze, E.-D., F.M. Kelliher, C. Körner, J. Lloyd and R. Leuning.
1994. Relationships between maximum stomatal conductance, eco-system surface conductance, carbon assimilation rate and plant nitrogen nutrition: A global ecology exercise. Ann. Rev. Ecol. Syst. 25:629--660.
Teskey, R.O., D. Whitehead and S. Linder. 1994. Photosynthesis and carbon gain by pines. Ecol. Bull. 43:35--49.
Appendix 1. Variation in air humidity inside the branch bag after closure
Air vapor pressure inside the bag (e) increases from its value in outside air (ea) to an equilibrium value (ef) that is obtained when the loss of water vapor from the bag (due to leaks) is equal to branch transpiration. If V = bag volume, v = molar volume of air, p = atmospheric pressure, E = transpiration rate (per unit area), S = half the total needle area and L = the loss of water vapor due to leaks we may write:
(V/v)(de/dt)/p=ES−L. (A1)
Transpiration rate is proportional to stomatal conductance gs and to leaf to air VPD, i.e., E is proportional to es(Tl) -- e where es(Tl) is the saturation vapor pressure at leaf temperature:
E=g(es(Tl)−e)/p. (A2)
The flux of water vapor due to leaks is proportional to the difference in water vapor pressure between the inside and outside of the bag: The solution of Equation A4 is:
with:
ef=(
k1es(Tl)+k2ea) (k1+k2) =
(gSes(Tl)+lea)
(gS+l) . (A5) In the branch bags, l is smaller than gsS and ef is closer to es(Tl) than to ea. The vapor pressure e increases from ea to ef in