Supplementary Material for
“All-atom empirical force field for nucleic acids: 2) Application to molecular
dynamics simulations of DNA and RNA in solution.”
Supplementary Material Figure Legends
Figure 1) RMS differences versus time from solution MD simulations of the EcoRI dodecamer (A), the CATTTGCATC decamer (B) and the RNA UAAGGAGGUGUA dodecamer (C). RMS differences are for all non-hydrogen atoms excluding the terminal residues following least-squares fitting to the
canonical A (bold lines) and B (thin lines) forms of the respective sequences.
Figure 2) Probability distributions from an MD simulation of the CATTTGCATC decamer (bold lines) and from a survey of the B structures in the NDB (thin lines) as a function of the dihedral angles (A),
(B), (C), (D), (E), (F), and (G).
Figure 3) Probability distributions from an MD simulation of the CTCGAG hexamer (bold lines) in aqueous solution starting from the canonical B form of DNA and from a survey of the B structures in the NDB (thin lines) as a function of the dihedral angles (A), (B), (C), (D), (E), (F), and (G). Sampling was performed over the 500 to 2000 ps portion of the trajectory.
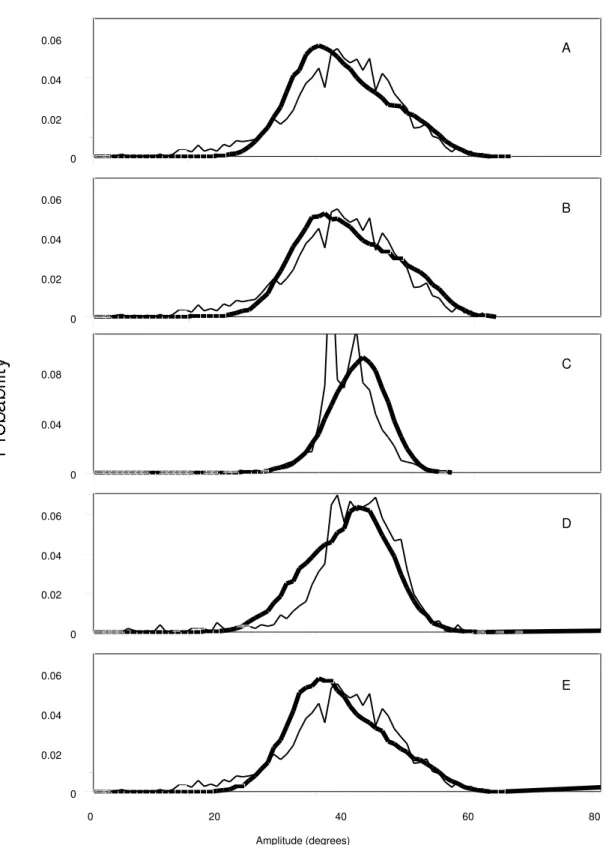
Figure 4) Probability distributions of the sugar puckering amplitudes from MD simulations (bold lines) of the A) EcoRI dodecamer, B) CATTTGCATC decamer, C) RNA UAAGGAGGUGUA dodecamer, D) CTCGAG hexamer in 75 % ethanol (initiated from A DNA) and E) the CTCGAG hexamer in aqueous solution (initiated from B DNA). Thin lines represent the sugar puckering ampltude
probability distributions from a survey of the NDB for B (A, B and E) and A (D) form DNA structures and for RNA structures (C).
Figure 5) Selected helicoid parameters from the EcoRI MD simulations (B with bold line) and crystal structures of EcoRI dodecamer. NDB identifiers for the crystal structures are bd0005 (J),72 bdl001 (H),73 bdl002 (F),74 bdl005 (G),75 and bdl020 (E).76 Helicoidal parameters were calculated via the FREEHELIX program.34
Figure 7) RMS differences versus time from the solution MD simulation of the EcoRI dodecamer performed using atom truncation for treatment of the electrostatic interactions. RMS differences are for all non-hydrogen atoms excluding the terminal residues following least-squares fitting to the canonical A (bold lines) and B (thin lines) forms of the respective sequences.
Figure 8) Probability distributions from the solution MD simulation of the EcoRI dodecamer (bold lines) performed using atom truncation for treatment of the electrostatic interactions and from a survey of the B structures in the NDB (thin lines) as a function of the dihedral angles (A), (B), (C), (D), (E),
0 2 4 6
A
0 2 4 6
B
0 2 4 6 8
0 500 1000 1500 2000 2500 3000
Time (picoseconds)
Figure 2)
0 0.02 0.04
A
0 0.02 0.04
B
0 0.02 0.04
C
0 0.02 0.04
D
0 0.02 0.04
E
0 0.02 0.04
F
0 0.02 0.04
0 60 120 180 240 300 360
Dihedral Angle (degrees)
0 0.02 0.04
A
0 0.02 0.04
B
0 0.02 0.04
C
0 0.02 0.04
D
0 0.02 0.04
E
0 0.02 0.04
F
0 0.02 0.04
0 60 120 180 240 300 360
Dihedral Angle (degrees)
Figure 4)
0 0.02 0.04
0.06 A
0 0.02 0.04 0.06
B
0 0.04
0.08 C
0 0.02 0.04 0.06
D
0 0.02 0.04 0.06
0 20 40 60 80
Amplitude (degrees)
0 1 2 3 4 5 6
0 400 800 1200 1600 2000
0 0.02 0.04
0 60 120 180 240 300 360
Dihedral Angle (degrees)
H 0
0.02
A
0 0.02 0.04
B
0 0.02 0.04
C
0 0.02 0.04
D
0 0.02 0.04
E
0 0.02 0.04
F
0 0.02 0.04