A study from selected
countries of the
Asia-Pacific region
A study from selected
countries of the
Asia-Pacific region
CARBON FOOTPRINT
CARBON FOOTPRINT
DUE TO MILK FORMULA
DUE TO MILK FORMULA
Report on
CARBON FOOTPRINT
A study from selected countries of the Asia-Pacific region
DUE TO MILK FORMULA
Report on Carbon Footprints Due to Milk Formula:
Written by:
Reviewed by:
Edited by:
Design by:
:
A study from selected countries of the Asia-Pacif ic region
© BPNI / IBFAN Asia 2015
Dr JP Dadhich, Dr Julie Smith, Alessandro Iellamo, Dr Adlina Suleiman
Libby Salmon
Dr. Arun Gupta
Amit Dahiya (BPNI)
Painting by Jonahmar A. Salovosa from Philippines. The master art piece was one of the winners for the UK based Freedom to Create World in 2008
978-81-88950-48-5
All rights are reserved by the Breastfeeding Promotion Network of India (BPNI)/International Baby Food Action Network (IBFAN) Asia. The use of the report on
, for education or information purpose, reproduction and translation, is encouraged. Any part of this publication may be freely reproduced, as long as the meaning of the text is not altered and appropriate acknowledgment and credit is given to this publication.
This is not a commercial publication. Front cover Photo Credit:
ISBN No.
Carbon Footprints Due to Milk Formula: A study from selected countries of the Asia- Pacif ic region
This document has been produced by the International Baby Food Action Network (IBFAN)-Asia and the Breastfeeding Promotion Network of India (BPNI) with the support of the Swedish International Development Cooperation Agency (Sida) and Norwegian Agency for Development Cooperation (Norad).
Our Ethical Policy: s
s
ACKNOWLEDGEMENTS
W
e are thankful to Dr. Phillip Baker from Australian National University for his assistancein accessing data on milk formula sales. We are grateful to Ines Fernandez, Puan Siti Norjinah Abdul Moin, Dr. Shoba Suri and Naomi Hull for assistance with the case studies.
This document has benef itted from invaluable contributions by Dr. Neelima Thakur, Vibharika Chandola and Amit Dahiya.
We are thankful to Dr. Arun Gupta, Regional Coordinator, IBFAN Asia for the motivation and encouragement to accomplish this task.
Authors We are thankful to Libby Salmon for reviewing the document and Alison Linnecar for providing valuable suggestions.
CONTENTS
Philippines
5
Foreword
7
Preface
8
Chapter 1: Introduction
11
Chapter 2: Methods
12
Chapter 3: Results
23
Chapter 4: Analysis of the Results
27
Chapter 5: Conclusions
27
Chapter 5: Conclusions
28
Bibliography
32
Annexure 1: Case Studies on the status of infant and young child
feeding policies, programmes and practices
Australia
Malaysia
India
Foreword
more damaging effects than other emissions. The greenhouse gas emissions for every kilogram of raw milk are comparable to driving a car 10-20 km, even without accounting for the energy costs of
manufacturing the milk powder. Clearing the land for dairy farming creates its own damage to
environmental diversity as well as in removing the Earth's innate 'carbon sinks', its forests.
Along with escalating demand for meat and dairy products by more affluent populations
particularly in Asia, the booming demand for formula milk forces us to ask some hard questions about sharing the costs of climate change, across countries, within countries, and between the current and future generations. Decisions on climate change are diff icult because the solutions may imply lower standards of living and health, in practice often inflicted on the poorest and weakest.
The answers to the problem of climate change are not simple, but at least in 2015 our leaders are now asking some of the right questions. It is no longer, who prof its versus who loses from the status quo?, but rather, can humanity afford to continue with the status quo?
However, in the case of infant and young child feeding, those asking the right questions are yet to be heard by the global community. To question the scale and activities of the highly prof itable baby food industry is still economic heresy, especially in major food exporting countries such as Australia or New Zealand. Meanwhile the highly sustainable and eff icient food system provided by lactating women for children is ignored, devalued and dishonoured by national and global leaders. Ironically, even as climate change contributes to extreme weather events, and greenhouse gas from the milk formula
I
n December 2015, governmentsmeeting in Paris f inally agreed on doing something about climate change. Negotiations were at a high level, and the links between human health, climate change and the environment hardly rated a mention amidst the detailed accounting for lost prof it and reduced emissions. And no one
mentioned the world's mothers and babies, or the environmental consequences of how most of the infants and children are now fed. Around two thirds of humans are inappropriately fed
processed food in early life. Much of this baby food is manufactured in countries which are hundreds, even thousands of miles away from where it is sold. Much comes from milking another species - a cow - grazed on pastures created from clearing forested land.
If all the immense resource costs of formula feeding were properly accounted for, the baby food industry would be closed down, and mothers paid to breastfeed. Economists call such unattributed resource costs 'externalities'. Industry can ignore such costs, as they are instead passed on to society, or inflicted on the environment. By distorting incentives,
externalities result in markets failing to give producers and consumers the right signals to conserve our common resources. In the case of mothers and babies, this means poor feeding practices resulting in higher health care costs for society, as well as for families. Likewise, when environmental consequences of the dairy industry are not fully accounted for in business decisions, costs are imposed on communities -increasingly on humanity as a whole - by
greenhouse gas emissions, land degradation, and loss of biodiversity. Methane gas emanating from dairy herds is one of the most potent forms of greenhouse gas, and is a key element of the global greenhouse gas problem. Methane gas results in
industry contributes to climate change, mothers and their young children face heightened risks of insecurity and starvation due to changing weather patterns and related floods, droughts, f ires, storms and other crises. The most vulnerable to the food insecurity, ill health and disease arising from climate change are those also exposed to formula and bottle feeding.
This study will initiate an important
conversation. It provides data on how the present formula feeding epidemic 'costs the earth'. Not just the babies. Or the children. Or even the mothers. But what, instead, it costs humanity in the form of greenhouse gas emissions, and dangerous climate change. The study also reveals the deep paralysis of governments who should be taking effective action to protect, promote and support breastfeeding as part of optimal infant and young child feeding.
This is a path breaking report. Concerns since the 1990s about the environmental impacts of the formula milk industry has now been translated into detailed data and analysis using
contemporary scientif ic method. There are diff icult decisions ahead, but by truly supporting women to breastfeed, improving IYCF policy is a rare opportunity for nations to meaningfully address the greenhouse gas problem, whilst also benef itting, rather than worsening, human health and social equity. It is time to start talking seriously about how reducing the unnecessary promotion, use and societal costs of formula milk feeding can help tackle the greatest challenge humanity has ever faced, sustaining Mother Earth.
Preface
T
his is an ever growingconcern that
consumption of ultra-processed foods and climate change /environment are majorly linked to causation of several health problems in women and children who are most
vulnerable, as well as contribute to non- communicable diseases overload of the world. At the same time latest series of the
Lancet in 2016 revealed how breastfeeding if scaled up to universal levels can truly contribute to protection of environment by zero waste, whereas formula feeding which is rapidly
growing with the economies leaves behind a huge carbon footprint.
This work was interesting to International Baby Food Action Network (IBFAN) who has
championed the cause of protecting women and children from aggressive marketing of baby food companies for more than three decades, when it came across more than 3 years back. We
deliberated on the subject in IBFAN's annual One Asia Breastfeeding Partners' Forum in 2011 in Mongolia and 2013 in Lao PDR as well as in the World Breastfeeding Conference in India in 2012. We developed a technical document titled 'Formula for Disaster' in 2014 giving important information about this subject. While working, we realized that there is a lack of concrete data on the contribution of milk formula to Green House Gases emissions. We began research on this issuesin 6 select countries of Asia-Pacif ic region and the report from these countries is now in your hands. Two of these countries were high income group, 2 were in the upper middle income group and 2 two belonged to lower middle income group according the World Bank criteria.
You would see how China shows rapidly gaining market share of the baby foods as well as the
GHG as compared to India and other countries. That's what is critical to look at. Within a period of 4 years China all milk formula grew from 29400 to 56000 tonnes, while India grew from 24480 to 27783 tonnes. In India of total sale of milk formula leads to 111,226 Tonnes of Green House Gases (GHG) while in China corresponding f igure is224,9287 tonnes.
Breastfeeding contributes to environmental sustainability, as breastmilk is a renewable food produced and delivered without pollution, unnecessary packaging or waste. In comparison milk formula needs energy to manufacture material for packaging, fuel for transport and resources for daily preparation and use. Breastfeeding, therefore, is the corner stone to the efforts to achieve SDG 13 on the climate change.
BPNI/International Baby Food Action Network (IBFAN) Asia, having worked in 6 countries India, China, Philippines, Malaysia, Australia, and South Korea on this issue would like to take this challenge further with dissemination of the f indings and stimulate discussions at country level. It would also be crucial to publish a technical and popular version of this report.
More countries should come forward to take on this work and make policy makers aware of such risk prevention by reducing consumption of formula feeds.
Needless to say, each country, whether developing or developed would be benef itted who invests in scaling up breastfeeding interventions, not just environmentally but economically as well.
INTRODUCTION
1
not breastfed had 1.8- and 2.0-fold higher risk of mortality, respectively, when compared to those who were breastfed. At a time when health systems and health resources are also being drained by the treatment costs of an epidemic of diet related chronic diseases, breastfeeding also provides protection against non-communicable diseases, particularly obesity, diabetes and high systolic blood pressure. Recently published research showed that increased IQ, educational attainment and monthly income in later life were associated with longer breastfeeding duration in infancy and early childhood.
As the world is facing a challenge to deal with the double burden of malnutrition, a study from Brazil found that exclusive breastfeeding for at least six months was protective against
overweight in children in the second year of life.
In line with above mentioned facts, this report shows that measures to increase women’s opportunities to engage in optimal infant and young child feeding (IYCF), which includes exclusive breastfeeding for six months, and continued breastfeeding to two years and beyond, is an effective and cost eff icient response to the urgent global problem of climate change, that also meets wider social and gender equity and
economic goals. Breastfeeding, unlike formula feeding, is an environmentally sustainable method of infant feeding. Industrially
manufactured milk formula further adds to the climate change burden.
The nutritional role, if any of follow-up or toddler formulas remain debated by regulatory bodies, notwithstanding recent WHO statements regarding the lack of necessity and potential harms. The statement clarif ies that as well as being unnecessary, follow-up formula is unsuitable when used as a breastmilk
replacement from six months of age onwards. Current formulations increase the risk of higher protein intake and lower intake of essential fatty acids, iron, zinc and B vitamins than those
10
11
12
13
14
C
limate change due to risingconcentrations of greenhouse gases in the environment affects human health in many ways, including through effects on food production and prices, and changed patterns of disease including increased infectious illness.
Climate change acts as a threat multiplier that interacts both directly and indirectly with variables, such as disease, food production, food security, food safety and poverty. Climate change further exacerbates the enormous existing burden of undernutrition as it affects food and nutrition security and undermines current efforts to reduce hunger and promote nutrition.
Along with the elderly, women and children are highly vulnerable to the health effects of changing weather and disease patterns, and extreme events associated with climate change. An increase in diarrheal and respiratory diseases especially in developing countries, is one consequence that will require greater health investments,
particularly in developing countries, while greater food insecurity also demands additional resources to protect nutrition and health.
Optimal breastfeeding not only provides optimal nutrition, it is an effective public health
intervention to enhance child survival, nutrition and development. Optimal breastfeeding protects children against infectious illnesses through a number of pathways. Formula fed children have much higher risks of infectious illness including gastroenteritis and respiratory infections, including in developed countries where hospitalisation rates are several times higher among children who are not optimally breastfed compared to exclusively breastfed infants. A recent systematic review and meta-analysis has found that risk of all-cause mortality in low and middle income settings was higher in predominantly (RR 1.5), partially (RR 4.8) and non-breastfed (RR 14.4) infants compared to exclusively breastfed infants 0-5 months of age. Children 6-11 and 12-23 months of age who were
1
2
3
4
5 6
7,8
Introduction
Standard milk formula is a product based on milk of cows or other animals and/or other ingredients, which have been generally agreed to be suitable for infant feeding, though its inadequacies as an alternative to breastfeeding are well
established . Also, powdered infant formula is
not a sterile product even if it has been
manufactured to meet current hygiene standards, and
being the pathogens of most concern.
Worldwide, industries are now being requested to quantify and reduce their carbon footprints, or emissions of greenhouse gases (GHGs) like Methane (CH4), Nitrous oxide (N2O) and Carbon dioxide (CO2) to the atmosphere.
The relatively high levels of GHG emissions due to the dairy industry are recognised. Studies have documented that dairy products are associated with relatively large greenhouse gas emissions per kg of products.
Calculating the carbon footprint of milk formula is a challenging but achievable task. Despite the rapid growth of the milk formula industry, especially in developing countries, which are most vulnerable to climate change, few studies have examined the GHG emissions from milk formula.
This report aims to calculate how much GHG emissions arise from milk formula sold in selected countries of the Asia-Pacif ic region based on the available sales data. The report does not include emissions arising from distribution to point of sale or consumption, from packaging and waste disposal and use at the family level
including hygienic preparation, boiling water and washing of bottles and teats etc. The globalized trade in formula makes it diff icult to calculate the amount of formula manufactured in a country from sales data for that country. In this paper GHG emissions are calculated for the formula sold in a country, and indicate the global GHG consequences of IYCF policies in each study country.
23,24
25
26
27,28,29,30
Cronobacter sakazakii Salmonella enterica
Methane and nitrous oxide are 25 and 298 times more potent as greenhouse gases than carbon dioxide.
recommended by WHO for adequate growth and development of infants and young children.
In spite of the great advantages of breastfeeding, use of milk formula is increasing rapidly, particularly in the Asia-Pacif ic countries, driven by the weak response of governments to regulate aggressive marketing of commercial baby foods, and the failure of labour market policy and workplaces to address the human rights of
women. Women need conducive environments
to practice optimal breastfeeding, which may be provided by implementation of the Global Strategy for Infant and Young Child Feeding (GSIYCF) , including protection, promotion and support for breastfeeding. The implementation of the GSIYCF has been assessed in 74 countries in Asia, Africa, Latin America, Arab World, Europe and Oceania using the WBT assessment tool , revealing a need for strengthening of policies and programmes on IYCF. Any attempt to reduce use of milk formula and subsequent GHG emissions will only be successful if breastfeeding rates are increased through effective implementation of the GSIYCF in its entirety.
Given the enormous resource demands on governments and communities to mitigate and ameliorate the effects of climate change on human health, it is curious that so little attention is being given to infant and young child feeding, in particular to reversing the current trends of increased formula feeding and reduced optimal breastfeeding both of which add to the existing climate change burden. These trends arise from social, economic and health system factors including increasing maternal employment, aggressive marketing of milk formula for infants and young children in increasingly affluent and time pressed populations, and lack of skilled and effective support for breastfeeding within many health services.
Marketing studies like those carried out by Euromonitor def ine milk formulas to include standard milk formula, follow-on milk formula, toddler milk formula and special baby milk formula. Milk formula are a combination of many industrially manufactured ingredients like milk powder, vegetable oil, high fructose corn syrup, sucrose and micronutrients etc.
15
16,17
18
19
20 21
22
T
o illustrate the GHG emission attributable to milk formula, the following methodology was used.Six countries of South Asia and East Asia & Pacif ic region, categorized by income, as per classif ication by the World Bank were selected for this study. The six countries were selected to illustrate GHG emissions for lower-middle, upper-middle and high-income countries, as well
as large and small populations (Table 1).31
2.1 Selection of countries
cane sugar or lactose as a source of carbohydrates and some micronutrients. The manufacturing process was identif ied from the published literature.
With the available information from the Codex guidelines, the contribution of each major ingredient in the composition of the milk
formula i.e. carbohydrates, proteins, and lipids in percentage terms were calculated.
The GHG emissions due to individual ingredients of the milk formula i.e. high fructose corn syrup, cane sugar, lactose, milk powder, whey protein concentrate and vegetable oil etc. were identif ied from the available literature.
GHG emissions were calculated for different possible combinations of major ingredients i.e. carbohydrates (high fructose corn syrup, cane sugar, lactose, milk powder), proteins (milk powder, whey protein concentrate) and lipids (various vegetable oils). Based on this calculation, an average GHG emission was calculated for the standard milk formula (and the special baby milk formula) and follow-on milk formula (and the toddler milk formula).
Multiplying the GHG emissions per kg by volume of sales provided the estimated GHG emission
2.3 Calculating contribution of
each ingredient in the
composition of milk formulas
2.4 Identifying GHG emissions due
to the individual ingredients of
the milk formula
2.5 Calculation of average GHG
emissions due to various
categories of milk formula
2.6 Computation of GHG emission
associated with milk formula sales
for each individual country
Table 1: Study Countries31
2.2 Review of literature
2.1.1 Retrieving industry data on milk formula sale:
2.2.2 Retrieving the composition of milk formula:
Published industry data from Euromonitor international for milk formula sales in the study countries was used to calculate volumes of milk formula sold in each
country. This data includes type of
formula used in 2012, as well as anticipated growth of milk formula usage in 2017.
The composition of milk formula was identif ied, using guidance from CODEX
Alimentarius guidelines on composition of infant formula, follow-up formula and formula for special medical use. Codex standards for follow-up formula include formula for use in young children up to 3 years of age, therefore, composition of toddler formula was retrieved using standards for follow-up formula. Milk formula is a processed food comprising of ingredients like milk powder (mainly cow's milk) as a source of proteins; vegetable oil as a source of fats; high fructose corn syrup or corn syrup or
22,32,33,34,35,36
Income Category Name of the Country
High Income
Upper Middle Income
Lower Middle Income
Australia; South Korea
China; Malaysia
India; Philippines
Methods
emissions due to other signif icant contributors, using Greenhouse Gas Equivalencies Calculator developed by US Environmental Protection Agency (USEPA) .
Case studies are also provided from selected countries to assess the existing status of
implementation of the Global Strategy for Infant and Young Child Feeding (GSIYCF), based on the World Breastfeeding Trends Initiative (WBT ) assessment tool. The WBT assessment reports have been produced by IBFAN for 74 countries around the world and provide an assessment of the policy context for optimal infant and young child feeding particularly breastfeeding. This assessment tool includes indicators of the status of policy implementation such as the
International Code of Marketing of Breastmilk Substitutes, maternity protection, and hospital practices.
37
38 i i
2.8 Case reports on the status of
IYCF policies and programmes in
the study countries
associated with milk formula sales for each individual country. This data includes various estimates for type of formula used in the year 2012 as well as industry forecasts of growth of milk formula usage from 2012 to 2017. GHG emissions were estimated using Microsoft Excel for total as well as sub-categories of milk formula, namely, standard milk formula (0-6 months), follow-on milk formula (7-12 months); toddler milk formula (13-24 months) and special baby milk formula (0-6 months). Estimates of GHG emissions based on the forecast trends in sales of milk formula in each country between 2012 and 2017 were also calculated. For simplicity, manufacturer and retailer stocks were ignored.
Estimated results for the GHG emissions due to milk formula sale have been compared with GHG
T
his chapter provides information about the composition of milk formula, manufacturing process for milk formula, identifying GHG emissions due to various ingredients of milk formula through a review of literature and estimation of GHG emissions due to various categories of milk formula in six study countries.Codex Alimentarius Commission (CAC) provides standards for various foods including standards for infant formula and follow-up formula which guide the composition of nutrients in these milk formulas, as well as inclusion of additives. Major nutrients identif ied by CAC as components in infant formula and follow-up formula are carbohydrates, proteins and lipids. Various sources for the major ingredients are:
carbohydrates (derived from lactose, high fructose corn syrup, cane sugar etc); proteins (derived from milk powder, whey protein concentrate etc), and
lipids (derived mainly from vegetable oils)
The manufacturing process for milk formula involves various methods to combine the ingredients to prescribed standards. The literature search identif ied manufacturing methods and per kilogram levels of GHG emissions for each of these ingredient as described below.
There are several sub categories of milk formula with somewhat different composition but similar manufacturing processes. Standard Infant formula (standard milk formula) is primarily used as a substitute for breastmilk in infants aged 0-6 months. Other products include “follow-up” formula, promoted as a dietary supplement for older infants. There are also special formulations
39
40
41
!
!
!
3.1 Composition of the milk
formula
3.2 Manufacturing processes for
milk formula
Infant formula
A breastmilk substitute specially manufactured to satisfy, by itself, the nutritional requirements of infants during the first months of life up to the introduction of appropriate.
Formula intended for infants in liquid or powdered form intended for use, where necessary, as a substitute for human milk or infant formula in meeting the special nutritional requirements arising from the disorder, disease or medical condition for whose dietary management the product has been formulated.”
A food intended for use as a liquid part of the weaning diet for the infant from the 6th month on and for young children.In the standards for follow-up formula Codex STAN 156-1987, Codex defines young children as “persons from the age of more than 12 months up to the age of three years (36 months)”. Manufacturers promote these products for age group 1-3
years .
Formula for special medical purposes
Follow-up formula
44
Box 1: Definitions of various milk formula - Codex
Alimentarius Commission (CAC)
42,43targeting specif ic nutritional needs or health issues for formula fed infants, such as soya based milks for lactose intolerant infants.
Milk formula is supplied either as a spray dried powder which is reconstituted as required, or in liquid form, typically packed in cans or “ready to use” sterile feeding bottles.
Powdered milk formula for infants and young children is manufactured at different plants in various countries but the processes are very similar worldwide.
Powdered infant formula is manufactured using one of two following processes :
1. In this process, dehydrated
ingredients in the powder form are mixed in the blending equipment to get a uniform blend of required nutrients. The blended product thus achieved is passed through a sifter to get rid of oversized particles and
45
46
Dry blending:
RESULTS
Results
production system.
4. Interpretation of the study with the analysis of results and drawing conclusions.
The system boundary largely depends on the goal of the study. In this study the system boundary is from farm to end of manufacturing process. More data are needed to extend the analysis from cow to baby's mouth, as GHG costs of travel by consumers to shops, refrigeration, heating of ready to feed, boiling of water for powdered milk to make it safe etc
The reference unit that denotes the useful output of the production system is known as the
functional unit, and it has a def ined quantity and quality. The functional unit can be based on a def ined quantity, such as 1 kg of product. Alternatively it may be based on an attribute of a product or process, such as 1 kg of fat and protein corrected milk (FPCM).
In this study, the functional unit used is 1 kg of product.
Estimating GHG emissions due to milk formula is a challenge as the product is a combination of many industrially manufactured products. There is a need to consider GHG emission due to each of the major ingredients. Calculating the GHG associated with each of the individual ingredients is the focus of this section, which f irst examines GHG emissions due to the manufacturing process for powdered milk, then looks at other ingredients such as oil and sugar.
Dairy milk powder is a major component of milk formula. GHG emission from dairy agricultural production include methane (CH4), nitrous oxide (N2O) and carbon dioxide (CO2).
Greenhouse gas emissions attributable to milk powder are signif icantly higher than for other dairy products because of the additional
processing and energy used during manufacture. As described earlier, to generate milk powder from the liquid milk, pasteurized milk is
28
51
3.4.1 GHG emissions due to milk powder manufacturing
3.4 Identifying GHG emissions due
to ingredients of milk formula for
infants and young children
stored. From here, the powdered product goes to the packaging line to f ill up the cans. Filled up cans are flushed with inert gas, sealed, labeled and packed in the cartons.
2. In this process,
ingredients are blended together,
homogenized, pasteurized and then spray dried to produce a powdered product. Heat sensitive micro nutrients (e.g., vitamins, amino acids and fatty acids) are added to the product after pasteurization. The rest of the process of sifting, storing and packaging remains the same as in the dry blending process.
3. Sometimes, a combination of these processes is used in which a base powder (consisting mainly of protein and fat components) is f irst produced using the wet mixing and spray drying process and then the base powder is dry blended with the carbohydrate, mineral and vitamin ingredients.
Milk proteins like casein and whey protein, sugar, vegetable oils, emulsif iers, mineral salts and micronutrients make up the basic ingredients in the milk formula.
Life cycle assessment (LCA) approach is
commonly used for evaluating the environmental effects of a particular activity, service or product. This approach takes into account the
environmental impacts during the entire life of a product 'from cradle to gate/grave', i.e. it includes all life cycle stages (and related activities) such as extraction of raw materials, production, and transportation, usage and waste management. The International Organization for Standardization (ISO 14040 and 14044 (ISO 2006a, b) has standardized the LCA approach into four steps:
1. Def ining goal and scope, the functional unit (FU), the system boundaries and the allocation criteria.
2. Life cycle inventory, which is concerned with data collection.
3. Life cycle impact assessment, which evaluates the magnitude and signif icance of the potential environmental impacts of a Wet mixing- Spray-drying:
47
48, 49
50
concentrated using an evaporator, and then spray-dried. The two processes concentration and drying - are both energy-intensive. The schema for the production of the milk powder
from the raw milk is depicted below in f igure 1.52
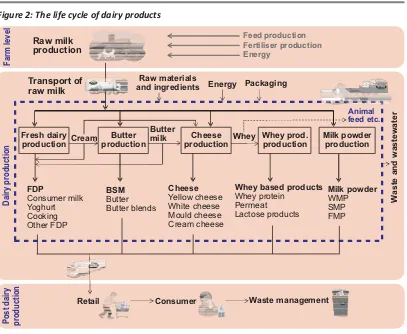
Figure 2 depicts a typical life cycle of dairy products: fresh dairy products like consumer milk, yogurt; butter; cheese; whey products like whey protein, lactose products; and milk
powder.53
Farm
Raw Whole
Milk
Cooling/
Storage
Thermization/
Seperation
Skimmed
Milk
Drying
Mixing
Evaporation
Pasturisation
Homogenisation
Cooling
Packaging
Milk
Powder
Figure 1: Schema for the production of milk powder
Raw milk production
Feed production Fertiliser production Energy
Transport of raw milk
Raw materials
and ingredients Energy Packaging
Fresh dairy production Cream
Butter production
Cheese production Butter
milk Whey prod. production
Milk powder production Whey
Animal feed etc.
W
aste
and
wastewater
FDP
Consumer milk Yoghurt Cooking Other FDP
BSM
Butter Butter blends
Cheese
Yellow cheese White cheese Mould cheese Cream cheese
Whey based products
Whey protein Permeat Lactose products
Milk powder
WMP SMP FMP
Retail Consumer Waste management
Farm
level
Dairy
production
Post
dairy
production
Results
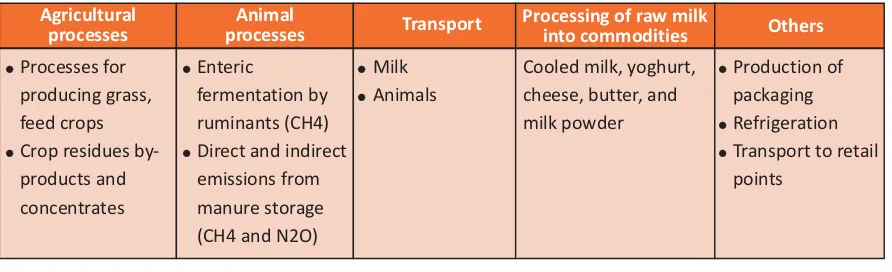
of milk powder. This means, for each 1 kg of powdered milk production and processing, 9.09 kg of raw milk is required. Based on the FAO estimate of GHG emission of 2.4 CO2-eq per kg of fat and protein corrected milk (FPCM) at farm gate, this will lead to GHG emission of 21.8 CO2-eq per kg of milk powder (9.09 x 2.4CO2-CO2-eq per kg). Table 2 depicts the sources of GHG emissions in dairy farms using the life cycle
28
According to the UN Food and Agriculture Organization (FAO), average global emissions from milk production in the dairy farms,
transport of the milk off-farm, and processing are 2.4 CO2-eq per kg of fat and protein corrected milk (FPCM - with 4.0 % fat and 3.3 % protein) at farm gate. According to global average, from 100 kg raw milk, 20kg (20%) is used for milk powder production, which results in production of 2.2kg
Table 2: Sources of GHG emissions using the life cycle approach for milk production, processing and transport28
Agricultural processes
Animal
processes Transport Processing of raw milkinto commodities Others
!
!
Processes for producing grass, feed crops Crop residues by-products and concentrates
!
!
Enteric
fermentation by ruminants (CH4) Direct and indirect emissions from manure storage (CH4 and N2O)
!
!
Milk Animals
Cooled milk, yoghurt, cheese, butter, and milk powder
!
!
!
Production of packaging Refrigeration Transport to retail points
The FAO report has documented a regional variation in the GHG emissions. The highest emissions are estimated for sub-Saharan Africa at 7.5kg CO2 eq per kg FPCM at the farm gate, while lowest values have been estimated for the industrialized countries at 1-2 kg CO2 eq per kg FPCM at the farm gate. Intermediate levels of emissions have been estimated for South Asia, West Asia & Northern Africa and Central & South America at 3 - 5 kg CO2-eq. per kg FPCM at the farm gate. These differences are due to higher productivity per animal in more intensive farm production systems.
There have been several country level attempts to estimate GHG emissions due to dairy products including milk. These use several different models. Italian experts have reported 'Latte GHG', which is an electronic worksheet dedicated to the Italian dairy production systems. A software tool, Dairy GHG has been reported from the North America, which calculates the carbon footprint of a dairy production system as the net exchange of all GHG in CO2 equivalent units per unit of energy-corrected milk produced, primary emission sources being enteric fermentation, manure, cropland used in feed production, and the combustion of fuel in machinery used to produce feed and handle manure and secondary emissions being those occurring during the production of resources used on the farm, which can include fuel, electricity, machinery, fertilizer, pesticides, plastic, and purchased replacement animals. From New Zealand, a tool OVERSEER® Nutrient Budgets (Overseer) has been reported which allows farm-specific greenhouse gas (GHG) emissions to be estimated. The GHG or carbon footprints are reported as emissions per unit of product, for example, per kg milk, meat or wool. Researchers from Denmark have developed the whole-farm model, 'Farm GHG', which is designed to quantify the flows of carbon (C) and nitrogen (N) on European conventional and organic dairy farms.
A study from south Germany dairy farms on carbon footprint of milk using Life Cycle Assessments has estimated a carbon footprint of 1.99 kg CO2 eq/kg of fat and protein corrected milk (FPCM). A report about the Australian dairy products has revealed that the average Australian milk production carbon footprint at the farm gate for 1 kg FPCM was 1.11 kgCO2eq. The major contributors to GHG emission were enteric fermentation (57%), manure (18%), purchased feed concentrate (8%), energy (8%), and fertilizer (9%). Similarly, a study from the University of Arkansas 'cradle to grave' life cycle analysis of milk revealed that for one kg of milk consumed in the United States per year, 2.05 kg of GHG are emitted over the entire supply chain to produce, process and distribute the milk.
The carbon footprint of powdered milk is much higher as reported in studies. Using an integrated 'cradle-to-gate' model (field to processing plant) in line with the LCA approach, the carbon footprint (CF) of Canadian dairy products including milk powder, has been estimated at 10.1 kg of CO2e/kg. This high level compared to dairy milk production indicates the high GHG generated by milk formula for infants and young children, on account of the necessary processing of milk into a product in powder form. A three-year (2010-2013) study of GHG emissions on 415 British dairy farms estimated the carbon footprint as 1,232 g of CO2e/litre.
54
55
56
57
58
59
60
61
62
3.4.2 GHG emissions due to vegetable oil
3.4.3 GHG emissions due to the production of sugar (high fructose corn syrup, corn syrup, cane sugar, lactose, etc)
GHG emissions due to the production of high fructose corn syrup
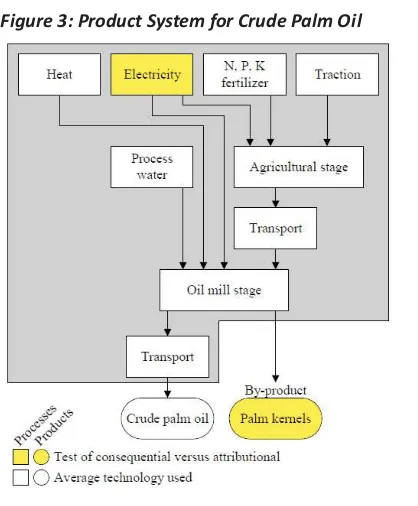
Vegetable oils are lipid-rich extracts derived from diverse sources including seeds, nuts, fruits, and legumes. The process to derive vegetable oil includes milling, sorting and cleaning; removing husks and crushing and extraction from the source. In addition, for many oils, a ref ining step is necessary. The energy intensities to produce soybean, rapeseed, and sunflower oils are in the same order or magnitude as they have similar extraction processes. Traditional palm oil and kernel oil extraction have lower overall energy consumption. The process used for production of palm oil is depicted in Figure 3.
A study to evaluate the environmental impacts of a number of major vegetable oils from different geographical regions of the world estimated a carbon footprint of ref ined oils as 760 kg eq CO2 per ton for sunflower oil, 2024 kg eq CO2 per ton for palm oil, 2024 kg CO2 eq per ton for soybean oil and 4717 kg CO2 eq per ton for peanut oil.
Table sugar, or sucrose is saccharose obtained commercially from beets and sugarcane. One of the f irst steps in sugar production is the extraction of sugary juices from the plant material. Sugarcane is crushed and the juice separated from the bagasse. The juice goes through a clarif ication process and then through evaporators to concentrate the clear juice into sugar liquor. Crystallizers then transform the sugar liquor into crystals that are separated with a centrifuge and dried to become raw sugar. Raw sugar can be used as is, but it is more commonly transported to sugar ref ineries to produce ref ined sugars.
Corn is processed according to two different methods: dry and wet. The dry process starts with dry kernels that are milled into a meal and used primarily for the fermentation industry, including ethanol and beverages. Wet corn milling includes de-germination, washing, grinding and screening, centrifuging and saccharif ication/conversion to the sweetener.
63
64
65
63
4
Figure 3: Product System for Crude Palm Oil
GHG emissions for glucose and fructose syrups derived from starch (isoglucose or HFCS as it is most commonly known in the USA) were 780 g (0.78 kg) CO2eq/kg isoglucose when German winter wheat was used as raw material whereas for the US corn-based variant, values ranged from 640 g (0.64 kg) CO2eq/kg (dry milling process) to 1100 g (1.1 kg) CO2eq/kg isoglucose (wet milling process).
A study has estimated the carbon footprint of sugar produced from sugarcane in Thailand as 0.55 kg CO2e kg sugar. GHG emissions for provisions of cane sugar to EU in kg CO2 eq t ref ined cane sugar ranged between 642-760
66
67
-1 68
-1
Consistent with the above, a study from Europe on production of glucose from cornstarch following the Life Cycle Assessment (LCA) principles assessed Greenhouse Gas emission for the system cradle-to-factory gate. Depending on the approach for allocation, the GHG emissions were from 0.7 to 1.1 kg CO2 eq./kg glucose ds.
GHG emissions due to the production of sugarcane sugar
Results
composition and proportion of major ingredients of milk formula.
provides global
standards for standard infant formula and infant formulas for special medical purposes marketed for infants 0-6 months of age, and for follow-up formula marketed for older children to 36
months. prescribes levels for
energy in kcal per 100 ml for formula ready for consumption. It also prescribes carbohydrates, proteins and lipids per 100 kcal of energy. The guidelines are largely flexible about the source of the nutrients and source for major ingredients in the formula.
As per the Codex standards, 100 ml of prepared standard infant formula (standard milk formula) should provide 60-70 kcal of energy. As per the Codex standards, the formula should also provide carbohydrates 9.0-14.0 g/100 kcal; proteins 1.8-3.0 g/100 kcal; and lipids 4.4 -6.0 g/kcal.
Since 60-70 kcal is provided by 100 ml of prepared standard infant formula (standard milk formula), to achieve 100 kcal of energy 142-166 ml of prepared formula will be required. For ease of calculation, we assume that an average of 150 ml of prepared formula will be required to achieve the required 100 kcal energy requirements.
The recommended quantity of standard infant formula powder for preparing 150 ml of liquid ready for consumption milk is 22.5g (4.5 g for 30 ml). Manufacturers recommend using one scoop of powdered formula for preparing 30 ml 3.5.1Codex Alimentarius
Codex Alimentarius
!
!
!
! depending on the GHG emitted during
transport.
Lactose is a simple sugar found in milk and is a major component of whey, derived from the processing of milk. As lactose is only 30% as sweet as sugar, it is used as a sugar supplement, as well as in food and confectionery. Lactose is also widely used as a sugar supplement in milk formulas for infants and young children, as bovine milk has much lower lactose content than needed for children's nutritional requirements. Lactose is a disaccharide carbohydrate, which is only produced as part of the milk of mammals, or as a storage carbohydrate in the seeds of a few plants by the condensation of glucose and galactose.
A study, which looked into the carbon footprints of dairy products in Sweden and New Zealand has estimated carbon footprints of 1.0 kg CO2eq per kg for the Lactose and 17.4 kg CO2eq per kg for the Whey Protein Concentrate. These values include emissions from dairy farming,
processing, packaging and transport.
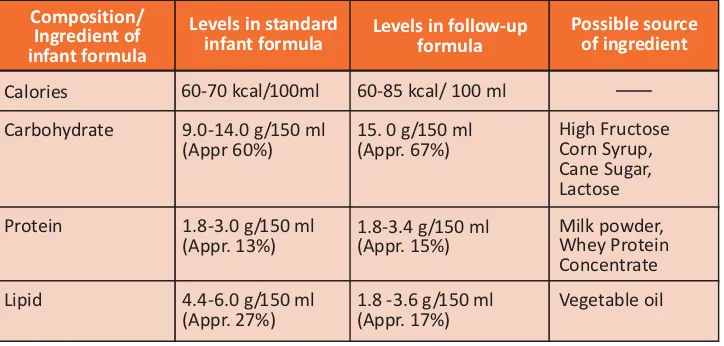
To estimate the GHG emissions arising per kilogram of milk formula sold, the composition and the possible source of major ingredients of the products were considered to calculate the proportion of each ingredient in the product. Table 3 provides information about the
66
69
53
4 GHG emissions due to the production of lactose
3.5 Estimation of GHG emissions
per kilogram of milk formula sold
Table 3: Composition of milk formula and estimated proportion of major ingredients in milk formula (based on Codex Alimentarius standards)
Composition/ Ingredient of infant formula
Levels in standard
infant formula Levels in follow-upformula
Possible source of ingredient
Calories 60-70 kcal/100ml 60-85 kcal/ 100 ml
Carbohydrate 9.0-14.0 g/150 ml (Appr 60%)
15. 0 g/150 ml (Appr. 67%)
High Fructose Corn Syrup, Cane Sugar, Lactose
Protein 1.8-3.0 g/150 ml (Appr. 13%)
1.8-3.4 g/150 ml (Appr. 15%)
Milk powder, Whey Protein Concentrate
Lipid 4.4-6.0 g/150 ml (Appr. 27%)
1.8 -3.6 g/150 ml (Appr. 17%)
of liquid ready for consumption However, the size of the scoop supplied by various
manufacturers varies from 4.0 grammes to 5.0 grammes. This report has taken an average f igure of 4.5 grammes for scoop size for calculation of powdered infant formula required for preparing liquid ready for consumption.
Using above mentioned amounts, proportion of each major nutrient is calculated.
According to the Codex standards, the energy content and nutrient composition of Formula for Special Medical Purposes intended for infants is based on the requirements for standard infant formula except for the compositional provisions which must be modif ied to meet the special nutritional requirements arising from the disease(s), disorder(s) or medical condition(s) for whose dietary management the product is specif ically formulated, labeled and presented.
According to the Codex standards, for the follow-up formula, the minimum levels of energy should be 60 kcal/100 ml; and protein contents 3.0 gm/100 kcal; fat content 3 gm/100 kcal and carbohydrates should be enough to achieve desired energy levels and similar levels of energy and ingredients are required for the toddler formula.
70
71
!
3.5.2
3.5.3
Using above mentioned amounts, proportion of each major nutrient is calculated by using the method described above for standard infant formula.
Standard Infant formula (standard milk formula) contains multiple ingredients, the major constituents being carbohydrates (60%), proteins (13%) and lipids (27%), as summarised in Table 3.
The source of major nutrients in formula are, for carbohydrates, high fructose corn syrup, cane sugar and lactose; for proteins, milk powder and whey protein concentrate, and for lipids, vegetable oils.
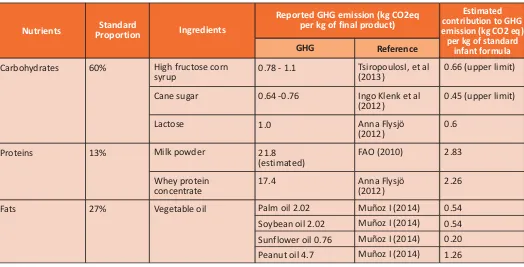
The GHG emissions due to ingredients for each nutrient have been identif ied from published research and based on the estimated standard proportion of the nutrients, the likely
ingredients of formula, and the reported GHG in kg CO2eq per kg of the ingredient product, the contribution of each ingredient to 1 kg of standard infant formula (standard milk formula) is estimated. Results are set out in Table 4 below.
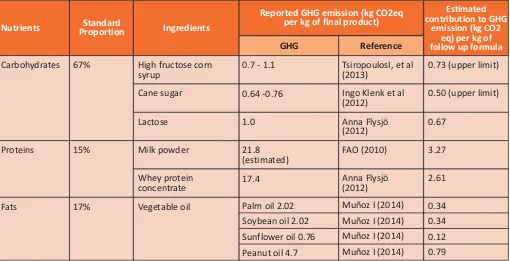
The follow-up formula (follow-on milk formula) contains multiple ingredients, the major constituents being carbohydrates (67%), !
!
!
!
3.6. Estimated GHG emissions due
to milk formula ingredients
Table 4: Estimation of GHG emissions due to individual ingredients in the standard infant formula (standard milk formula)
Nutrients ProportionStandard Ingredients
Carbohydrates 60% High fructose corn 0.78 - 1.1 syrup
TsiropoulosI, et al (2013)
0.66 (upper limit)
Reported GHG emission (kg CO2eq per kg of final product)
Estimated contribution to GHG emission (kg CO2 eq) per kg of standard
infant formula
GHG Reference
0.64 -0.76
Cane sugar Ingo Klenk et al
(2012)
0.45 (upper limit)
1.0
Lactose Anna Flysjö
(2012)
0.6
Proteins 13% 21.8
(estimated)
Milk powder FAO (2010) 2.83
17.4 Whey protein
concentrate
Anna Flysjö (2012)
2.26
Fats 27% Vegetable oil Palm oil 2.02 Muñoz I (2014) 0.54
Soybean oil 2.02 Muñoz I (2014) 0.54
Sunflower oil 0.76 Muñoz I (2014) 0.20
Results
Table 5: Estimation of GHG emissions due to individual ingredients in the follow-up formula (follow-on milk formula) in a kilogram of milk formula
Nutrients ProportionStandard Ingredients
Carbohydrates 67% High fructose corn 0.7 - 1.1 syrup
TsiropoulosI, et al (2013)
0.73 (upper limit)
Reported GHG emission (kg CO2eq per kg of final product)
Estimated contribution to
of follow up formula
GHG emission (kg CO2
eq) per kg
GHG Reference
0.64 -0.76
Cane sugar Ingo Klenk et al
(2012)
0.50 (upper limit)
1.0
Lactose Anna Flysjö
(2012)
0.67
Proteins 15% 21.8
(estimated)
Milk powder FAO (2010) 3.27
17.4 Whey protein
concentrate
Anna Flysjö (2012)
2.61
Fats 17% Vegetable oil Palm oil 2.02 Muñoz I (2014) 0.34
Soybean oil 2.02 Muñoz I (2014) 0.34
Sunflower oil 0.76 Muñoz I (2014) 0.12
Peanut oil 4.7 Muñoz I (2014) 0.79
milk formula) the calculation of GHG for different combinations is given in the Table 6 while the Table 7 contains calculation of GHG emissions for the follow-up and toddler milk formula.
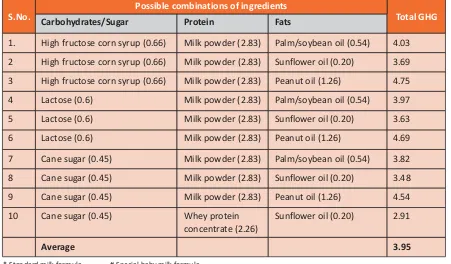
The calculation above shows that the GHG emission is 2.91-4.69kg CO2 eq per kg of the standard infant formula and the special baby milk formula product, depending on the ingredients used in the formula. The average GHG emission for these products therefore can be stated as 3.95 kg CO2 eq per kg.
For the Follow-on and Toddler’s milk formula, the GHG emission is 2.5-4.79 kg CO2 eq per kg of the product, depending on the ingredients used in the formula. The average GHG emission for
3.8 Average GHG emissions kg CO2
eq per kg of the standard milk
formula and the special baby milk
formula products
3.9 Average GHG emissions kg CO2
eq per kg of the follow-on milk
formula and toddler milk formula
products
proteins (15%) and lipids (17%), as depicted in Table 3.
The source of major nutrients remains same as in the standard milk formula for
carbohydrates, high fructose corn syrup, cane sugar, lactose; for proteins, milk powder, and whey protein concentrate, and for lipids, vegetable oils.
The GHG emissions due to ingredients for each nutrient for follow-up formula have been identif ied from published literature and based on the estimated standard proportion of the nutrients, the likely ingredients of formula, and the reported GHG in kg CO2eq per kg of the ingredient product, the contribution of each ingredient to 1 kg of Follow-up formula (follow-on milk formula) is estimated. Results are set out in Table 5 above.
There are various possible combinations of individual ingredients in the milk formula. The GHG emissions in kg CO2 eq per kg of the product for various possible compositions of the milk formulas, are estimated. For the standard infant formula (standard milk formula) and formula for special medical use (special baby !
!
Table 6: GHG emission for possible combinations of ingredients for standard infant formula and formula for special medical use (kgCO2 eq per kg of the product)
* #
Carbohydrates/Sugar Protein Fats
Average 3.95
1. High fructose corn syrup (0.66) Milk powder (2.83) Palm/soybean oil (0.54) 4.03
2 High fructose corn syrup (0.66) Milk powder (2.83) Sunflower oil (0.20) 3.69
3 High fructose corn syrup (0.66) Milk powder (2.83) Peanut oil (1.26) 4.75
4 Lactose (0.6) Milk powder (2.83) Palm/soybean oil (0.54) 3.97
5 Lactose (0.6) Milk powder (2.83) Sunflower oil (0.20) 3.63
6 Lactose (0.6) Milk powder (2.83) Peanut oil (1.26) 4.69
7 Cane sugar (0.45) Milk powder (2.83) Palm/soybean oil (0.54) 3.82
8 Cane sugar (0.45) Milk powder (2.83) Sunflower oil (0.20) 3.48
9 Cane sugar (0.45) Milk powder (2.83) Peanut oil (1.26) 4.54
10 Cane sugar (0.45) Whey protein Sunflower oil (0.20) 2.91 concentrate (2.26)
* Standard milk formula # Special baby milk formula (Figure in brackets taken from table 4)
Possible combinations of ingredients
Table 7: GHG emission for possible combinations of ingredients in follow-up formula* (kgCO2 eq per kg of the product)
Carbohydrates/Sugar Protein Fats
Average 4.04
1. High fructose corn syrup (0.73) Milk powder (3.27) Palm/soybean oil (0.34) 4.34
2 High fructose corn syrup (0.73) Milk powder (3.27) Sunflower oil (0.12) 2.50
3 High fructose corn syrup (0.73) Milk powder (3.27) Peanut oil (0.79) 4.79
4 Lactose (0.67) Milk powder (3.27) Palm/soybean oil (0.34) 4.28
5 Lactose (0.67) Milk powder (3.27) Sunflower oil (0.12) 4.06
6 Lactose (0.67) Milk powder (3.27) Peanut oil (0.79) 4.73
7 Cane sugar (0.50) Milk powder (3.27) Palm/soybean oil (0.34) 4.11
8 Cane sugar ((0.50) Milk powder (3.27) Sunflower oil (0.12) 3.89
9 Cane sugar (0.50) Milk powder (3.27) Peanut oil (0.79) 4.56
10 Cane sugar (0.50) Whey protein Sunflower oil (0.12) 3.23 concentrate (2.61)
* Follow on milk formula (Figure in brackets taken from table 5)
S.No. Total GHG
Possible combinations of ingredients
Results
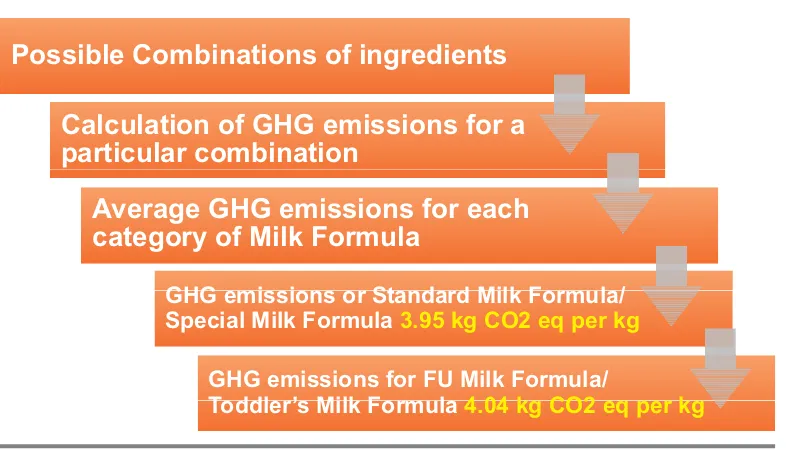
these products therefore can be stated as 4.04 kg CO2 eq per kg of the product.
Using the available published data for the sales volumes of milk formula used in the study countries, the GHG emissions attributable to milk formula for 2012 were calculated.
Multiplying these sales volumes by the average GHG emission of 3.95kg and 4.04 CO2 eq per kg
3.10 Estimate of GHG emissions
due to milk formula in six study
countries
of standard infant formula and the special baby milk formula and follow-on and toddler's milk formula milk products respectively produced the emission amount for GHG due to milk formulas sold in an individual country. (See Table 8). Estimates are also included for the forecast growth of milk formula usage for the period to 2017. (See Table 9). Per capita sale of the milk formula and consequent GHG emissions are calculated using available data on sale of milk formula; and data on child population 0-3 years in the study countries from the World Bank
data-bank. (Table 10)73
Figure 4: GHG Emissions (kg CO2 eq) per kg of Milk Formula
Possible Combinations of ingredients
Average GHG emissions for each
category of Milk Formula
Calculation of GHG emissions for a
particular combination
GHG
emissions
or Standard Milk Formula/
Special
Milk
Formula
3.95 kg CO2 eq per kg
GHG
emissions
for FU Milk Formula/
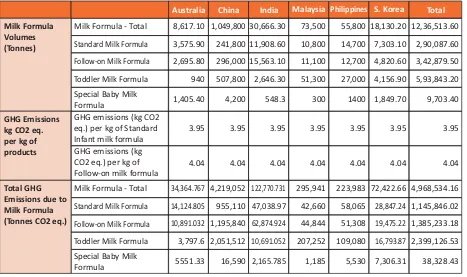
Australia China India Malaysia Philippines S. Korea Total 8,617.10 3,575.90 2,695.80 940 1,405.40 3.95 4.04 1,049,800 241,800 296,000 507,800 4,200 3.95 4.04 30,666.30 11,908.60 15,563.10 2,646.30 548.3 3.95 4.04 73,500 10,800 11,100 51,300 300 3.95 4.04 55,800 14,700 12,700 27,000 1400 3.95 4.04 18,130.20 7,303.10 4,820.60 4,156.90 1,849.70 3.95 4.04 12,36,513.60 2,90,087.60 3,42,879.50 5,93,843.20 9,703.40 3.95 4.04 Milk Formula - Total
Standard Milk Formula
Follow-on Milk Formula
Toddler Milk Formula
Special Baby Milk Formula
Milk Formula Volumes (Tonnes)
GHG emissions (kg CO2 eq.) per kg of Standard Infant milk formula
GHG Emissions kg CO2 eq. per kg of
products GHG emissions (kg CO2 eq.) per kg of Follow-on milk formula
34,364.767 14,124.805 10,891.032 3,797.6 5551.33 4,219,052 955,110 1,195,840 2,051,512 16,590 122,770.731 47,038.97 62,874.924 10,691.052 2,165.785 295,941 42,660 44,844 207,252 1,185 223,983 58,065 51,308 109,080 5,530 72,422.66 28,847.24 19,475.22 16,793.87 7,306.31 4,968,534.16 1,145,846.02 1,385,233.18 2,399,126.53 38,328.43 Milk Formula - Total
Standard Milk Formula
Follow-on Milk Formula
Toddler Milk Formula
Special Baby Milk Formula
Total GHG Emissions due to Milk Formula (Tonnes CO2 eq.)
Table 9: Volume of milk formula sales (tonnes), and attributable GHG emissions (tonnes CO2 eq) for milk formula in 6 countries (forecast for 2017)22,32,33,34,35,36
Australia China India Malaysia Philippines S. Korea Total
7,960.0 3311.8 2473.9 858.1 1316.2 3.95 4.04 560,000 144,500 168,100 246,200 1,200 3.95 4.04 27,783 10,843 14,103 2,383.4 453.4 3.95 4.04 54,200 8,800 9,300 35,800 300 3.95 4.04 50,900 13,600 12,000 24,100 1,200 3.95 4.04 19,607.3 8,258.7 5,283.5 4,408.4 1,656.7 3.95 4.04 720,450 189,313 211,260 313,749 6,126 3.95 4.04 Milk Formula - Total
Standard Milk Formula
Follow-on Milk Formula
Toddler Milk Formula
Special Baby Milk Formula
Milk Formula Volumes (Tonnes)
GHG emissions due to Standard Infant and Special baby milk formula
GHG Emissions kg CO2 eq. per kg of
products GHG emissions due to Follow-Up and Toddler milk formula
31,741.8 13,081.6 9,994.5 3,466.7 5,198.9 2,249,287 570,775 679,124 994,648 4,740 111,226.6 42,829.8 56,976.9 9,628.9 1,790.9 218,149 34,760 37,572 144,632 1,185 204,304 53,720 48,480 97,364 4,740 78,321.1 32,621.8 21,345.3 17,809.9 6,543.9 2,893,029 747,788 853,492 1,267,549 24,198 Milk Formula - Total
Standard Milk Formula
Follow-on Milk Formula
Toddler Milk Formula
Special Baby Milk Formula
Total GHG Emissions due to Milk Formula (Tonnes CO2 eq.)
Analysis of the Results
ANALYSIS OF THE RESULTS
4
4.1 Comparison of milk formula
sale and corresponding GHG
emissions among the countries
!!
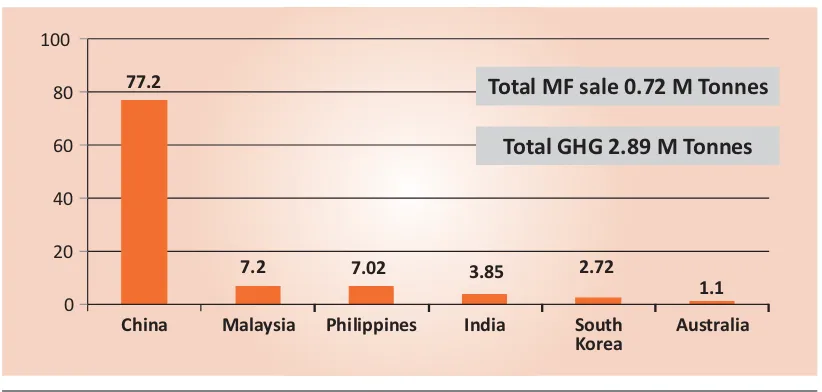
A total of 720,450 tonnes of milk formula were sold each year in the six study countries, China contributed 77.7%, Malaysia 7.2%, Philippines 7.02%, India 3.85%, South Korea 2.72% and Australia 1.1% to the sale. The contribution to the GHG emissions was in the same proportions. (See table 8)
The GHG emissions are also highest in China among the study countries with an annual emission of 2.24 million tonnes from sale of all kinds of milk formula. GHG emissions in China are approximately 10 times more in comparison to Malaysia; 21 times more than Philippines; 20 times more than India, 28 times more than South Korea and 70 times more than Australia. (See table 8 and Fig. 5)
!
!
The average per capita (children 0-3 years old) sales of milk formula and consequent GHG emissions in the six study countries is 5.39 kgs and 21.66 kg CO2 eq respectively. Maximum contribution in terms of per capita (children 0-3 years old) GHG emissions comes from South Korea (56.12 kg CO2 eq), followed by Australia (34.51 kg CO2 eq), Malaysia (13.05 kg CO2 eq), China (4.66 kg CO2 eq), Philippines (3.11 kg CO2 eq) and India (1.46 kg CO2 eq). Details about the per capita GHG emissions are given in Table 10.
Following is the analysis of the milk formula sales and corresponding contribution to GHG
emissions in each study country in 2012 (see table 11):
In Australia, standard milk formula is the single largest category Australia:
4.2 Country-wise analysis
E
stimates of GHG emissions due to milk formula sales in the study countries could be analysedwith comparison of milk formula sale and corresponding GHG emissions among the countries; an intra country comparison; analysis according to the product category of the milk formula; analysis according to the forecast volume of milk formula sales and attributable GHG emissions; and GHG emissions due to milk formula and comparing with other equivalent activities.
Figure 5: Contribution to GHG emissions in the study countries (2012)
77.2
7.2 7.02 3.85 2.72
1.1
0 20 40 60 80 100
China Malaysia Philippines India South
Korea Australia
Total MF sale 0.72 M Tonnes
Australia China India Malaysia S. Korea Total
Number of children age 0 - 3 years72
Table 10: Per Capita (child 0-3 years) GHG emissions due to milk formula sales in each country
Total milk formula Sale (Tonnes)
Per capita milk formula sale (kg)
Total GHG emissions due to milk formula
(Tonnes CO2 eq.) Per capita GHG emissions (kg CO2 eq) due to milk formula
Philippines
919,812 48,232,015 76,185,706 1,671,825 6,560,304 1,395,682 133,569,662
7,960.0 560,000 27,783 54,200 50,900 19,607.3 720,450
8.65 11.61 0.36 32.42 7.74 14.05 5.39
31,741.8 2,249,287 111,226.6 218,149 204,304 78,321.1 2,893,029
34.51 4.66 1.46 13.05 3.11 56.12 21.66
respectively to the total sale of milk formula and consequent GHG emissions.
1. Total GHG emission from milk formula sold in all six study countries is 2.89 million tonnes, of which 1.26 million tonnes is contributed by toddler milk formula, 0.85 tonnes by follow-on milk formula, 0.74 million tonnes by standard milk formula and 24,198 tonnes by special milk formula (See Figure 6).
2. Toddler milk formula is the largest contributor in the generation of GHG in China, Malaysia and Philippines, while in Australia and South Korea standard infant formula is the leading cause of GHG
emissions. In India, the major contributor is the follow-on milk formula followed by the standard milk formula (See Table 11).
An increase in volume of sales of milk formula was forecast in all countries over a period of 5 years between 2012-2017, except in South Korea where it will decrease. This will lead to a consequent increase in the overall GHG emissions.
The projected overall increase in GHG emission due to milk formula is greatest in !
!
4.3 Analysis according to the
product category of the milk
formula
4.4 Forecast volume of milk
formula sales (kg), and
attributable GHG emissions (see
table 9)
comprising of 41.6% of total milk formula sales. This is followed by follow-on milk formula 31%, special milk formula 16.5% and toddler milk formula 10.7%. Contribution to the GHG emission are in similar proportions.
In China, the toddler milk formula is the single largest contributor to GHG for infant and young child feeding products, comprising of 43.9% of total milk formula sales. Follow-on milk formula contributes 30% to the total sale of milk formula followed by the standard milk formula 25.8% and special milk formula 0.2%.
In India, the follow-on milk formula is the largest category with contribution of 50% to the total sale of milk formula and GHG emissions. This is followed by the standard infant formula 39%, toddler milk formula 8.5% and special milk formula 1.6%.
Toddler milk formula constitutes 66% of total milk formula sales in Malaysia and follow-on formula, standard infant formula and special milk formula comprising 17.1%, 16.2% and 0.55% of the total sales of milk formula.
Toddler milk formula is the single largest selling milk formula category in Philippines comprising 47.4% of total sales of milk formula with standard milk formula 26.7%, follow-on milk formula 23.6% and special formula 2.3% following the suit.
In South Korea, the standard milk formula leads the band-wagon with contribution of 42.1% with follow-on formula, toddler milk formula and special formula contributing 26.9%, 22.48% and 8.4% !
!
!
!
!
!
China:
India:
Malaysia:
Philippines:
Analysis of the Results
China (87.46%), followed by Malaysia
(35.60%), India (10.37%), Philippines (9.84%), Australia (8.25%) while South Korea will record a decrease in the sale (7.53%). In all the six study countries, follow-up and toddler formula together will remain the leading contributors to the GHG emissions in 2017 as per the sales projections.
Table 12 analyses the projected increase of milk formula in individual countries in percentage terms and also identif ies the category of leading milk formula in each country. It is interesting to note that in 4 study countries out of 6, either follow-on or toddler formula is projected to lead the maximum increase in the sale in 2017. In Australia, the standard infant formula is !
projected to lead maximum increase in sales among all milk formulas.
Toddler Milk Formula Followon Milk Formula Standard Milk Formula Special Milk Formula Total 3.5 3 2.5 2 1.5 1 0.5 0 Mi llion Tonne C O2 eq
Figure 6: GHG emission for each milk formula category in all six study countries
1.26 0.85 0.74 0.02 2.89 Australia
Table 11: Percentage contribution of different milk formula categories to GHG emissions from milk formula sold in each country
China India Malaysia Philippines S. Korea Standard Milk Formula
Follow on Milk Formula Toddler Milk Formula Special Milk Formula Country 41.6 25.8 39.0 16.2 26.7 42.1 31.0 30.0 50.0 17.1 23.6 26.9 10.7 43.9 8.5 66.0 47.4 22.4 16.5 0.2 1.6 0.55 2.3 8.4
* Leading category in each country is highlighted
Australia
Table 12: Forecast increase of the total volume of milk formula sales (tonnes) in percentage terms in 6 countries22,32,33,34,35,36
China India Malaysia Philippines South Korea 2012 (tonnes) 2017 (tonnes) Predicted percentage increase in total sale of
Total
Table 13: Projected percentage increase in the milk formula sales and consequent contribution to the GHG emissions (2012-2017) 22,32,33,34,35,36
Standard Milk Formula Follow-on milk formula Toddler milk formula Special baby milk formula
Sale (tonnes) GHG emission
(tonnes CO2 eq) Sale (tonnes)
GHG emission (tonnes CO2 eq)
Milk Formula
2012 2017
Projected increase
720,450.3
189,313.5
211,260.6
313,749.9
6,126.3
2,893,029.6
747,788.3
853,492.8
1,267,549.5
24,198.8
1,236,513.6
29,0087.6
342,879.5
593,843.2
9,703.4
4,968,534.1
1,145,846.0
1,385,233.1
2,399,126.5
38,328.4
71.6%
53.2%
62.3%
89.2%
58.3%
Table 14: Equivalent activities for GHG emission due to milk formula in the US37
Total GHG emissions due to milk formula (Tonnes CO2 eq.) 2.8 million tonnes
Equivalent to annual greenhouse gas emissions from any of these
6888.1 Million Miles driven by an average passenger vehicle
1.03 MillionTons of waste sent to the landfill
325.5 Million gallons of gasoline consumed
3107.4 Million Pounds of coal burned
74.1 Million tree seedlings grown for 10 years
2.37 Million acres of U.S. forests in one year Equivalent to annual CO2 emissions
from any of these
Equivalent to annual Carbon sequestered by any one of these
use in the study countries has been compared to equivalent activities for GHG emissions using the above-mentioned calculator. Table 14 compares the GHG emission due to milk formula with GHG emissions from miles driven by an average passenger vehicle and amount of waste sent to the landf ill; CO2 emission from amount of gasoline consumed and amount of coal burnt; and carbon sequestered by tree seedling grown for 10 years and acres of US forests in one year. The total estimated GHG emissions of 2.89 million tonnes CO2 eq. due to milk formula in the six study countries equals the annual greenhouse gas emissions from 6888.1 million miles driven by an average passenger vehicle or 1.03 million tonnes of waste sent to the landf ill; CO2 emissions from 325.5 million gallons of gasoline consumed or 3107.4 million pounds of coal burned; Carbon sequestered by 74.1 million tree seedlings grown for 10 years or 2.37 million acres of U.S. forests in one year.
Table 13 depicts projected combined increase in the individual formula category in percentage terms in 6 study countries with a similar increase in the contribution of GHG emissions. The projected increase in the total sale of milk formula is 71.6%. Among the categories of milk formula, maximum increase in sale is projected for the toddler formula (89.2%); followed by follow-on formula (62.3%), formula for special medical uses (58.3%) and Standard milk formula (53.23%).
The United States Environmental Protection Agency has developed a Greenhouse Gas equivalencies calculator, which translates abstract measurements of GHG emissions into concrete terms, which helps the user to understand the GHG emissions in a more practical way. GHG emission due to milk formula
37
Conclusions
CONCLUSIONS
5
policies and programmes on implementation of the International Code of Marketing of
Breastmilk Substitutes, maternity protection, hospital practices, information, community level counseling support and support during the diff icult situations such as HIV, emergencies and disasters etc. Case studies from four study countries, three of which are based on the World Breastfeeding Trends Initiative (WBT )
assessments have documented several gaps in policies and programmes on IYCF. This is leading to suboptimal breastfeeding and an increased demand for milk formula. There is a need for the governments, UN agencies and others to give adequate emphasis on the policies and programmes on IYCF not only for enhancing maternal and child health and nutrition but also as a measure to address the prevalent situation of climate change as highlighted in the sustainable development goal 13.
This study has been done only in six countries of the Asia Pacif ic region and limited only upto the sale point. There is a need to have an estimation of GHG emission due to milk formula for all countries and for all stages of the milk formula consumption including
manufacturing and post-manufactuing activities like transport to retailers, preparation of formula at home etc.
i
Future direction:
74
B
reastfeeding is a feeding method whichgenerates no carbon footprints of its own as a well nourished woman utilising her body fat stores needs no extra food.
Breastfeeding does not burden the earth with waste requiring disposal. On the other hand, the alternative used in place of breastfeeding, the industrially manufactured milk formula adds to GHG emissions at every step of production, transport and use. It also generates waste, which needs disposal, further adding to climate change.
The study and analysis of GHG emissions due to milk formula sold in six countries in Asia and Pacif ic region is relevant to ongoing global efforts to address climate change and curb carbon footprints. The study has revealed that milk formula is emerging as an important source of GHG emissions. Projections show an ever-increasing sale of these products with consequent increase in the GHG emissions. More worrisome is the increased use of unnecessary follow-on and toddler milk formulas in all study countries.
To reverse the trend of increasing use of milk formula and to reduce consequent GHG emissions, there is a need to invest in implementation of
in its entirety with special attention on protection, promotion and support for breastfeeding. It includes strengthening of
73
Gambar
Garis besar
Dokumen terkait
“Instrumen pencegahan pencemaran dan/atau kerusakan lingkungan hidup terdiri atas antara lain Kajian Lingkungan Hidup Strategis (KLHS), Analisis Mengenai
Gedung H, Kampus Sekaran-Gunungpati, Semarang 50229 Telepon: (024)
pengunjung Central Park Mall yang menggunakan layanan GO-CAR. 1.2
Pola pikir manusia, kebudayaan yang terbentuk, pemaknaan akan eksistensi diri dan negara merupakan beberapa akibat yang terbentuk dari sejauh mana manusia dalam suatu
Mengingat isu utamanya adalah masalah yang dialami imigran Cina di Amerika, maka gejala yang dihadirkan sangat khas gejala yang dialami subjek yang selalu berada dalam
Selain itu, sekolah umum yang merekomendasikan beberapa usulan dan menerima anak tuna rungu harus memberikan saran sebagai berikut: pertama, siswa tuna penyuluhan
menemukan bahwa ukuran perusahaan berpengaruh terhadap pengungkapan manajemen risiko.Sedangkan hipotesis ini berbanding terbalik dengan penelitian yang dilakukan oleh
Puji syukur kepada Allah SWT berkat anugrah dan karunianya, akhirnya penulis dapat menyelesaikan Tugas Akhir yang berjudul “ Simpanan Dirham Barokah KSPPS “ANDA”
