Introduction
Jakarta Bay is a semienclosed bay located on the west-ern side of the northwest-ern part of Java Island, Indonesia. It forms the southwestern shore of the Java Sea, which is a transoceanic gateway between the Indian Ocean to
the west and the Paciic Ocean to the east, and a loca -tion that allows the investiga-tion of the migratory path-way of Ostracoda (minute Crustacea) between these two distinct biogeographical regions. Titterton and Whatley
doi:10.2517/1342-8144-16.4.267
(1988) introduced 13 ostracode zoogeographical prov-inces based on the geographical distribution of species and degree of endemism in the shallow waters of the
Indo-Paciic Oceans. According to their study, ostracode
assemblages from the present study area belong to the East Indian Province, which extends from West Papua to the Malacca Straits and the South China Sea. However, Tanaka et al. (2009) investigated the Recent ostracode assemblages from the northern coast of Vietnam and sug-gested that the assemblage belonged to the Khymerian
Spatial distribution of recent ostracode assemblages
and depositional environments in Jakarta Bay,
Indonesia, with relation to environmental factors
LILI FAUZIELLY1, 2, TOSHIAKI IRIZUKI1
and YOSHIKAZU SAMPEI1
1
Department of Geoscience, Interdisciplinary Graduate School of Science and Engineering, Shimane University, 1060 Nishikawatsu-cho, Matsue 690-8504, Japan (e-mail: [email protected])
2
Faculty of Geology, Padjadjaran University, Jl. Raya Bandung Sumedang Km 21, Jatinangor Sumedang, West Java 45363, Indonesia
Received January 26, 2012; Revised manuscript accepted April 14, 2012
Abstract. Jakarta Bay is a semi-enclosed bay, located on the western side of the northern part of Java Island, Indonesia. This study reports the spatial distribution of recent ostracode assemblages from the top of 19 core samples collected in 1994 and the relationship between the assemblages and environmental factors. This study is the irst of the ostracode species of Jakarta Bay, and succeeded in identifying 94 species living there. Ostracodes are common in the East Indian Province. The dominant species found were Keijella carriei Dewi, Hemicytheridea reticulata Kingma, Loxoconcha wrighti Dewi, and Hemicytheridea ornata Mostafawi. Species belonging to the genera Cytherella, Cytherelloidea, Neomonoceratina, and Pistocythereis were also abundant. According to Q-mode cluster analysis, three biofacies (I, II, and III) were recognized, clearly distributed from the inner to the outer parts of the bay. Biofacies I is distributed in the muddy bottoms of the inner to the middle parts of the bay and is composed mainly of K. carriei, L. wrighti, and H. reticulata. Biofacies II is distributed in the muddy bottoms of the outer part of the bay and is characterized by the abundance of H. reticulata, H. ornata, and Cytherella spp. Biofacies III is distributed in the sandy mud bottoms of the outer part of the bay, and is characterized by high-diversity assemblages composed of Atjehella kingmai Keij, Foveoleberis cypraeoides (Brady), Neomonoceratina bataviana (Brady), and Pistocythereis cribriformis (Brady). This study correlated relationships between dominant species and bottom environment factors such as total organic carbon (TOC), total sulfur (TS), total nitrogen (TN), total organic carbon/ total nitrogen ratio (C/N ratio), and total organic carbon/total sulfur ratio (C/S ratio). The results show that K. carriei and L. wrighti are common in areas with high TOC and TN contents, even when they are anoxic, while H. ornata and H. reticulata preferably thrive in deeper areas with low TOC and TN contents. Thus, because of these environmental factors, species diversity and density are low in near-shore sites where the TOC content of mud is relatively high and the bottom is anoxic or oxygen-poor even though the water is shallow.
Province of Titterton and Whatley (1988). Thus, some problems are still left in the biogeography of ostracodes
around southeastern Asia.
Ostracodes from Indonesian seas were irst investigat -ed by Brady (1880). Since then a number of studies have contributed to a better understanding of ostracodes found in Indonesian seas. However, research on ostracodes in the Java Sea is relatively restricted (Kingma, 1948, Java Sea; Whatley and Watson, 1988, Thousand Island; Dewi, 1997, Bawean Island; Mostafawi et al., 2005, Bali Strait), and there have been no studies of ostracodes from Jakarta Bay, which faces the capital city of Indonesia, Jakarta.
This study aims to elucidate the recent ostracode fauna in Jakarta Bay and discusses the relationship between its distribution and environmental factors.
The bay is close to a large capital city (population greater than 9 million) and receives discharges from 13 rivers around Jakarta, owing to which serious
anthropo-genic impacts in this area have been recently observed (Fachrul et al., 2005; van der Meij et al., 2009). Among
the various environmental factors, bottom sediment qual-ity and oxic/anoxic conditions are of particular impor-tance to reconstruct paleoenvironments in the
southeast-ern Asian areas, since they strongly affect the density
and faunal composition of ostracode associations (Irizuki
et al., 2009a, 2010, 2011).
Study area
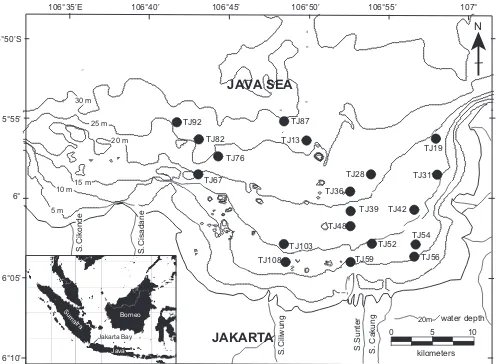
Jakarta Bay is a very fertile area as a result of an abun-dant supply of nutrients from rivers that cross the city. It covers an area of approximately 514 km2 (Figure 1) with an average depth of approximately 15 m. Aside from being a major port, Jakarta Bay supports isheries and
tourism, and has been the main recipient of wastewater from domestic and industrial activities in the surrounding
JAKARTA
TJ67 TJ92
TJ82
TJ87
TJ108 TJ76
TJ13
TJ59 TJ103
TJ48 TJ39 TJ36
TJ52 TJ42 TJ28
TJ56 TJ54
TJ19
TJ31
0
0
0
0
0
0
0
0
5
5
5
5
5
5
5
5
25 m
20m water depth 0
5
5
5
5
5
5
55
5
10
10
10
10
10
10
10
10
10kilometers N
S.Ciliwung S.Sunter S. Cakung
5 m
20 m
15 m 10 m
30 m
Borneo
Java Sumatra
Jakarta Bay
S.Cikonde S.Cisadane
JAVA SEA
106°35ʼ 106°40ʼ 106°45ʼ 106°50ʼ 106°55ʼ 107°
5°50ʼS
6°05ʼ
6°10ʼ 5°55ʼ
6°
E
area. Thus, there are a number of pressures on the marine environment throughout the year, leading to the deterio-ration of the bay.
Ilahude and Liasaputra (1978) and Ilahude (1995) measured water temperature, salinity, and dissolved oxy-gen in the bay as follows.
Water temperature.—Surface and bottom water tem-peratures ranged from 28.8 to 31.0°C and 28.4 to 29.0 °C, respectively. Surface temperature was higher than bottom temperature. Differences between the surface and
bottom temperatures were insigniicant. Water tempera -ture is almost the same in all locations, except in areas close to Tanjung Priok harbor, where the temperature is higher (Ilahude and Liasaputra, 1978).
Salinity.—The salinity of the surface and bottom waters ranged from 30.2 to 32.0 psu and 31.7 to 32.2 psu, respectively. Salinity increased toward the outer part of the bay. Salinity distribution in this area is affected by
water circulation, evaporation, rainfall, and river low
(Nontji, 1987).
Dissolved oxygen.—Dissolved oxygen in the bay ranged from 4.28 to 5.16 mL/L. During the fall transi-tion season (September–November), dissolved oxygen is higher in the east and decreases toward the west coast (Ilahude, 1995). Oxygen saturation levels of intermediate to surface water are high, indicating that the process of organic decay is limited in intermediate to surface water from estuaries or from land; offshore, water circulation
Table 1. List ofSample data
sample no. Latitude Longitude Depth
(m) Md ϕ Mud (%) TN
(wt%) TOC (wt%) TS ( wt%) C/N C/S
TJ13 TJ19 TJ28 TJ31 TJ36 TJ39 TJ42 TJ48 TJ52 TJ54 TJ56 TJ59 TJ67 TJ76 TJ82 TJ87 TJ92 TJ103 TJ108
106° 49' 44.4"E 106° 58' 0.4"E 106° 53' 54.4"E
106° 58' 1.4"E 106° 52' 33.6"E 106° 52' 37.0"E 106° 56' 38.2"E 106° 52' 34.3"E 106°53' 52.8"E 106° 56' 40.5"E 106° 56' 38.9"E 106° 52' 37.0"E 106° 42' 57.6"E 106° 44' 16.8"E 106° 43' 1.2"E 106° 48' 27.6"E 106° 41' 34.8"E 106° 48' 25.7"E 106° 48' 26.8"E
5° 56' 20.4"S 5° 56' 18.4"S 5° 58' 31.7"S 5° 58' 28.6"S 5° 59' 34.8"S 6° 0' 44.5"S 6° 0' 43.1"S 6° 1' 46.3"S 6° 2' 49.2"S 6° 2' 52.4"S 6° 3' 39.7"S 6° 4' 1.1"S 5°58' 26.4"S 5° 57' 21.6"S 5° 56' 13.2"S 5° 55' 10.6"S 5° 55' 8.4"S 6° 2' 50.6"S 6° 3' 58.5"S
27.2 17.8 21.0 16.5 21.0 19.5 17.0 17.8 15.2 13.1 11.0 10.4 19.6 22.7 29.1 29.7 24.8 16.0 13.7 8.0 8.1 7.9 8.5 8.4 8.3 8.3 8.2 7.6 8.7 8.4 7.5 7.9 8.6 7.8 8.2 8.5 7.7 8.2 98.9 99.4 99.7 99.4 97.8 96.8 99.4 98.1 77.8 97.0 78.5 91.1 76.3 76.9 48.3 94.8 93.1 97.6 99.8 0.135 0.125 0.136 0.133 0.128 0.134 0.134 0.077 0.144 0.165 0.128 0.166 0.088 0.108 0.046 0.121 0.051 0.164 0.148 0.883 0.918 0.901 0.895 0.806 0.777 0.831 0.561 1.294 1.406 0.941 1.949 0.608 0.728 0.532 0.819 0.334 1.109 1.328 0.312 0.207 0.459 0.533 0.593 0.748 0.414 0.835 0.950 1.056 1.192 1.291 0.417 0.233 0.703 0.326 0.107 0.498 0.974 6.564 7.358 6.605 6.744 6.288 5.777 6.187 7.287 8.958 8.500 7.330 11.769 6.939 6.766 11.505 6.747 6.598 6.773 8.990 2.831 4.427 1.962 1.679 1.359 1.039 2.009 0.672 1.363 1.332 0.790 1.510 1.458 3.128 0.756 2.511 3.116 2.229 1.363
1 2 3
0 0.5
1
1.5 2
0.04 0.06 0.08 0.1 0.12 0.14 0.16 0.18
0
0.5
1
1.5 2
0 0.2 0.4 0.6 0.8 1 1.2 1.4 5
6 7 8 9 10 11 12
7.4 7.6 7.8 8 8.2 8.4 8.6 8.8
TS (wt %) Md (phi)
TN ( wt %)
TO
C (wt%)
TO
C (wt%)
C/N ratio
y = -0.186 + 9.083x R = 0.845 y = 0.485 + 0.709x R = 0.668 y = 27.652 - 2.467x R = -0.501
provides oxygen saturation. However, dissolved oxygen in the water is seasonally changeable and has not been revealed in the bottom water.
Materials and methods
Sediment samples used in this study were collected in 1994 by the Indonesian Marine Institute. Nineteen sedi-ment cores were collected using a gravity corer (Figure 1, Table 1). The top 1–2 cm of these cores were used for ostracode faunal studies, sedimentology, and analyses of total organic carbon (TOC), total nitrogen (TN), and total sulfur (TS) contents.
Samples were weighed and washed through a 63-µm
sieve, then dried in an oven, and inally the residues were
sieved into 125-µm fractions. The dried sediments were weighed and mud content was calculated based on water content and weight of residue from the washed samples.
The samples of >125-µm fractions containing abun-dant ostracode specimens were divided into parts con-taining approximately 200 specimens each, using a sam-ple splitter. The number of specimens refers to the sum of left and right valves. One carapace was counted as two valves.
Grain size analysis was conducted using a laser
dif-fraction particle size analyzer (SALD-3000S, Shimadzu
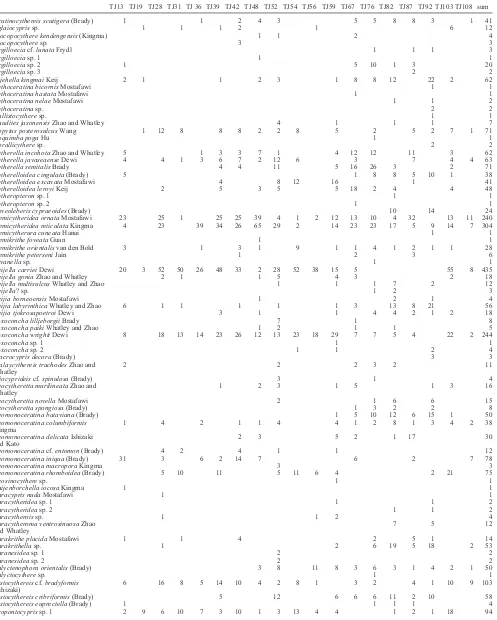
Table 2. Faunal list of recent ostracodes from Jakarta Bay
TJ13 TJ19 TJ28 TJ31 TJ 36 TJ39 TJ42 TJ48 TJ52 TJ54 TJ56 TJ59 TJ67 TJ76 TJ82 TJ87 TJ92 TJ103 TJ108 sum
Acutinocythereis scutigera (Brady) 1 1 2 4 3 5 5 8 8 3 1 41
Aglaiocypris sp. 1 1 1 2 1 6 12
Alocopocythere kendengensis (Kingma) 1 1 2 4
Alocopocythere sp. 3 3
Argilloecia cf. lunata Frydl 1 1 1 3
Argilloecia sp. 1 1 1
Argilloecia sp. 2 1 5 10 1 3 20
Argilloecia sp. 3 2 2
Atjehella kingmai Keij 2 1 1 2 3 1 8 8 12 22 2 62
Bythoceratina bicornis Mostafawi 1 1
Bythoceratina hastata Mostafawi 1 1
Bythoceratina nelae Mostafawi 1 1 2
Bythoceratina sp. 2 2
Callistocythere sp. 1 1
Caudites jasonensis Zhao and Whatley 4 1 1 1 7
Copytus posterosulcus Wang 1 12 8 8 8 2 2 8 5 2 5 2 7 1 71
Coquimba poga Hu 1 1
Corallicythere sp. 2 2
Cytherella incohota Zhao and Whatley 5 1 3 3 7 1 4 12 12 11 3 62
Cytherella javaseaense Dewi 4 4 1 3 6 7 2 12 6 3 7 4 4 63
Cytherella semitalis Brady 4 4 11 5 16 26 3 2 71
Cytherelloidea cingulata (Brady) 5 1 8 8 5 10 1 38
Cytherelloidea excavata Mostafawi 4 8 12 16 1 41
Cytherelloidea leroyi Keij 2 5 3 5 5 18 2 4 4 48
Cytheropteron sp. 1 1 1
Cytheropteron sp. 2 1 1
Foveoleberis cypraeoides (Brady) 10 14 24
Hemicytheridea ornata Mostafawi 23 25 1 25 25 39 4 1 2 12 13 10 4 32 13 11 240
Hemicytheridea reticulata Kingma 4 23 39 34 26 65 29 2 14 23 23 17 5 9 14 7 304
Hemicytherura cuneata Hanai 1 1
Hemikrithe foveata Guan 1 1
Hemikrithe orientalis van den Bold 3 1 3 1 9 1 1 4 1 2 1 1 28
Hemikrithe peterseni Jain 1 2 3 6
Javanella sp. 1 1
Keijella carriei Dewi 20 3 52 50 26 48 33 2 28 52 38 15 5 55 8 435
Keijella gonia Zhao and Whatley 2 1 1 5 4 3 2 18
Keijella multisulcus Whatley and Zhao 1 1 1 7 2 12
Keijella? sp. 1 2 3
Keijia borneoensis Mostafawi 1 2 1 4
Keijia labyrinthica Whatley and Zhao 6 1 1 1 1 1 3 13 8 21 56
Keijia tjokrosapoetroi Dewi 3 1 1 4 4 2 1 2 18
Loxoconcha lilljeborgii Brady 7 1 8
Loxoconcha paiki Whatley and Zhao 1 2 1 1 5
Loxoconcha wrighti Dewi 8 18 13 14 23 26 12 13 23 18 29 7 7 5 4 22 2 244
Loxoconcha sp. 1 1 1
Loxoconcha sp. 2 1 1 2 4
Macrocypris decora (Brady) 3 3
Malaycythereis trachodes Zhao and Whatley
2 2 2 3 2 11
Miocyprideis cf. spinulosa (Brady) 3 1 4
Neocytheretta murilineata Zhao and Whatley
1 2 3 1 5 1 3 16
Neocytheretta novella Mostafawi 2 1 6 6 15
Neocytheretta spongiosa (Brady) 1 3 2 2 8
Neomonoceratina bataviana (Brady) 1 5 10 12 6 15 1 50
Neomonoceratina columbiformis Kingma
1 4 2 1 1 4 4 1 2 8 1 3 4 2 38
Neomonoceratina delicata Ishizaki and Kato
2 3 5 2 1 17 30
Neomonoceratina cf. entomon (Brady) 4 2 4 1 1 12
Neomonoceratina iniqua (Brady) 31 3 6 2 14 7 6 2 7 78
Neomonoceratina macropora Kingma 3 3
Neomonoceratina rhomboidea (Brady) 5 10 11 5 11 6 4 2 21 75
Neosinocythere sp. 1 1
Paijenborchella iocosa Kingma 1 1
Paracypris nuda Mostafawi 1 1
Paracytheridea sp. 1 1 1 2
Paracytheridea sp. 2 1 1 2
Paracytherois sp. 1 1 2 4
Paracytheroma ventrosinuosa Zhao
and Whatley 7 5 12
Parakrithe placida Mostafawi 1 1 4 2 5 1 14
Parakrithella sp. 1 2 6 19 5 18 2 53
Paranesidea sp. 1 2 2
Paranesidea sp. 2 2 2
Phlyctenophora orientalis (Brady) 3 8 11 8 3 6 3 1 4 2 1 50
Phlyctocythere sp. 1 1
Pistocythereis cf. bradyformis (Ishizaki)
6 16 8 5 14 10 4 2 8 1 3 2 4 1 10 9 103
Pistocythereis cribriformis (Brady) 5 12 6 6 6 11 2 10 58
Pistocythereis euprectella (Brady) 1 1 1 1 4
Co., Ltd., Japan) after decomposition of organic matter and pyrite with H2O2 for several days.
TOC, TN, and TS concentrations were measured by the combustion method at 1000°C in a FISONS
elemen-tal analyzer EA 1108, after treatment to remove the car -bonate fraction. This treatment was performed by adding
1M HCl to the weighed sediment in Ag cups.
Results and discussion
Grain size and CNS (TOC, TN, and TS) elemental analysis
The median grain size of the bottom sediment in the study area is approximately 7.5–8.7 ϕ (Table 1). The mud content of all samples was greater than 76%, except in site TJ82 (Table 1).
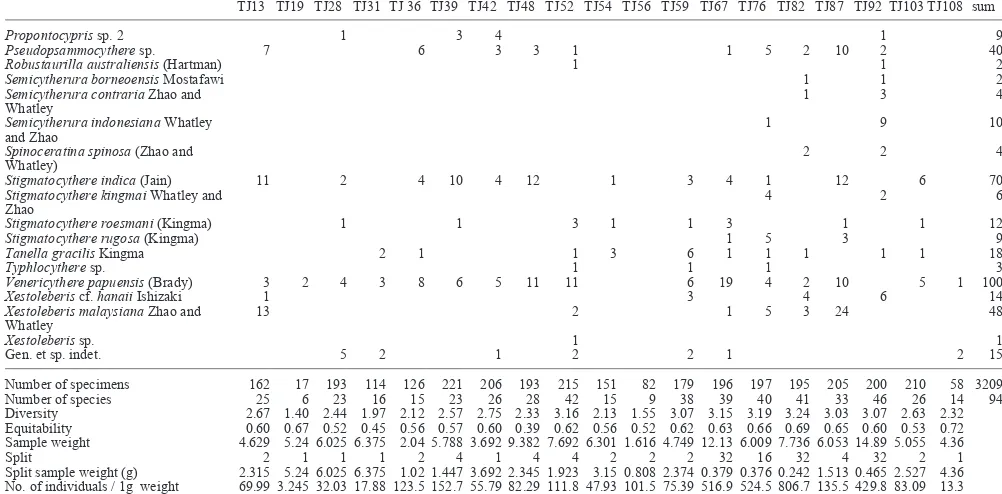
Table 2. Continued.
TJ13 TJ19 TJ28 TJ31 TJ 36 TJ39 TJ42 TJ48 TJ52 TJ54 TJ56 TJ59 TJ67 TJ76 TJ82 TJ87 TJ92 TJ103 TJ108 sum
Propontocypris sp. 2 1 3 4 1 9
Pseudopsammocythere sp. 7 6 3 3 1 1 5 2 10 2 40
Robustaurilla australiensis (Hartman) 1 1 2
Semicytherura borneoensis Mostafawi 1 1 2
Semicytherura contraria Zhao and
Whatley 1 3 4
Semicytherura indonesiana Whatley
and Zhao 1 9 10
Spinoceratina spinosa (Zhao and
Whatley) 2 2 4
Stigmatocythere indica (Jain) 11 2 4 10 4 12 1 3 4 1 12 6 70
Stigmatocythere kingmai Whatley and
Zhao 4 2 6
Stigmatocythere roesmani (Kingma) 1 1 3 1 1 3 1 1 12
Stigmatocythere rugosa (Kingma) 1 5 3 9
Tanella gracilis Kingma 2 1 1 3 6 1 1 1 1 1 18
Typhlocythere sp. 1 1 1 3
Venericythere papuensis (Brady) 3 2 4 3 8 6 5 11 11 6 19 4 2 10 5 1 100
Xestoleberis cf. hanaii Ishizaki 1 3 4 6 14
Xestoleberis malaysiana Zhao and
Whatley 13 2 1 5 3 24 48
Xestoleberis sp. 1 1
Gen. et sp. indet. 5 2 1 2 2 1 2 15
Number of specimens 162 17 193 114 126 221 206 193 215 151 82 179 196 197 195 205 200 210 58 3209
Number of species 25 6 23 16 15 23 26 28 42 15 9 38 39 40 41 33 46 26 14 94
Diversity 2.67 1.40 2.44 1.97 2.12 2.57 2.75 2.33 3.16 2.13 1.55 3.07 3.15 3.19 3.24 3.03 3.07 2.63 2.32
Equitability 0.60 0.67 0.52 0.45 0.56 0.57 0.60 0.39 0.62 0.56 0.52 0.62 0.63 0.66 0.69 0.65 0.60 0.53 0.72
Sample weight 4.629 5.24 6.025 6.375 2.04 5.788 3.692 9.382 7.692 6.301 1.616 4.749 12.13 6.009 7.736 6.053 14.89 5.055 4.36
Split 2 1 1 1 2 4 1 4 4 2 2 2 32 16 32 4 32 2 1
Split sample weight (g) 2.315 5.24 6.025 6.375 1.02 1.447 3.692 2.345 1.923 3.15 0.808 2.374 0.379 0.376 0.242 1.513 0.465 2.527 4.36
No. of individuals / 1g weight 69.99 3.245 32.03 17.88 123.5 152.7 55.79 82.29 111.8 47.93 101.5 75.39 516.9 524.5 806.7 135.5 429.8 83.09 13.3
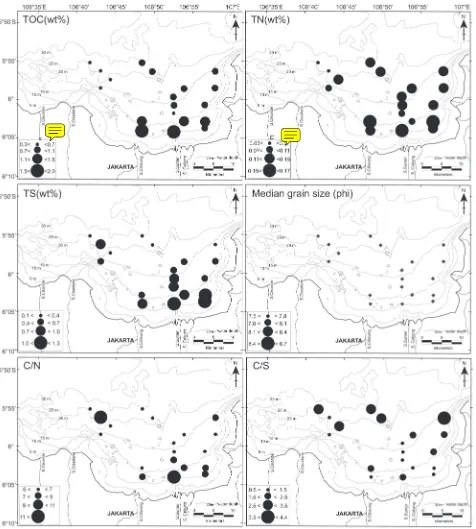
TOC and TN contents in the study area were 0.3–2.0 wt% and 0.04–0.17 wt%, respectively (Figure 2.1). TOC ranged from 0.9 to 2.0 wt% in the inner part of the bay at water depths of 10–16 m, and decreased to 0.3–0.9 wt% in the middle to the outer parts of the bay at water depths of 16–30 m (Figures 3.1, 4, Table 1). TN showed the same trend as TOC; the values were 0.13–0.17 wt% in the inner part of the bay and decreased to 0.05–0.14 wt% in the middle to the outer parts of the bay (Figures 3.2, 4, Table 1). TS values were low, ranging from 0.95 to 1.29 wt% in the inner part of the bay and decreasing to 0.11–0.84 wt% in the middle to the outer parts of the bay (Figures 3.3, 4, Table 1). Thus, TOC, TN, and TS
distri-butions generally showed the same proiles, decreasing
toward the outer part of the bay (Figure 4) and negatively correlated to water depth (Figure 3).
The weight ratio of TOC to TN (C/N ratio) ranged from 5.8 to 11.8 (Figure 2.3, Table 1). The C/N ratio has been used as a simple proxy to reconstruct the marine and land paleoenvironment. The C/N ratio in aquatic systems is formed by the mixing of autochthonous and terrestrial organic matter. Freshly deposited organic matter derived mainly from planktonic organisms has a C/N ratio of 6–9, while terrestrial vascular plants and their derivatives in sediments have C/N ratios of 15 or higher (Bordows-kiy, 1965a, 1965b; Prahl et al., 1980; Biggs et al., 1983; Ertel and Hedges, 1984; Post et al., 1985; Ertel et al., 1986; Hedges et al., 1986; Orem et al., 1991; Sampei and Matsumoto, 2001). Sediment fractions with differ-ent grain sizes have differdiffer-ent C/N ratios. The C/N ratios
of organic matter in ine-grained sediment fractions are
lower than those in coarse-grained sediment fractions (Figure 2.3), because coarse-grained sediment fractions contain a larger proportion of intact land-plant debris
than do ine-grained sediment fractions (Meyers, 1997). As TOC increases with TN, the nitrogen is mainly sup -plied by planktonic organic matter (Figure 2.1)
The weight ratio of TOC to TS (C/S ratio) ranged from 0.7 to 4.4 (Figure 3.4, Table 1). Plotting TS against TOC showed positive correlations (Figure 2.2). This suggests that TS content in this bay is indeed controlled by organ-ic matter concentration, whorgan-ich could decrease dissolved oxygen in the bottom water. Cross-plots of TOC and TS
for depositional environment observed in Figure 2 (Ber-ner and Raiswell, 1984) show that 80% of areas with TS and TOC <1 wt% have TOC/TS ratios ranging from 1 to 3, which overlap the ranges of TOC/TS ratios for a semi-closed brackish coastal lake and a normal marine area (Sampei et al., 1997).
Ostracode assemblages, biofacies, and their distribu-tion
All specimens sampled in this study were carapaces or valves of dead ostracodes. A 1- to 2- cm thick layer
of core-top sediment was used in our ostracode analy-sis. Most ostracode specimens were collected from very
ine silt or clayey samples, suggesting that there were
few transported valves. Thus, ostracode assemblages in the present study may be comparable to the within-habitat time-averaged assemblages of Kidwell (1991). Total ostracode density (total ostracode number per 1 g dry sediment) ranged between 3 and 807 (Table 2), with a minimum in sample TJ19 and a maximum in sample TJ82. The total ostracode density and species diversity (H(S): Shannon index) tended to increase toward the outer part of the bay, with increasing water depth, though there are some exceptions in shallow areas (Figure 5).
At least 94 ostracode species were identiied from 19
samples (Table 2). Most of them have been reported from
southeastern Asia (Brady, 1880; Kingma, 1948; Keij, 1954, 1964; Whatley and Zhao, 1987, 1988; Whatley and Watson, 1988; Zhao and Whatley, 1989; Mostafawi,
1992; Dewi, 1997; Mostafawi et al., 2005; Montenegro
et al., 2004; Tanaka et al., 2009, 2011). Especially they are most closely related to those from the west of Bawean Island, Java Sea, which belongs to the East Indian Prov-ince of Titterton and Whatley (1988) (Dewi, 1997). Ostracode preservation was moderate to good. Micro-graphs of 18 dominant species are shown in Figure 6.
Among the 94 species, four species individually exceed
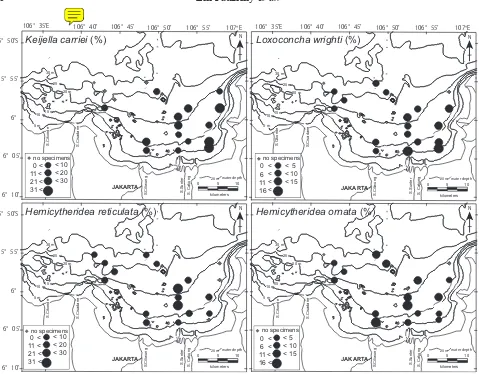
5% of the total number of specimens, and 23 species have 1–3% frequencies. The remaining species are each less than 1%. Figure 7 shows the spatial distribution of the frequency of the four dominant species.
The most abundant species was Keijella carriei Dewi, which comprised 13.6% of the total ostracodes sampled
➡
Figure 6. Scanning electron micrographs of the dominant species. (ALV: adult left valve, ARV: adult right valve, JRV: juvenile right
valve). 1, Keijella carriei Dewi, ALV, sample TJ31; 2, Hemicytheridea reticulata Kingma, ARV, sample TJ48; 3, Hemicytheridea ornata Mostafawi, ARV, sample TJ48; 4, Loxoconcha wrighti Dewi, ALV, sample TJ42; 5, Copytus posterosulcus Wang, ARV, sample J103; 6,
Venericythere papuensis (Brady), JLV, sample TJ67; 7, Pistocythereis cf. bradyformis (Ishizaki), ALV, sample J103; 8, Pistocythereis crib-riformis (Brady), ALV, sample TJ52; 9, Neomonoceratina rhomboidea (Brady), ARV, sample TJ 103; 10, Neomonoceratina iniqua (Brady), ALV, sample TJ67; 11, Keijia labyrinthica Whatley and Zhao, ARV, sample TJ92; 12, Cytherella javaseaense Dewi, JLV, sample TJ52; 13,
and was found in 15 out of 19 samples. Its density ranged from 0 to 47 individuals/g. Maximum density was found in sample TJ56, collected from the innermost part of the bay. This species is widespread at a water depth of less than 22 m, being abundant in the inner shallowest part and decreasing toward the outer part of the bay. It has been reported only from the Java Sea, west of Bawean Island, Indonesia (Dewi, 1997).
The second most abundant species was Hemicytheri-dea reticulata Kingma, which comprised 9.5% of the total ostracodes and was found in 16 out of 19 samples. Its density ranged from 0 to 70 individuals/g. Maximum density was found in sample TJ82, collected from the outer bay. This species is common in the Malay
Penin-sula (Zhao and Whatley, 1989).
The third most abundant species was Loxoconcha wrighti Dewi, which comprised 7.6% of the total ostra-codes and was found in 17 out of 19 samples. Its density
ranged from 0 to 22 individuals/g. Maximum density was found in sample TJ56, collected from the innermost part of the bay. It has so far only been found in the Java Sea (Dewi, 1997).
The fourth most abundant species was Hemicytheridea ornata Mostafawi, which comprised 7.5% of the total ostracodes and was found in 16 out of 19 samples. Its density ranged from 0 to 34 individuals/g. Maximum density was found in sample TJ67, collected from the outer part of the bay. This species is distributed in the Singapore Platform and the Java Sea (Dewi, 1997) and the Sunda Shelf (Mostafawi, 1992).
The remaining species individually fell below 4% of the total ostracodes. Species belonging to the genera
Cytherella, Cytherelloidea, Neomonoceratina, and Pis-tocythereis were also commonly observed. Neomonoc-eratina delicata Ishizaki and Kato, commonly found in
eastern Asian enclosed bays (Zhao and Wang, 1988; Iri
-20 mwater depth
JAKARTA 0
0 000000 55555555 0 555555555 101010101010101010
kilometers
N
S.Ciliwun
g
S.Sunter S. Cakung
5 m 20 m 15 m 25 m 10 m 30 m Borneo S.Cikond e S.Cisadane
20 mwater depth
JAKARTA 0
0 0 0 0000 55555555 0 555555555 101010101010101010
kilometers
N
S.Ciliwun
g
S.Sunter S. Cakung
5 m 20 m 15 m 25 m 10 m 30 m Borneo S.Cikond e S.Cisadane
20 mwater depth
JAKARTA 0
0 0 0 0000 55555555 0 555555555 101010101010101010
kilometers
N
S.Ciliwun
g
S.Sunter S. Cakung
5 m 20 m 15 m 25 m 10 m 30 m Borneo S.Cikond e S.Cisadane
20 mwater depth
JAKARTA 0
0 000000 55555555 0 555555555 101010101010101010
kilometers
N
S.Ciliwun
g
S.Sunter S. Cakung
5 m 20 m 15 m 25 m 10 m 30 m Borneo S.Cikond e S.Cisadane < 10 < 20 < 30 0 < 11 < 21 < 31 <
< 5 < 10 < 15 0 < 6 < 11 < 16 <
< 10 < 20 < 30 0 < 11 < 21 < 31 < < 5 < 10 < 15 0 < 6 < 11 < 16 <
Hemicytheridea ornata (%)
Hemicytheridea reticulata (%)
Loxoconcha wrighti (%)
Keijella carriei (%)
no specimens no specimens
no specimens no specimens
° °
zuki et al., 2009b, Tanaka et al., 2009), was also
identi-ied.
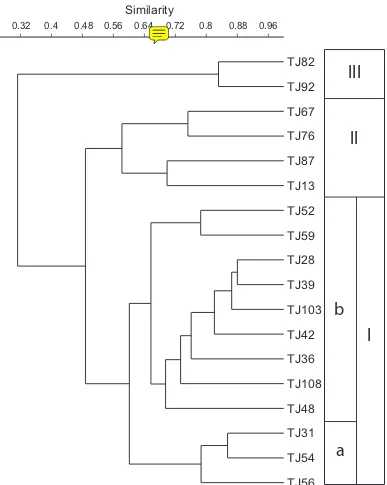
To clarify the spatial distribution patterns of ostracode assemblages, Q-mode cluster analysis was conducted. Fifty-eight species represented by more than three speci-mens in any of the samples were used in this analysis. Horn’s overlap index (Horn, 1966) was used as a
simi-larity index and clustering was made by the unweighted pair group method with arithmetic mean. The computer
program used for the analysis was PAST (Paleontologi -cal Statistics), which is designed for paleontologi-cal data (Hammer et al., 2001).
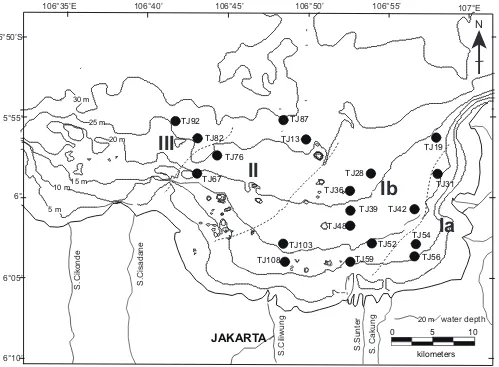
The results demonstrate that three biofacies (I, II, and
III) can be identiied (Figure 8), and that they are clearly
0.32 0.4 0.48 0.56 0.64 0.72 0.8 0.88 0.96
TJ82
TJ92
TJ67
TJ76
TJ87
TJ13
TJ52
TJ59
TJ28
TJ39
TJ103
TJ42
TJ36
TJ108
TJ48
TJ31
TJ54
TJ56
Similarity
I
a
b
II
III
distributed from the inner to the outer parts of the bay (Figure 9) as follows.
Biofacies I is divided into two subbiofacies (Ia and Ib). Subbiofacies Ia comprises three samples and is dis-tributed in the inner part of the bay at water depths of 11.0–16.5 m. The median grain size of the bottom sedi-ment ranges from 8.5 to 8.7 ϕ. The dominant species are
K. carriei and L. wrighti. Neomonoceratina rhomboidea
(Brady), Pistocythereis cf. bradyformis (Ishizaki), and
Propontocypris sp. 1 are common in this biofacies. Spe-cies diversity is the lowest among the biofaSpe-cies (H(S) =
1.6–2.1). Subbiofacies Ib comprises nine samples and is distributed in the middle part of the bay at water depths of 10.4–21.0 m. The median grain size of bottom sedi-ments ranges from 7.5 to 8.6 ϕ. The dominant species are
K. carriei, H. reticulata, L. wrighti, and H. ornata. P. cf.
bradyformis, Propontocypris sp. 1, Copytus
posterosul-cus Wang, N. rhomboidea, and Venericythere papuensis
(Brady) are common. Species diversity is low to high (H(S) = 2.1–3.2).
Biofacies II comprises four samples in the outer part of the bay. The grain size of bottom sediment ranges from 8.3 to 8.5 ϕ. The dominant species are K. carriei, H. reticulata, L. wrighti, and H. ornata. P. cf. bradyformis
is common. Species diversity is moderate to high (H(S)
= 2.69–3.24).
Biofacies III comprises two samples that are distrib-uted in the outermost part of Jakarta Bay. The grain size of bottom sediment ranges from 7.8 to 8.1 ϕ. It is characterized by high-diversity assemblages comprising
Parakrithella sp., Keijia labyrinthica Whatley and Zhao, Atjehella kingmai Keij, and Neomonoceratina bataviana
(Brady). Foveoleberis cypraeoides (Brady), Pistocy-thereis cribriformis (Brady), and Cytherelloidea
cingu-20 m water depth
JAKARTA
TJ67 TJ92
TJ82
TJ87
TJ108 TJ76
TJ13
TJ59 TJ103
TJ48 TJ39 TJ36
TJ52 TJ42 TJ28
TJ56 TJ54
TJ19
TJ31
0
0
0
0
0
0
0
0
5
5
5
5
5
5
5
5
0
5
5
5
5
5
5
55
5
10
10
10
10
10
10
10
10
10 kilometersN
S.Ciliwung S.Sunter S. Cakung
5 m
20 m
15 m 25 m
10 m 30 m
S.Cikonde S.Cisadane
III
II
Ib
Ia
106°35ʼE 106°40ʼ 106°45ʼ 106°50ʼ 106°55ʼ 107°E
5°50ʼS
6°05ʼ
6°10ʼ 5°55ʼ
6°
lata (Brady) are common. Species diversity is highest among three biofacies (H(S) = approximately 3.3).
Biofacies I, II, and III range in water depth from 10.4– 21.0 m, 19.6–29.7 m, and 24.8–29.1 m, respectively. Thus, biofacies I is characterized by near-shore shallow areas at a water depth of less than approximately 20 m, while biofacies II and III are characterized by off-shore
deeper areas under the inluence of open waters at a water
depth of more than approximately 20 m.
Relationship between dominant species, biofacies, and environmental factors
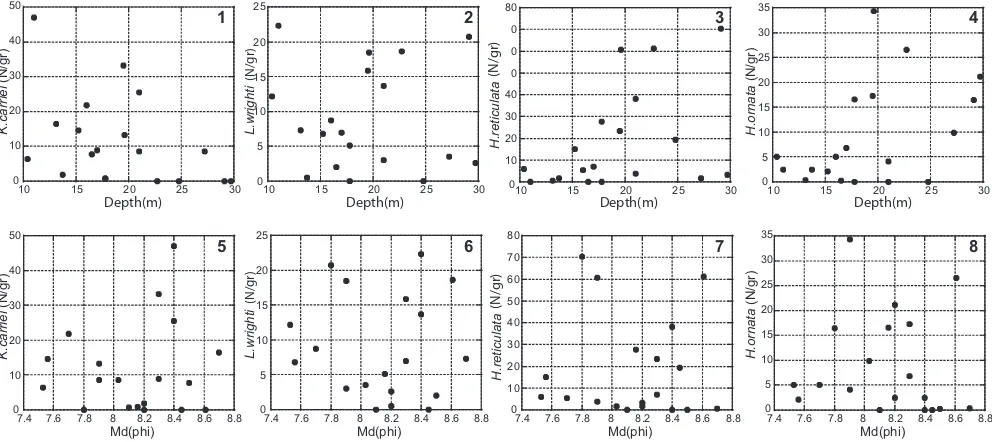
The dominant species in this bay are K. carriei, H. reticulata, L. wrighti, and H. ornata, in decreasing order. Figures 10 and 11 show the relationship between the dominant species and environmental factors, such as depth, median grain size, TOC, TN, TS, and C/S ratio.
The depth–density of dominant species plots show dif-ferent trends for each of the species (Figures 10.1–10.4). The density of K. carriei tends to be low in shallower water depths, but to range widely in deeper water depths (Figure 10.1), while H. reticulata and H. ornata are not abundant at water depths less than approximately 15 m (Figures 10.3, 10.4).
The median grain size–density of dominant species
plots did not show signiicant relationships because the
median grain sizes are essentially the same for all sites (Figures 10.5–10.8).
The plots for TOC–density of dominant species (Figures 11.1–11.4) and TN–density of dominant species (Figures
11.5–11.8) are similar. K. carriei can live even in high TOC and TN contents, although it may be inferred that optimal TOC and TN for K. carriei are approximately 1.0 and 0.13 wt%, respectively (Figures 11.1, 11.5). L. wrighti is also common even in highest TOC and TN contents (Figures 11.2, 11.6), while concentrations of H. reticulata and H. ornata decrease abruptly at more than 0.8 and 0.14 wt% in TOC and TN, respectively (Figures 11.3, 11.4, 11.7, 11.8). Thus, the latter two species prefer to live in lower TOC and TN contents.
TOC and TN contents in this area are parallel with the ostracode biofacies. In biofacies I, both values are mod-erate, while in biofacies II and III, they are low (Figures 4 and 9).
Measurements of the C/N ratio reveal two sources of organic matter in the study area: planktonic organisms with terrestrial organic matter in the inner part of the bay and mainly planktonic organisms in the outer part of the bay excluding the river mouth (Figure 4). This indicates that ostracodes thrive on nutrients derived from plankton.
Usually, the C/S ratio in sediment has been used to
distinguish between marine and freshwater environments and also between deposition from normal marine condi-tions (those underlying oxygenated bottom waters where sulfate reduction begins a few centimeters below the sediment/seawater interface) and from an anoxic
brack-ish water column (Berner and Raiswell, 1984). A reduc -tive environment (anoxia) has a C/S ratio <1 (Berner and Raiswell, 1984), while a dysoxic (oxygen-poor) envi-ronment has C/S ratios between 1 and 3 (Sampei et al.,
0 5 10 15 20 25 30 35
10 15 20 25 30
0 10 20 30 40 0 0 0 80
10 15 20 25 30
0 5 10 15 20 25
10 15 20 25 30
0 10 20 30 40 50
10 15 20 25 30
7.4 7.6 7.8 8 8.2 8.4 8.6 8.8
0 10 20 30 40 50
7.4 7.6 7.8 8 8.2 8.4 8.6 8.8
0 5 10 15 20 25
7.4 7.6 7.8 8 8.2 8.4 8.6 8.8
0 10 20 30 40 50 60 70 80
7.4 7.6 7.8 8 8.2 8.4 8.6 8.8
0 5 10 15 20 25 30 35 i eir r a c. K )r g/ N( i eir r a c. K )r g/ N( it h gir w. L )r g/ N( it h gir w. L )r g/ N( at al u cit er. H at a nr o. H )r g/ N( at a nr o. H )r g/ N(
1 2 3 4
5 6 7 8
Md(phi) Md(phi) Md(phi) Md(phi)
Depth(m) Depth(m) Depth(m) Depth(m)
(N/gr) at al u cit er. H (N/gr)
1997), and an oxidative environment has C/S ratios > 3 (Berner and Raiswell, 1984). Based on the C/S ratio, the study area is an oxygen-poor or anoxic bottom environ-ment, except for sites TJ19, TJ76, and TJ92, which are oxidative environments. The C/S ratio-density of
domi-nant species proiles did not show good correlations,
but peak density is present in the range of 0.5 to 1.5 C/S for all species (Figures 11.9–11.12), suggesting that the dominant species in this area develop better in anoxic to oxygen-poor environments. C/S ratio tends to increase toward deeper water (Figure 3.4), indicating that the deep bottom is more oxic than the shallow bottom in the bay.
The value of TOC and TN contents, C/S ratio, and density of K. carriei and L. wrighti in this area suggests that the substrate may have been impacted by river water
carrying household and industrial efluents. We conclude
that K. carriei and L. wrighti can be used as indicator species for organic-rich environments. On the basis of Q-mode cluster analysis, TOC content, and the C/S ratio, the distribution pattern of ostracodes in this area have
been demonstrated to be affected by organic matter con-centration/type, anoxic bottom conditions, water depth,
and terrestrial inlux.
Conclusions
1. A total of 94 ostracode species were identiied from
19 bottom surface samples from Jakarta Bay. The domi-nant species were Keijella carriei Dewi, Hemicytheri-dea reticulata Kingma, Loxoconcha wrighti Dewi, and
Hemicytheridea ornata Mostafawi.
2. Q-mode cluster analysis revealed three biofacies (I, II, and III).
3. K. carriei and L. wrighti are abundant in the eastern part of the bay, The density of K. carriei and L. wrighti
increases around the value 0.5–1.5 wt% of TOC and 1.0 of C/S ratio, showing that these two species are common in bottom environments with high organic matter concen-trations and low oxygen levels and are indicator species for organic-rich and anoxic-oxygen poor environments.
K.carriei (N/gr) K.carriei (N/gr) 0 5 10 15 20 25 30 35
0.5 1 1.5 2 2.5 3 3.5 4 4.5
H.ornata 0 10 20 30 40 50 60 70 80
0.5 1 1.5 2 2.5 3 3.5 4 4.5
H.reticulata 0 5 10 15 20 25
0.5 1 1.5 2 2.5 3 3.5 4 4.5
L.wrightii 0 10 20 30 40 50
0.5 1 1.5 2 2.5 3 3.5 4 4.5
K.carriei 0 5 10 15 20 25 30 35
0.04 0.06 0.08 0.1 0.12 0.14 0.16 0.18
0 10 20 30 40 50 60 70 80
0.04 0.06 0.08 0.1 0.12 0.14 0.16 0.18
0 5 10 15 20 25
0.04 0.06 0.08 0.1 0.12 0.14 0.16 0.18
0 10 20 30 40 50
0.04 0.06 0.08 0.1 0.12 0.14 0.16 0.18
0 5 10 15 20 25 30 35
0 0.5 1 1.5 2
0 10 20 30 40 50 60 70 80
0 0.5 1 1.5 2
0 5 10 15 20 25
0 0.5 1 1.5 2
0 10 20 30 40 50
0 0.5 1 1.5 2
i eir r a c. K )r g/ N( it h gir w. L )r g/ N( it h gir w. L )r g/ N( it h gir w. L )r g/ N( i eir r a c. K )r g/ N( i eir r a c. K )r g/ N( at al u cit er. H )r g/ N ( at al u cit er. H )r g/ N ( at al u cit er. H )r g/
N (
at a nr o. H )r g/ N( at a nr o. H )r g/ N( at a nr o. H )r g/ N(
1 2 3 4
5 6 7 8
9 10 11 12
TOC(wt%) TOC(wt%) TOC(wt%) TOC(wt%)
TN(wt%) TN(wt%) TN(wt%) TN(wt%)
C/S C/S C/S C/S
4. Density and diversity of the total ostracode spe-cies increases toward the outer bay with increasing water depth. However, the dominant species, K. carriei, decreases in density with increasing water depth.
Acknowledgments
We gratefully acknowledge the Marine Institute of Geology, Indonesia for providing core samples and the Directorate General of Higher Education, Ministry of
Education, Indonesia for inancial assistance to carry out
this study. Thanks are also due to Gengo Tanaka of the Gunma Museum of Natural History and an anonymous reviewer for their critical reviews of the manuscript and constructive suggestions.
References
Berner, R. A. and Raiswell, R., 1984: C/S method for distinguishing fresh water from marine sedimentary rocks. Geology, vol. 12, p. 365–368.
Biggs, R. B., Sharp, J. H., Church, T. M. and Tramontano, J. M., 1983: Optical properties, suspended sediments, and chemistry associ-ated with the turbidity maxima of the Delaware Estuary. Canadian Journal of Fisheries and Aquatic Sciences, vol. 40, p. 172–179. Bordowskiy, O. K., 1965a: Source of organic matter in marine basins.
Marine Geology, vol. 3, p. 5–31.
Bordowskiy, O. K., 1965b: Accumulation of organic matter in bottom sediments. Marine Geology, vol. 3, p. 33–82.
Brady, G. S., 1880: Report on the Ostracoda dredged by H.M.S. Chal-lenger during the years 1873-1876. Report on the Scientiic Results of the Voyage of H.M.S. Challenger, Zoology, vol. 1, p. 1–184. Dewi, K. T., 1997: Ostracoda from the Java Sea, west of Bawean Island
Indonesia. Marine Geological Institute, Special Publication, no. 4, 86 p. Ministry of Mines and Energy, Directorate General of Geolo-gy and Mineral Resources, Marine Geological Institute, Bandung. Ertel, J. R. and Hedges, J. I., 1984: The lignin component of humic sub-stances: Distribution among soil and sedimentary humic, fulvic, and base-insoluble fractions. Geochimica et Cosmochimica Acta, vol. 48, p. 2065–2074.
Ertel, J. R., Hedges, J. I., Devol, A. H. and Richey, J. E., 1986: Dis -solved humic substances of the Amazon River system. Limnology and Oceanography, vol. 31, p. 739–754.
Fachrul, M. F., Haeruman, H. and Sitepu, L. C., 2005: Komunitas ito -plankton sebagai bio-indikator kualitas perairan Teluk Jakarta.
Proceeding Seminar Nasional MIPA, p.17–23.
Hammer, Ø., Harper, D. A. T. and Ryan, P. D., 2001: PAST: Paleon -tological statistics software package for education and data analy-sis. Paleontologia Electronica, vol. 4, 9 p. Available from: http:// paleo-electronica.org/2001_11/past/issu_01.htm
Hedges, J. I., Clark, W. A., Quay, P. D., Richey, J. E., Devol, A. H. and Santos, U. de M., 1986: Compositions and luxes of particulate organic material in the Amazon River. Limnology and Oceanogra-phy, vol. 31, p. 717–738.
Horn, H. S., 1966: Measurement of overlap in comparative ecological studies. The American Naturalist, vol. 100, p. 419–424.
Ilahude, A. G., 1995: Sebaran suhu, salinitas, sigma-t, dan zat hara di perairan Teluk Jakarta. In, Atlas Oseanologi Teluk Jakarta, Pusat Penelitian dan Pengembangan Oseanologi- LIPI, 85 p., Jakarta. Ilahude, A. G. dan Liasaputra, 1978: Sebaran normal parameter
hidrologi di Teluk Jakarta in Pemonitoran Teluk Jakarta. Laporan no. 10 Pelayaran KM Samudra 17–20 Januari 1978, LON-LIPI, Jakarta, p. 6–42.
Irizuki, T., Gotomyo, A., Kawano, S., Yoshioka, K. and Nomura, R., 2009a: Relationships between Recent ostracode assemblage and environmental factors in the northern part of Harima-nada Bay off Aioi City, Hyogo Prefecture, Southwest Japan. Geoscience Reports of Shimane University, no. 28, p 1–9. (in Japanese with English abstract)
Irizuki, T., Ito, H., Yoshioka, K., Kawano, S., Nomura, R., Tanaka, Y. and Sako, M., 2010: Recent ostracode assemblages and the marine environment around Kasado Bay in northeastern Suo-nada Bay, Yamaguchi Prefecture, Southwest Japan. Geoscience Reports of Shimane University, no. 29, p. 11–20. (in Japanese with English abstract)
Irizuki, T., Takimoto, A., Sako, M., Nomura, R., Kakuno, K., Wanishi, A. and Kawano, S., 2011: The inluences of various anthropogen -ic sources of deterioration on meiobnethos (Ostracoda) over the last 100 years in Suo-Nada in Seto Inland Sea, southwest Japan.
Marine Pollution Bulletin, vol. 62, p. 2030–2041.
Irizuki, T., Taru, H., Taguchi, K. and Matsushima, Y., 2009b: Paleo -biogeographical implications of inner bay Ostracoda during the Late Pleistocene Shimosueyoshi transgression, central Japan, with signiicance of its migration and disappearance in eastern Asia. Palaeogeography, Palaeoclimatology, Palaeoecology, vol. 271, p. 316–328.
Keij, A. J., 1954: Some Recent Ostracoda of Manila (Philippines), Proceedings of the Koninklijke Nederlandse Akademie van Weten-schappen, Series B, vol. 56, p. 155–168.
Keij, A. J., 1964: Neogene to Recent species of Cytherelloidea (Ostra-coda) from northwestern Borneo, Micropaleontology, vol. 10, p. 415–430.
Kidwell, S. M., 1991: Taphonomy and time-averaging of marine shelly faunas. In, Allison, P. A. and Briggs, D. E. G., eds., Taphonomy. Releasing the Data Locked in the Fossil Record. p. 115–209. Plenum Press, New York and London.
Kingma, J. T., 1948: Contributions to the knowledge of the Young-Caenozoic Ostracoda from the Malayan region, 119 p. Kemink en Zoon, Utrecht.
Meyers, P. A., 1997: Organic geochemical proxies of paleoceano -graphic, paleolimnologic, and paleoclimatic processes. Organic Geochemistry, vol. 27, p. 213–250.
Montenegro, M. E., Pugliese, N. and Sciuto, F., 2004: Shallow water ostracods in front of Mae Khlong River mouth (NW Gulf of Thai-land): Bollettino della Società Paleontologica Italiana, vol. 43, p. 225–234.
Mostafawi, N., 1992: Rezente Ostacoden aus dem Mittleren Sunda-Schelf zwischen der Malaiischen Halbinsel und Borneo. Sencken-bergiana Lethaea, vol. 72, p. 129–168.
Mostafawi, N., Colin, J. P. and Babinot, J. F., 2005: An account on the taxonomy of ostracodes from recent reefal lat deposits in Bali, Indonesia. Revue de Micropaléontologie, vol. 48, p. 123–140. Nontji, A., 1987: Laut Nusantara, 368 p. Jembatan, Jakarta.
Orem, W. H., Burnett, W. C., Landing, W. M., Lyons, W. B. and Show-ers, W., 1991: Jellyish Lake, Palau: Early diagenesis of organic matter in sediments of an anoxic marine lake. Limnology and Oceanography, vol. 36, p. 526–543.
Post, W. M., Pastor, J., Zinke, P. J. and Stangenberger, A. G., 1985: Global patterns of soil nitrogen storage. Nature, vol. 317, p. 613– 616.
Cosmo-chimica Acta, vol. 44, p. 1967–1976.
Sampei, Y. and Matsumoto, E., 2001: C/N ratios in a sediment core from Nakaumi Lagoon, Southwest Japan-usefulness as an organic source indicator. Geochemical Journal, vol. 35, p. 189–205. Sampei, Y., Matsumoto. E., Kamei, T. and Tokuoka, T., 1997: Sulfur
and organic carbon relationship in sediment from coastal brack-ish lakes in the Shimane Peninsula district, Southwest Japan. Geo-chemical Journal, vol. 31, p. 245–262.
Tanaka, G., Komatsu, T. and Phong, N. D., 2009: Recent ostracod assemblages from the northeastern coast of Vietnam and biogeo-graphical signiicance of the euryhaline species, Micropalaeontol-ogy, vol. 55, p. 365–382.
Tanaka, G., Komatsu, T., Saito, Y. and Nguyen, D. C., Vu, Q. L., 2011: Temporal changes in ostracod assemblages during the past 10,000 years associated with the evolution of the Red River delta system, northeastern Vietnam. Marine Micropaleontology, vol. 81, p. 77–87.
Titterton, R. and Whatley, R. C., 1988: The provincial distribution of shallow water Indo-Paciic marine Ostracoda: origins, antiquity, dispersal routes and mechanisms. In, Hanai, T., Ikeya, N. and Ishizaki, K. eds., Evolutionary Biology of Ostracoda—Its Fun-damentals and Applications, Proceeding of the Ninth Interna-tional Symposium on Ostracoda, Shizuoka, p. 759–787. Kodansha, Tokyo, and Elsevier, Amsterdam.
van der Meij, S. E. T., Moolenbeek, R. G. and Hoeksema, B. W.,
2009: Decline of the Jakarta Bay molluscan fauna linked to human impact, Marine Pollution Bulletin, vol. 59, p. 101–107.
Whatley, R. C. and Watson, K., 1988: A preliminary account of the distribution of Ostracoda in Recent reef and reef associated envi-ronments in the Pulau Seribu or Thousand Island Group, Java Sea.
In, Hanai, T., Ikeya, N. and Ishizaki, K. eds., Evolutionary Biology of Ostracoda—Its Fundamentals and Applications, Proceeding of the Ninth International Symposium on Ostracoda, Shizuoka, p. 399–411. Kodansha, Tokyo, and Elsevier, Amsterdam.
Whatley, R. and Zhao, Q., 1987: Recent Ostracoda of the Malacca Straits Part I. RevistaEspañola de Micropaleontología, vol. 19, p. 327–366.
Whatley, R. and Zhao, Q., 1988: Recent Ostracoda of the Malacca Straits Part II. RevistaEspañola de Micropaleontología, vol. 20, p. 5–37.
Zhao, Q. and Wang, P., 1988: Distribution of modern Ostracoda in the shelf seas off China. In, Hanai, T., Ikeya, N. and Ishizaki, K.,
eds., Evolutionary Biology of Ostracoda—Its Fundamentals and Applications, Proceeding of the Ninth International Symposium on Ostracoda, Shizuoka, p. 805–821. Kodansha, Tokyo, and Elsevier, Amsterdam.