Phenological study on a tropical secondary forest in West
Sumatra, Indonesia
C
HAIRUL1, Tsuyoshi Y
ONEDA2,and Junko Y
AMAUCHI3Faculty of Mathematics and Sciences, Andalas University, Indonesia Faculty of Agriculture, Kagoshima University, Japan
Faculty of Education, Osaka Kyoiku University, Japan Corresponding author: E-mail: [email protected]
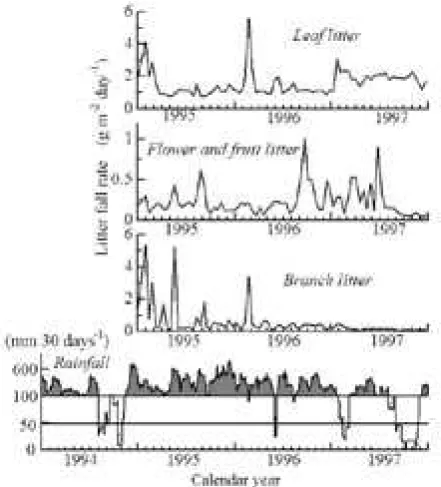
ABSTRACT We made litter fall observations in a West Sumatran tropical rain forest every 2 weeks through 3 years (including the drought year, 1997). Seasonal changes in long-term average rainfall were bimodal, but even in the two dry seasons average monthly precipitation was > 200 mm. Leaf-fall rates in a year with normal rainfall peaked in the first dry season; leaves made up one-third of mean annual litter fall. Larger trees had highly synchronized leaf fall during the peak shedding period. Smaller trees shed simultaneously during severe drought. Twigs < 0.5 cm diameter tended to fall in proportion to the 3/2 power of leaf-fall rates; therefore, we considered autonomous twig fall in relation to the pipe model theory. Variances in reproductive organ shedding rates (seasonal and annual) were larger than those of leaves and branches, possibly because of the higher susceptibility of reproductive parts to drought. Reproductive fall rates in the year with normal weather peaked in May (flowers) and August (fruits). Seasonal patterns of flowering and fr uiting were classified into three groups. Understor y species had an extended flowering pattern. We discuss phenological patterns found in this very high humidity climate and the impacts of increasingly frequent droughts.
Key words: Indian Ocean Dipole Mode, Sumatra, defoliation, drought weather, litter-fall, phenology, pipe model theor y, seasonal changes, a tropical secondary forest
Abbreviation
dbh : stem diameter at breast height
R: coefficient of determination
P : significance probability
N : number of samples
INTRODUCTION
Plant phenology in aseasonal climates is a topic of considerable ecological interest. Attempts have been made to determine the factors regulating obser ved patterns of plant development (Koriba, , ; Frankie et al. ; Whitmore, ; Richards, ). The high species diversity in tropical rain forests that occurs in aseasonal climates leads to complexity in the community-level phenological patterns expressed in processes of growth (Ng and Tang, ; Hatta and Darbaedu, ), regeneration (Medway, ; Sakai et al. ), and food-chain structure (Jansen, ; Schaik et al. ). Recent climate changes and increasing anthropogenic activities are risk factors in rain forests because they can disturb endogenous rhythms and discontinuities in phenological sequences (Corlet and Lafrankie, ; Turner, ).
Endogenous traits of wet tropical species are acquired characteristics that develop over the long term as populations expand and contract in response to unstable climate periodicity; the outcomes of these processes are successful regeneration mechanisms. Some species in a given community may have plastic responses to temporal shifts in climate (Valladares et al. ; Osada et al. ), whereas others do not (Williams, ), which often obscures the relationships between phenology and climatic factors.
have similar effects (Ashton et al. ; Yasuda et al. ; Sakai et al. ; Numata et al. ). Forest tree condition (e.g., size and preceding growth rate) is associated with susceptibility to drought (Yoneda et al. , ; Nakagawa et al. ). However, drivers of the overall drought–phenology relationship are still unresolved. Field experiments manipulating soil water conditions would certainly help to identify the cues for defoliation (Wright & Cornejo, , Wright, ).
The equatorial region of west Sumatra facing the Indian Ocean has a highly humid climate with average monthly rainfall > mm through the year (Hardjono, ; Laumonier, ). However, regional meteorological data for Padang, West Sumatra, demonstrate an increased frequency of severe drought (< mm cumulative rainfall in the preceding days) over the last years. These changes must have some impacts on plant phenology. Accordingly, we studied litter-fall rates in a tropical West Sumatran secondary forest at -week intervals through years from the beginning of December (Yoneda et al. ). This forest suffered severe drought during this period. We ( ) tracked seasonal changes in defoliation, branch fall, flowering, and fruiting, and ( ) evaluated impacts of drought on phenological behaviors at the levels of individuals, species, and community.
MATERIALS AND METHODS
Study site
The study was conducted within the School of Biology Forest, Andalas University, located km east of Padang City ( S, E), West Sumatra, Indonesia (Yoneda et al. ). Annual rain fall in long-term average rainfall between and at Tabing Airport, Padang, was mm with two dry seasons (January-February and June-August) and two rainy seasons, and average monthly fall still exceeded mm in these dry seasons (Fig. ). The secondary forest tract studied was on a sloping ridge at an altitude of m, and covered a ground area of . ha. The dimensions of the stand structure in were t ha- in aboveground biomass,
m ha- in basal area, and – m in canopy height.
There were families, genera, and species of trees with a diameter at breast height (dbh) > cm. Dominant families (expressed as relative dominance: basal area + a b u n d a n c e ) w e r e E u p h o r b i a c e a e , L a u r a c e a e , Melastomataceae, and Myrtaceae, and dominant genera were Ptenandra,Litsea, Bridelia, Macaranga, and Eurya. The stand suffered severe drought in , the year preceding obser vations, and in and . The
drought event in was the most severe (Fig. ).
Litter fall measurement
Litter samples were collected times from a forest stand of m m at -week intervals through years from the beginning of December ; there were litter traps, and trap contents were sorted into four categories, viz. leaves, branches, flowers–fruits, and miscellaneous components. Their oven-dry weights were measured. Seasonal and yearly changes in total weight in each category have been presented elsewhere (see Fig. of Yoneda et al. ).
Trapped leaves of trees (cf. Fig. ) directly above the traps were sorted by tree individual, and their oven-dr y weights were measured. Trees belonged to families, genera, and species. The total litter weight from these trees on each collection occasion was directly proportional to total litter mass in the traps deployed (N
= , R= . ).
recorded either the numbers of these organs in traps or their oven-dry weights. These nine species belonged to six families and seven genera; there were two unidentified species (Table ). Litter samples collected in in two fixed traps were sorted into flowers and fruits regardless of species, and we measured weights of these two categories. The total weight in these two traps was in direct proportion to the weights in the traps deployed (N = , R= . ).
Litter samples in the branches categor y were further sorted into three groups by their diameters (small, medium, and large branches of < . cm, . – . cm, and > . cm diameter, respectively) and their weights were measured.
Classification of seasonal patterns of leaf-fall rates by cluster analysis
Mass defoliations of trees were identified by rates of leaf fall exceeding an average value plus one standard deviation for individuals over the whole -year study period. We assigned a score of or to each collection date on which mass defoliation occurred or not, and the trees under observation were classified by cluster analysis using Ward s method (SPSS Ver. ); the clustering procedure was based on the similarity of seasonal patterns in these scores because of serious consideration of the period without intensity of mass defoliation.
RESULTS
Synchrony of mass defoliation
Three clusters (A, B, C) were recognized at a value of
Table 1. Tree species for which we estimated shedding rates of flowers and fruits. There were 33 individuals belonging to nine species.
Family Species Number of trees
Flowers Fruits Total
Euphorbiaceae Macaranga javanica M.A.
Lauraceae Percea sp.
Lauraceae. Litsea spp.
Myrtaceae Eugenia cf filiformis Wall. Melastomataceae Ptenandra cordata (Korth.) Baill. Malvaceae Commersonia bartramia (L.) Merr.
Theaceae Eurya acuminata DC.
Unidentified Sp.
Unidentified Sp.
Total
on the coordinate scale of similarity; these three clusters were further classified into two clusters with values of –
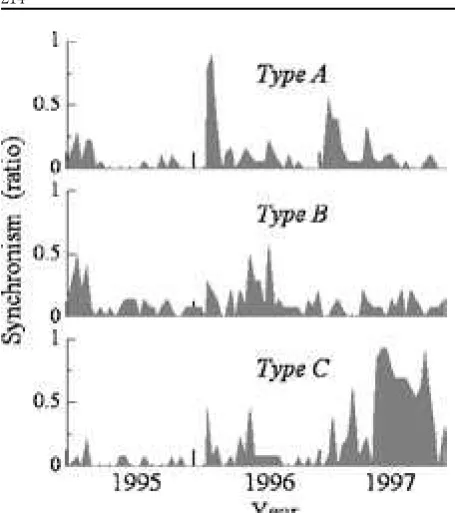
on the coordinate scale of similarity (Fig. ). The clusters did not reflect taxonomy or ecological similarity. Figure plots time trends in the synchrony of mass defoliation in three clusters, A, B, and C. Synchrony was measured for the ratio of the number of mass defoliating
trees to the total number of trees on each observation date. Cluster A was characterized by high synchrony, particularly in the first quarters of and . Cluster C had high synchrony ratios in the latter half of under severe drought conditions. Two high ratios for cluster C ( . in June and . in Mach ) occurred at the ends of the droughts in each year (Fig. ). Cluster B had no marked synchronies except for high ratios (each . ) in early and mid- . These synchronies corresponded in time with those of Cluster A in the first quarter of and that in Cluster C in June
.
We compared synchronies at lower levels in the cluster hierarchy with those at higher levels (Fig. ). Clusters A and C had synchronies (which were characteristic of clusters A and C) that were more pronounced than those of A and C . There were no clear differences between B and B , however.
The dbh varied significantly (P < . ) among three clusters, but growth rates and stem hardness were not significantly different among these groups (Table ). Lower in the cluster hierarchy (Fig. ), dbh varied more among groups (P = . – . , t-test), than the other two parameters (P = . – . ). dbh values of clusters A and C were the largest and smallest among the six clusters, respectively. Hence, tree size could be a major correlate of seasonal patterns of mass defoliation at the community level.
Seasonal changes in fall rates of flowers and fruits Fall rates of total reproductive organs followed no Fig. 3. Synchrony trends in mass defoliation of
trees within three clusters (A, B, and C). Synchrony was measured for the ratio of the number of mass flowering trees to the total number of trees on each observation date.
Table 2. General traits of groups extracted by cluster analysis (Fig.2). Symbols Dbh , ∆D - . and Hd are
average dbh in 1994, dbh increment through 3 years, and stem hardness, respectively (Yoneda et al., 2009). Bold numerals indicate significant differences (t-test: P < 0.05) between values with the same superscript letters.
Cluster
Number of
Dbh
D
-Hd
trees
(cm)
(cm period
-)
(kg f cm
-)
A
23 13
**ab.
.
B
15 10
*b.
.
C
11 10
**a.
.
.
A
.
.
.
.
A
.
.
B
.
.
.
B
.
.
.
C
.
.
.
.
.
C
.
.
.
particular seasonal trends through the -year study period (Fig. ). However, there were high rates in the months following August , and increased shedding correlated with severe dry weather in mid- and early
(Yoneda et al. ).
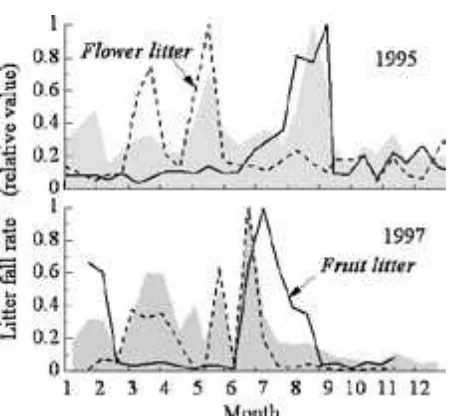
When we examined seasonal changes in flower and fruit falls separately in sorted samples of nine species in , we found two peaks in flower-fall rates and a single autumn peak in fruit fall (Fig. ). The highest flower-fall peak occurred in May, when the absolute rate was more than six-fold higher than that for fruit fall. The fruit-fall rate peaked in August when it was double the flower-fall rate. These results suggest that flower fall was largely responsible for the first peak in the community rate of total reproductive organ shedding in May (Fig. ), whereas fruits were responsible for the second peak in August.
Flower shedding rates were high during the first months of , reaching a maximum in June, and were double the rate of fruit fall during a period of mast fruiting (Fig. ). Because of the high levels of seasonal synchrony in flower shedding among nine species and in total reproductive organ falls in the traps, large variances in total reproductive organ data in can be attributed to flower falls (except for a small spike in January, which corresponded well with high rates of fruit fall; Fig. ).
Based on the frequencies of mass flowering and fruiting in , the nine species under observation may be classified into three groups. Five (Litsea sp., unidentified Sp. , Macaranga javanica, Persea sp., and
Eugenia cf filiformis) peaked once annually, and their flowering periods were different from one another (Fig. ). T wo species of Commersonia bar tramia and unidentified Sp. tended to peak twice a year, although they produced reproductive organs to a certain extent throughout the year. Two undergrowth species, Eurya acuminate and Ptenandracordata,had constant fall rates throughout the year.
Seasonal changes in branch-fall rates.
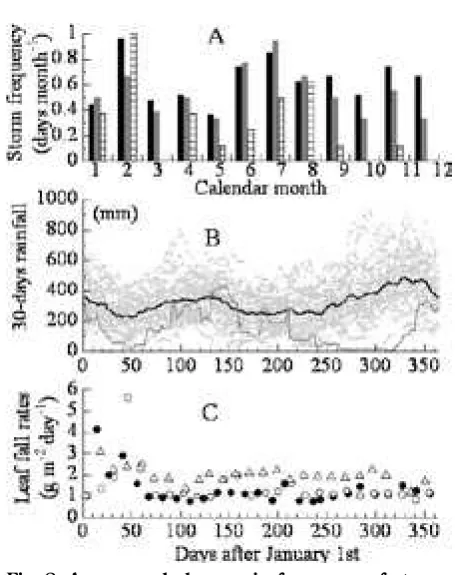
Branch-fall rates were high in January and February during the first years, and greatly decreased in , in clear contrast to the concurrent increase in defoliation rates (Fig. ). The proportions of small, medium, and large branches in total branch litter-fall rates were %, %, and %, respectively. High rates in the initial months of were attributable to large and small branches, and a high rate in May resulted from a localized large branch fall into two neighboring traps. High fall rates in February of and occurred when storm winds exceeded m s-.
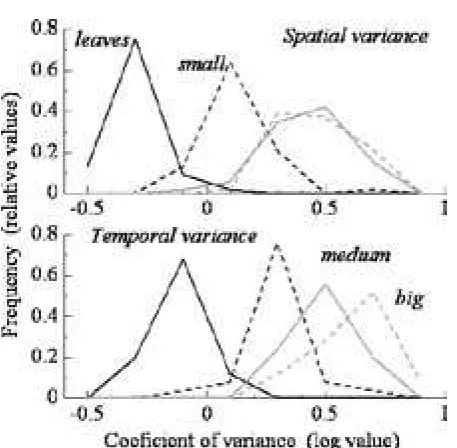
We examined spatial and temporal variances of these fall rates using data for traps in a m m area; biweekly samples were collected during the first years Fig. 4. Seasonal trends in the fall rates for flowers
(broken lines) and fr uits (solid lines). Rates in 1995 were computed across nine species. Rates in 1997 were for two fixed traps. Filled gray line plots show time trends for all reproductive organ litter collected in 25 traps.
before the drought year of . Coefficients of variance tended toward log-normal distribution patterns, and this was also the case for leaf litter CVs (Fig. ). The ratios for their geometric means were . : . : . : . (leaf : small branch : medium branch : large branch) for temporal variances, and . : . : . : . for spatial variances, respectively.
Average fall rates of branch litter (y) into traps at each collection time were positively correlated with those of leaf litter (x) over space and time; during the initial
years, the data fit an approximately straight line on log– log coordinates (Table ). Branch-fall rates in were clearly lower than in the two preceding years in consideration of the correlation(Fig. ). When we adopted the logarithmic regression model (i.e. log y = a log x + b) for the small branch–leaf relationship, the parameter a
(slope of the regression line) was . . Average fall rates in each trap and leaf-fall rates during the initial years displayed similar relationships in their spatial correlations. The regression parameters a and b of the logarithmic regression models for small and medium branch litters were almost identical for both temporal and spatial correlations (Table )
DISCUSSION
Seasonal changes in long-term average rainfall between and were bimodal in the Padang region, with two dry seasons (January-February and June–August) and two rainy seasons; average monthly fall still exceeded mm in these dr y seasons (Fig. ). The first dr y season resulted from a dry monsoon from the Asian mainland; it was short but more severe (Gong and Ong, ; Schaik, ; Wakatsuki, ) than the second dry season, which resulted from an Australian deser t monsoon (Hardjno, ). Strong winds > m s- were
frequent throughout these two dry seasons (Fig. ), and storms in the first dry period often inflicted extensive damage in the Padang forest (Hardjno, ; Yoneda et al. ). The inter-annual event driven by the Indian Ocean Dipole Mode (IODM) caused severe dry weather, Fig. 6. Frequency distributions of coef ficients of
variance for leaf litter and branch-fall rates in space (50 m 50 m) and time (3 years at 2-week intervals).
Table 3. Correlations between leaf-fall rates and branch-fall rates over time and space. Symbols x, y, a, b, N, R , and P are the fall rates of leaves (x, g m- day-) and branches (y, g m- day-), regression constants
(a, b), the number of samples, the coefficient of determination, and significance probability, respectively.
Category of branch litter
y = a x + b log y = a log x + b
N a b R P N a b R P
temporal correlation
total . - . . . . - . . .
small . - . . . . - . . .
medium . - . . . . - . . .
big . . . - . . .
spatial correlation
total . - . . . . - . . .
small . - . . . . - . . .
medium . - . . . . - . . .
e.g., in and (Hamada et al. ); the effects of the El Niño-Southern Oscillation were reduced in this west coast region in the lee of the Barisan mountains (Wick and Schaik, ). These severe drought weather conditions have tended to increase in frequency since the middle of the s (Yoneda et al. ). Such large-scale climatic phenomena very likely affected the phenological behavior of individual trees and the communities of which they are part.
Major community-level leaf fall occurred in the first dry season, followed by a minor fall in the second. Similar phenomena have been observed in the Asian aseasonal tropics (Corlett and Lafrankie, ) and also in the neotropics (Frankie et al. ). The forest we studied is characterized by relatively high fall rates with low variances across seasons, except during the initial months of the year when leaf fall accounted for one-third of the annual total ( and under normal weather conditions).
Cluster analysis suggested that the initial high rates of leaf fall were attributable to larger trees, irrespective of their growth rates and stem hardnesses (a parameter of the tree guild; Yoneda et al. ( )). The high synchrony among larger trees likely resulted from their elevated
susceptibility to drought, due to an active metabolism required to support a large leaf biomass (Yoneda et al. ) and high leaf turnover (Osada et al. ); however, Williams ( ) stressed an endogenous explanation rather than physiological responses to external triggers. New leaf flush in the overstor y occur red almost concurrently with leaf fall, as in other wet tropical forests (Frankie et al. ; Schaik, ; Osada et al. ). In , trees continued defoliating at high rates in the latter half of the year with no new leaf flushing, and many large trees were extensively defoliated by the end of drought in November (Yoneda et al. ).
Understory trees may have endogenous control of their phenologies (Wong, ) because of their low drought susceptibility; high synchronized leaf fall occurred only under the most severe dry conditions, such as the second dry seasons in and . The diverse phenological behaviors of understory trees may Fig. 7. Correlations between logarithmic values of
leaf-fall and branch-fall rates (g m-2 day-1)
over time. Left panel: relationship between twig and leaf rates. Open and closed circles are values before and during 1997, respectively. Two straight lines with positive slopes are regressions from temporal (solid line) and spatial (broken line) correlations, respectively (Table 3). Right panel: relationship between total branch and leaf rates. Open and closed circles refer to our study site and Pasoh Forest Reser ve in peninsular Malaysia (Ogawa, 1978), respectively. The straight line in the right panel is a regression plot of data collected in this study (temporal correlation, Table 3).
Fig. 8. A: seasonal changes in frequency of storms with winds > 13 m s-1 in Padang, West
explain low variances in community-level seasonal leaf-fall patterns during normal weather.
Fall rates of small branch litter (< . cm diameter) mass and leaf litter mass had linear relationships (temporally and spatially) on log–log coordinate plots (Fig. ). The slope of the regression line was close to . ( / ). If branch weight is proportional to the third power of its diameter, the relationship shows that the leaf-fall rate is proportional to the second power of the maximum diameter of a fallen branch. This relationship fits the pipe-model theory (Shinozaki et al. a, b), which shows that forest trees drop their small branches in proportion to the amount of fallen leaves. The average turnover time of small branches (estimated from the ratio of the frequency distributions of diameters of newly fallen branches to living branches) is years (Yoneda et al. ). When the canopy structure is under dynamic equilibrium conditions, % ( / ) of small branches fall each year. Branch-fall rates in the drought year were apparently low in relation to leaf-fall rates. The difference suggests influences other than drought stress. Strong wind in the dry seasons might be one of the proximate factors (Fig. -A). When we examined a relationship between fall rates of leaves and one of total branches in a lowland tropical forest within the Pasoh Forest Reserve (peninsular Malaysia) (Ogawa, ), we found no significant difference from that of the present study site (Fig. , ANOVA, P = . ). This suggests that a similar turnover mechanism operates in Pasoh.
Variances in the fall rates of large branches were larger than those of small branches, both temporally and spatially. Large branches were responsible for high rates in the initial few months in . Protracted severe dry weather in the preceding year ( ) may have been a major influence. If this were the case, high fall rates would be predicted for , following severe dry weather in . Tree mortality in this region has increased since the mid- s (Yoneda et al. ), and we expect these internal changes in stand structure to have large effects on the multi-species forest community.
Variances in the community-level fall rates of reproductive organs were larger than those for leaves, both seasonally and annually (Fig. ). In , there was one peak in May (flowers) and another in August (fruits). The following year had one conspicuous peak in September following a short spell of severe dry weather in May. The major reproductive component in could be estimated to be flowers, followed by a peak of fruit fall in the following December–January (Fig. ). In the dry year of , there was a type of mast flowering from
March to July, but there was no subsequent mast fruiting under the severe dry weather that lasted until November. These phenomena suggest the high susceptibility of reproductive organs to drought.
The seasonal patterns obser ved in under normal weather conditions are typical of Asian aseasonal tropics, with a single peak in flowering after the initial dry season and a single peak in fruiting – months later (Medway, ; van Schaik, ; Corlett and Lanfrankii, ). Flowering patterns in and indicate that drought was probably a reproductive cue. Why does the first dry season in a normal-weather year (rather than the second) trigger the sequence of defoliation triggering the flushing of new leaves, which leads to flowering? Van Schaik s ( ) hypothesis considers, and suggests that ( ) elevated pollination efficiency through the synchrony of flowering and pollinator activities, and ( ) survival ratios of seedlings through successive seasonal changes, are of greatest importance in the expression of plant phenology in the wet tropics.
Frankie et al. ( ) classified flowering into two patterns, viz. seasonal flowering with blooms in one season and extended flowering over two or more consecutive seasons. Five species of our study bloomed once a year and are seasonal flowering species (sensu
Frankie et al. ), and two species with flowers throughout the year are extended flowering species. Many species in secondar y forests or forest fringe habitats are in the continuous-flowering group (Whitmore, ). Eurya acuminate and Ptenandra cordata were dominant understory species in the stand we studied. Their continuous seed production and high sprouting ability would be advantageous in sites suffering frequent disturbance. Commersonia bar tramia is an early successional species that bloomed twice a year, as did Sp. , although it was classified as a continuous bloomer by Whitmore ( ). Further observations are necessary to determine the flowering types of these two species, and, indeed, to determine flowering traits of the forest as a whole.
Grants-in-Aid for Overseas Scientific Surveys ( - ) and the Nature Conservation Society of Japan and the Pro-Natura Foundation ( ).
REFERENCES
Appanah, S. . General flowering in the climax rain forests of South-East Asia. Journal of Tropical Ecology, 1: - .
Ashton, P.S., TGivinish, T.J. & Appanah, S. . Staggered flowering in the Dipterocarpaceae: new insights into floral induction and the evolution of mast fruiting in the aseasonal tropics. American Naturalist, 132: - .
Burges, P.E. . Studies on the regeneration of the hill forests of the Malay Peninsula. Malayan Forester,
35: - .
Corlett, R.Y. & Lanfrankie Jr. J.V. . Potential impacts of climate change on tropical Asian forests through an influence of phenology. Climatic Change, 39:
- .
Frankie, G.W., Baker H.G. & Opler, P.A. . Comparative phenological studies of trees in tropical wet and dry forests in the lowlands of Costa Rica.
Journal of Ecology, 62: - .
Gong, Q.-K. & Ong, J.-E. . Litter production and decomposition in a coastal hill dipterocarp forest. In:
Tropical Rain Forest: Ecology and Management (eds. Sutton, S.L., T.C.Whitmore & A.C. Chadwick) - , Blackwell, Oxford. Hamada , J., Yamanaka, M.D., Mori, S., Tauhid, Y.I. & Sribimawati, T. . Dif ferences of rainfall characteristics between coastal and interior areas of central western Sumatra, Indonesia. Journal of the Meteorological Society of Japan, 86: - .
Hardjono, L. . Indonesia; Land and People. P.T Gunung Agung, Jakarta, pp.
Hatta, H. & Darbaedu, D. . Phenology and Growth Habitats of Tropical Trees (eds.) National Science Museum Monographs 30, National Science Museum, Tokyo, pp.
Janzen, D.H. . Tropical blackwater rivers, animals, and mast fr uiting by the Dipterocarpaceae.
Biotropica, 6: - .
Koriba, K. . On the periodicity of tree growth in Malaya, particularly Singapore, part ( ). Physiology & Ecology (Japan), 1: - . (in Japanese)
Koriba,K. . On the periodicity of tree-growth in the tropics, with reference to the mode of branching, the leaf-fall, and the formation of the resting bud.
Laumonier, Y. . The Vegetation and Physiography of Sumatra. Kluwer Academic Publishers. The Netherlands. pp.
Medway, L. . Phenology of a tropical rain forest in Malaya. Biological Journal of the Linnean Society, 4:
- .
Nakagawa, M., Tanaka,K., Nakashizuka, T., Ohkubo, T., Kato, T.,. Maeda, T., Sato, K., Miguchi, H., Nagamasu, H., Ogino, K., Teo, S., Hamid, A.A. & Seng, L.H. . Impact of severe drought associated with the - El Nino in a tropical forest in Sarawak. Journal of Tropical Ecology, 16:
- .
Ng, F.S.P. & Tang, H.T. . Comparative growth rates of Malaysian trees. Malayan Forester, 37: - .
Numata, S., Yasuda, M., Okuda, T., Kachi, N. & Md. Noor, N.S. . Temporal and spatial patterns of mass flowerings on the Malay Peninsula. American Journal of Botany 90: - .
Ogawa, H. . Litter production and carbon cycling in Pasoh forest. The Malayan Nature Journal,30:
- .
Osada, N., Takeda, H., Furukawa, A. & Awang, M. . Leaf dynamics and maintenance of tree crowns in a Malaysian rain forest stand. Journal of Ecology, 89:
- .
Osada, N., Takeda, H., Furukawa, A. & Awang, M. . Ontogenetic changes in leaf phenology of a canopy species, Elateriospermum tapos (Euphorbiaceae), in a Malaysian rain forest. Journal of Tropical Ecology,
18: - .
Richards, P.W. . The tropical rain forest; An ecological study. Cambridge University Press ( n d ed.),
Cambridge, pp.
Sakai, S., Momose, K., Yumoto, T., Nagamitsu, T., Nagamasu, H., Hamid, A.A. & Nakashizuka, T. . Plant reproductive phenology over four years including an episode of general flowering in a lowland dipterocarp forest, Sarawak, Malaysia.
American Journal of Botany, 86: - .
Schaik, C.P. Van . Phenological changes in a Sumatran rain forest. Journal of Tropical Ecology, 2:
- .
Schaik, C.P. Van, Terborgh, J.W. & Wright, S.J. . The phenology of tropical forests: Adaptive Significance and consequences for primary consumers. Annual Review of Ecology and Systematics, 24: - . Shinozaki, K., Yoda, K., Hozumi, K. & Kira, T. a. A
theory I. Japanese Journal of Ecology, 14: - . Shinozaki, K., Yoda, K., Hozumi, K. & Kira, T. b. A
quantitative analysis of plant form – the pipe model theory II. Japanese Journal of Ecology, 14: - . Turner, I.M. . Species loss in fragments of tropical
rain forest: a review of the evidence. Journal of Applied Ecology, 33: - .
Valladares, F., Wright, S.J., Lasso, E., Kitajima, K. & Pearcy, R.W. . Plastic phenotypic response to light of congeneric shrubs from a Panamanian rainforest. Ecology, 81: - .
Wakatsuki,T., Saidi, A. & Rasydin, A. . Soils in the toposequeuence of the Gadut tropical rain forest, West Sumatra. Southeastern Asian Studies, 24:
- .
Whitmore, T.C. . Tropical Rain Forests of the Far East. Clarendron Press ( nd ed.), Oxford, pp.
Wick, S.A. & Schaik, C.P. Van . The impact of El Nino on mast fruiting in Sumatra and elsewhere in Malesia. Journal of Tropical Ecology, 16: - . Williams, R.J. . Leaf phenology of woody species in a
north Australian tropical savanna. Ecology,78:
- .
Wong, M. . Understory phenology of the virgin and regenerating habitats in Pasoh Forest Reser ve.
Malayan Forester, 46: - .
Wright, S.J. . Seasonal drought and the phenology of understory shrubs in a tropical moist forest. Ecology,
72: - .
Wright, S.J. & Cornejo, F.H. . Seasonal drought and leaf fall in a tropical forest. Ecology, 7: - . Yamada, I. . Tropical rain forests of Southeast Asia: A
forest ecologist s view (translated by P. Hawkers). University of Hawaii Press, Honolulu, pp. Yasuda, M., Matsumoto, J., Osada, N., Ichikawa, S.,
Kachi, N., Tani, M., Okuda, T., Furukawa A., Nik, A.R. & Manokaran, N. . The mechanism of general flowering in Dipterocarpaceae in the Malay Peninsula. Journal of Tropical Ecology, 15: - . Yoneda, T. . Turnover of live and dead woody organs
in forest ecosystems; An assessment based on the changes in the frequency distribution of their diameter. Japanese Journal of Ecology, 32: - . Yoneda, T., Nishimura, S. & Chairul. . Impacts of dry
and hazy weather in on a tropical rainforest ecosystem in West Sumatra, Indonesia. Ecological Research, 15: - .
Yoneda, T., Nishimura, S. & Fujii, S. . Storm impact on an equatorial rain forest in West Sumatra, Indonesia. In The Asian Hornbills: Ecology and
Conservation (ed. Poonswad, P.) Thai Studies in Biodiversity, 2: - .
Yoneda,T., Mizunaga, H., Nishimura, S., Fujii, S., Mukhtar, E., Hotta, M. & Ogino, K. . Impacts of recent dr y weather on a tropical rain forest in Sumatra with special reference to stand dynamics during the last two decades. Tropics, 15: - . Yoneda, T., Nishimura, S., Fujii, S. & Mukhtar, E. .
Tree guild composition of a hill dipterocarp forest in West Sumatra, Indonesia. Tropics, 18: - .
Received th Aug.