IOP Conference Series: Earth and Environmental Science
PAPER • OPEN ACCESS
Dynamic model of forest area on flood zone of
Padang City, West Sumatra Province-Indonesia
To cite this article: Indang Dewata and U Iswandi 2018 IOP Conf. Ser.: Earth Environ. Sci.149
012010
View the article online for updates and enhancements.
Related content
Early Warning System of Flood Disaster Based on Ultrasonic Sensors and Wireless Technology
W Indrasari, B H Iswanto and M Andayani
-Disaster mitigation at drainage basin of Kuranji Padang City
L Utama and M Yamin
-Flood Scenario Simulation and Disaster Estimation of Ba-Ma Creek Watershed in Nantou County, Taiwan
S H Peng and Y K Hsu
1234567890 ‘’“”
LISAT 2017 IOP Publishing
IOP Conf. Series: Earth and Environmental Science 149 (2018) 012010 doi :10.1088/1755-1315/149/1/012010
Dynamic model of forest area on flood zone of Padang City,
West Sumatra Province-Indonesia
Indang Dewata1, Iswandi U2
1Departement of Environmental Science, State University of Padang
2Department of Geography, Faculty of Social Science, State University of Padang
Email : [email protected]
Abstract. The flood disaster has caused many harm to human life, and the change of watershed characteristic is one of the factors causing the flood disaster. The increase of deforestation due to the increase of water causes the occurrence of flood disaster in the rainy season. The research objective was to develop a dynamic model of forest on flood hazard zone using powersim 10.1. In model development, there are three scenarios: optimistic, moderate, and pessimistic. The study shows that in Padang there are about 13 percent of high flood hazard zones. Deforestation of 4.5 percent/year is one cause that may increased the flooding intensity in Padang. There will be 14 percent of total forest area when management policy of forest absence in 2050.
1. Introduction
Indonesia is a wet tropical climate country with relatively high rainfall intensity throughout the year. The high intensity of rainfall caused flood disaster in many regions in Indonesia [1]. The factors causing the flood that the high bulk factor or the decreasing factor of forest area in the upstream river [2]. Furthermore, changes in land use to built up area will increase the rate of surface water and reduced water absorption causing an increasingly wide area of flood risk [3-5].
That there are three factors causing the occurrence of flood disasters: meteorological factors, factors of watershed characteristics, and human factors. Meteorological factors that cause the occurrence of floods that rainfall intensity and distribution of rainfall. There is great opportunity of flood disaster in high rainfall intensity area. Other than that watershed characteristics including slope, altitude, landform, and soil type contribute to the occurrence of floods. Furthermore, human behavior is an important factor for the occurrence of flood disasters. Forest encroachment and land cover change into built up area is a driving factor for flood disaster [6].
The human factor is the big role in causing flood. Increasing deforestation and conversion of forest areas into other uses as well as improper in land use are factors causing the expansion of floods [5]. Mudelsee et al. (2003) explains that the impact of deforestation on climate change globally accelerate with hydrological cycle. With the acceleration of the hydrologic cycle resulted in the emergence of flood disasters [7].
2
1234567890 ‘’“”
LISAT 2017 IOP Publishing
IOP Conf. Series: Earth and Environmental Science 149 (2018) 012010 doi :10.1088/1755-1315/149/1/012010
2. Research Method
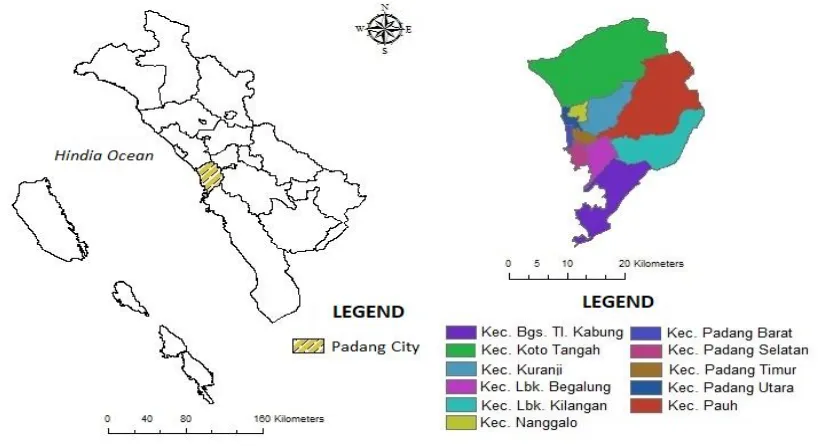
This research was conducted in Padang City, West Sumatera Province of Indonesia. Geographically, the research area is located on 1000 05' 05"-1000 34' 09" E and 00 44' 00"-10 08' 35" S with research area of 69.496 ha. The location of the study is presented in Figure 1.
Figure 1. Location of research.
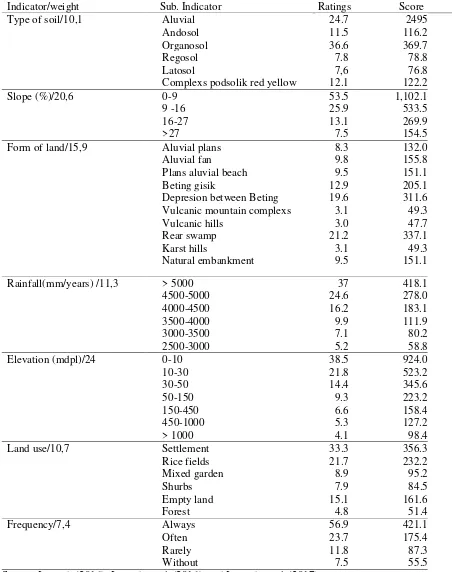
To determine the flood-prone zones, seven indicators are used: soil type, slope, elevation, rainfall, landform, land use, and flood frequency. The land use map is derived from 1: 250,000 scale. Slope maps are generated from the 1: 50,000 scale of Earth Map (RBI). The elevation maps are generated from the Digital Elevation Model (DEM) using the Shuttle Radar Topography Mission (SRTM) image. The land cover of Padang City resulted from Landsat ETM 7+ image interpretation in 2016 and soil type. The rainfall map is produced from interpolation of rainfall data from 1975-2012 period. Flood fraction map resulted from data analysis of Regional Disaster Management Agency (BPBD) of Padang City. Land use maps result from Landsat ETM 7+ image interpretation in 2016.
The indicator of determination of flood-prone zones used is presented in Table 1. For making the value of the flood prone interval class using equation 1. The highest total score is obtained at 3,661, while the lowest total score is obtained at 543. The desired interval class is three classes i.e. low vulnerability zone, moderately prone zones, and high-risk zones. There are many indicator with different weight, sub-indicator as specific parameters of indicator, ratings and score is important to built the model based on previous study (mention in source of table).
Here is equation 1.
1234567890 ‘’“”
LISAT 2017 IOP Publishing
IOP Conf. Series: Earth and Environmental Science 149 (2018) 012010 doi :10.1088/1755-1315/149/1/012010
Table 1. Flood zone prone indicator.
Indicator/weight Sub. Indicator Ratings Score
Type of soil/10,1 Aluvial 24.7 2495
Andosol 11.5 116.2
Organosol 36.6 369.7
Regosol 7.8 78.8
Latosol 7,6 76.8
Complexs podsolik red yellow 12.1 122.2
Slope (%)/20,6 0-9 53.5 1,102.1
Depresion between Beting 19.6 311.6 Vulcanic mountain complexs 3.1 49.3
Vulcanic hills 3.0 47.7
Land use/10,7 Settlement 33.3 356.3
Rice fields 21.7 232.2
Source: Iswandi (2016), Iswandi et al. (2016), and Iswandi et al. (2017)
4
1234567890 ‘’“”
LISAT 2017 IOP Publishing
IOP Conf. Series: Earth and Environmental Science 149 (2018) 012010 doi :10.1088/1755-1315/149/1/012010
prone index. The interval class described the value of model and will be have prone index for each values.
Table 2. Interval class of flood prone.
Prone class Interval class Prone Index
Lowest class 543 – 1,582 Lowest prone zone Moderate class 1,583 – 2,621 Moderate prone zone Highest class 1.1.– 3,661 Highest prone zone
Source: Iswandi (2016)
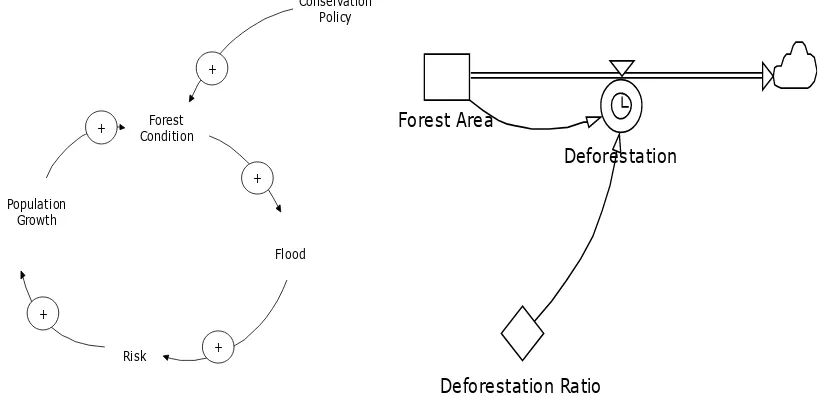
Dynamic modeling that will be developed in the flood prone areas of upper watershed conservation area. That human behavior due to misuse of land, deforestation and development is a driving factor for floods [7,5,13]. The Landsat 1994, 2007 and 2016 image used for analysis the land use change. Based on the three images can be described the change of forest area that will be modeled in dynamic system. In dynamic modeling using software powersim 10.1. Figure 2 shows the causal loop and dynamic model structure of flood prone zones in Padang City. After all of the process and result well done, the three scenarios have to examine.
Conservation
Figure 2. The relationship of causal loop (a), and model structure (b) flood prone areas.
3. Result
1234567890 ‘’“”
LISAT 2017 IOP Publishing
IOP Conf. Series: Earth and Environmental Science 149 (2018) 012010 doi :10.1088/1755-1315/149/1/012010
6
1234567890 ‘’“”
LISAT 2017 IOP Publishing
IOP Conf. Series: Earth and Environmental Science 149 (2018) 012010 doi :10.1088/1755-1315/149/1/012010
Figure 4. Land Use Change in Padang City.
Padang have four major rivers are Kandih steam, Airdingin steam, Kuranji steam, and Arau steam. The high intensity of rainfall in the upstream area caused the overflow of river water which resulted in the occurrence of flood disasters. Based on BPBD Padang City in the period 2000-2017 there was an increase and extent of flood disaster. Deforestation and conversion into bum land is considered as the causal factor of flood disaster in Padang City. That uncontrolled deforestation and land conversion into built up area will cause floods [4,5,14]. That forests have an important role in storing water during rain and preventing floods, it is necessary to maintain a minimum of 30 percent of the forest's upstream function [2].
Table 3. The dynamics of land use in Padang City.
Type of use Large (ha)
1994 2007 2016
Settlement 7.316,8 11.287,6 16.608,0
Rice fields 7.794,8 6.823,8 6.706,0
Mixed garden 3.589,1 1.506,1 1.214,7
Bush 938,6 479,2 424,1
Forest 49.392,9 48.976,8 44.139,4
Empty land 463,9 422,4 404,0
Total 69.496 69.496 69.496
1234567890 ‘’“”
LISAT 2017 IOP Publishing
IOP Conf. Series: Earth and Environmental Science 149 (2018) 012010 doi :10.1088/1755-1315/149/1/012010
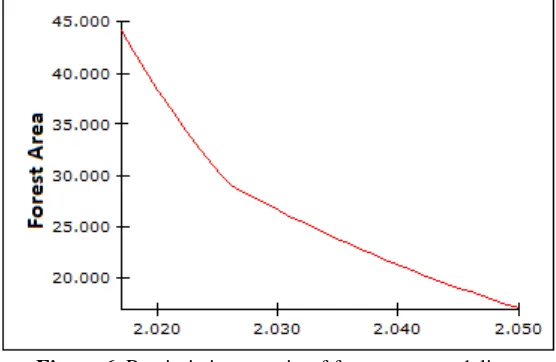
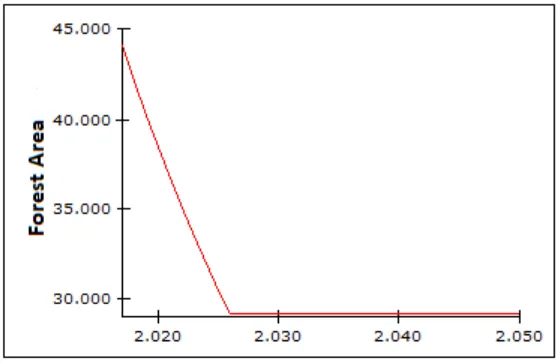
Table 3 presents land use in Padang City in 1994, 2007 and 2016 analyzed using Landsat ETM 7+ imagery. The period of 1994-2016 in Padang City has been a reduction of forest area of 5.253.5 ha, and annually forest area is reduced by 4.5 percent. Forest areas can be presented in dynamic modeling for periods up to 2050. Figure 5 shows that if the government does not intervene in controlling deforestation, then by 2050 it is estimated that the forest area will only be 9659 ha.
Figure 5. Forest area modeling without policy.
The importance of forest areas in the groundwater storage system in the rainy season will be impact on the disruption of the hydrological cycle [7]. That on the edge of the forest, the increase of number people affected destruction of forest area. Without strict supervision and law enforcement, the impact on deforestation by the forest community increases [13]. That to describe the future state can be explained by dynamic system modeling with three scenarios namely pessimistic, moderate, and optimistic [15,16].
Figure 6. Pessimistic scenario of forest area modeling.
8
1234567890 ‘’“”
LISAT 2017 IOP Publishing
IOP Conf. Series: Earth and Environmental Science 149 (2018) 012010 doi :10.1088/1755-1315/149/1/012010
Figure 7. Moderate scenario of forest area modeling.
Moderate scenario with deforestation rate of 1 percent in 2050 forest area in Padang city will increase to 22,119 ha. Indicators of success in the moderate scenario include: implementation in law enforcement in forest encroachment, consistency in the utilization of spatial pattern, and implementation of synchronization of usage between government institutions.
Figure 8. Optimistic scenario of forest area modeling.
Optimistic scenario with deforestation rate of 5 percent in 2050 forest area in Padang city will increase to 28,512 ha. Indicators of success in the optimistic scenario include: implementation in law enforcement in forest encroachment, consistency in the utilization of spatial pattern, and implementation of synchronization of usage between government institutions.
4. Conclusion
1234567890 ‘’“”
LISAT 2017 IOP Publishing
IOP Conf. Series: Earth and Environmental Science 149 (2018) 012010 doi :10.1088/1755-1315/149/1/012010
References
[1] Iswandi U 2016 Mitigasi Bencana Banjir pada Kawasan Permukiman di Kota Padang Provinsi
Sumatera Barat. Disesertation. Graduated school Bogor Agricultural University. Bogor.
[2] Kodra H S A and Syaurkani 2004 Bumi Makin Panas Banjir Makin Luas. Yayasan Nuasa
Cendikia. Bandung.
[3] Pribadi D, Shiddiq D and Ermyanila M 2006 Model Perubahan Tutupan Lahan dan faktor-
faktor yang Mempengaruhinya Jurnal Teknologi Lingkungan BPPT3 77-91
[4] Kodoatie R 2013 Rekayasa dan Banjir Kota Andi:Yogyakarta
[5] Yuksek O, Kankal M and Ucuncu O 2013 Assessment of Big Flood in the Eastern Black Sea
Basim of Turkey Environment Monitoring and Assesment 185 797-814.
[6] Asdak C 1995 Hidrologi dan Pengelolaan Daerah Aliran Sungai UGM Press: Yogyakarta.
[7] Mudelsee M, Borngen M, Terzlaff G and Grunewald U 2003 No Upward Trends in the
Occurrence of Extreme Floods in Central Europe j. Nature 425 1-9
[8] RI [Republik Indonesia] 2007 Undang-undang No 24 Tahun 2007 tentang Penanggulangan
Bencana Lembaran Negara RI Tahun 2007 66 Jakarta
[9] Iwan W Cluff L, Kimpel J and Kunreuther H 1999 Mitigation Emergen as Major Strategy for
Reducing Losses Caused by Natural Disasters Science28 78-82.
[10] Bechtol V and Laurian L 2005 Restoring Straightened River for Sustainable Flood Mitigation.
Disaster Prevention and Management14 6-12
[11] Iswandi U, Widiatmaka, Pramudya B and Barus B 2016 Delineation of Flood Hazard Zones by
Using a Multi Criteria Evaluation Approach in Padang West Sumatera Indonesia. Journal of
Environment and Earth Science6 205-2015
[12] Iswandi U, Widiatmaka, Pramudya B and Barus B 2017 Prioritas Pengembangan Kawasan
Permukiman pada Zona Rawan Banjir di Kota Padang Provinsi Sumatera Barat. Majalah
Ilmiah Globe19 83-94
[13] Stoica A and Iancu I 2011 Flood Vulnerability Assesment Based on Mathematical Modeling.
Technical University of Civil Enginering6 32-41
[14] Popovska C, Jovanovski M, Ivanoski D and Pesevski I 2010. Storm Sewer System Analysis in
Urban Areas and Flood Risk Assessment Technical University of Civil Enginering3 23-33
[15] Muhammadi, Aminullah E and Soesilo B 2001 Analisis Sistem Dinamis UMJ Press. Jakarta