MICROWAVE REMOTE SENSING IN SOIL QUALITY ASSESSMENT
S K Saha
Agriculture and Soils Division, Indian Institute of Remote Sensing (IIRS), Indian Space Research Organization(ISRO), 4, Kalidas Road, Dehradun – 248001, India,
KEY WORDS: Microwave Remote Sensing, Soil Quality, Soil Salinity, Soil Erosion, Soil Physical Properties, Soil Roughness
ABSTRACT:
Information of spatial and temporal variations of soil quality (soil properties) is required for various purposes of sustainable agriculture development and management. Traditionally, soil quality characterization is done by in situ point soil sampling and subsequent laboratory analysis. Such methodology has limitation for assessing the spatial variability of soil quality. Various researchers in recent past showed the potential utility of hyperspectral remote sensing technique for spatial estimation of soil properties. However, limited research studies have been carried out showing the potential of microwave remote sensing data for spatial estimation of various soil properties except soil moisture. This paper reviews the status of microwave remote sensing techniques (active and passive) for spatial assessment of soil quality parameters such as soil salinity, soil erosion, soil physical properties (soil texture & hydraulic properties; drainage condition); and soil surface roughness. Past and recent research studies showed that both active and passive microwave remote sensing techniques have great potentials for assessment of these soil qualities (soil properties). However, more research studies on use of multi-frequency and full polarimetric microwave remote sensing data and modelling of interaction of multi-frequency and full polarimetric microwave remote sensing data with soil are very much needed for operational use of satellite microwave remote sensing data in soil quality assessment.
1. INTRODUCTION
Information of spatial and temporal variations of soil quality (soil properties) is required for various purposes such as soil and crop management for improving crop productivity; sustainable land use planning; soil erosion and runoff modeling in watershed management; land – atmosphere gaseous exchange study for climate change modeling; biogeochemical cycles study; precision agriculture etc. Traditionally, soil quality characterization is done by in situ point soil sampling and subsequent laboratory analysis. Such methodology has limitation for assessing the spatial variability of soil quality. Furthermore, there is growing recognition of the varying spatial scales over which soil properties vary, leading to a clear need for field or watershed scale measurement (Anderson and Croft, 2009).
The advantages of aero-space remote sensing techniques using optical sensors for non-destructive spatial assessment of soils characteristics have been recognized. Various researchers in recent past showed the potential utility of imaging spectrometry based remote sensing technique for spatial estimation of soil properties (reviewed by Ben-Dor et al., 2008). However, limited research studies have been carried out showing the potential of microwave remote sensing data for spatial estimation of various soil properties except soil moisture. This paper reviews the status of microwave remote sensing techniques (active and passive) for spatial assessment of soil quality parameters such as soil salinity, soil erosion, soil physical properties –soil texture & hydraulic properties; drainage condition; and soil surface roughness.
2. MICROWAVE REMOTE SENSING OF SOIL QUALITY (SOIL PROPERTIES)
2.1 Soil Salinity
Soil salinity is one of the major soil degradation problems that affect crop growth and productivity. The identification of type and severity of salt affected soils with their location and areal extent is necessary for reclamation of the salt affected soils. Although, the delineation of salt affected soils is possible using optical remote sensing data, the delineation of salt affected soils is difficult in coastal areas and desert areas and in the black clay rich soils region because of spectral mixing with sand and poor spectral contrast in black soils region.
Radar is known to be sensitive to several natural surface parameters such as vegetation, surface roughness and dielectric constant (e) (Bell et al., 2001). The dielectric constant is comprised of the permittivity or real part and the loss factor or imaginary part. Research studies indicated that soil salinity has no influence on the real part of the dielectric constant (İ’) whereas;
the imaginary part (İ”) is dependent and increases with increase in
Temporal Envisat polarimetric SAR data (VV & HH) (ASD, 2006) was used in a research case study to map spatial soil salinity variation in part of Unao district of Uttar Pradesh. The three dielectric constant retrieval algorithms such as SPM, PO DM were used and the results of these were combined to retrieve the magnitude of the imaginary part of the complex dielectric constant for soil salinity class discrimination and mapping (Fig. 1).
2.2 Ravine Erosion Inventory
Optical multispectral and high-resolution panchromatic data are generally utilized for delineating and mapping severally eroded (ravine affected) area and its broad classification into different depth categories principally based on visual interpretation of the image characteristics. However these methods are qualitative in nature. Due to high sensitivity of microwave SAR to terrain ruggedness and vegetation penetration capability (sparse bushy vegetation and grasses), microwave remote sensing techniques such as SAR data and the InSAR (Interferrometric SAR) has the advantages of delineation and characterization of ravines as a function of ravine density, ravine depth, and ravine surface cover in quantitative terms.
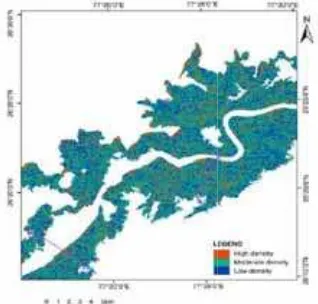
The results of a research study (Chatterjee et al 2009) carried out in part of Chambal river valley, U.P. showed that the ravine density map(Fig. 3)., prepared using the local statistics-based textural measure of speckle-suppressed ERS-1 SAR amplitude image matched well with ground observations (Fig. 2).
Map (Fig. 5) showing three ravine depth classes, namely, shallow (<5 m), moderately deep (5 - 20 m), and deep ravines (>20 m), was also prepared using InSAR DEM (Fig. 4) which was generated from an ERS SAR tandem pair data. Moderately deep ravines were found to be the most widespread in the study area. Ravine surface land cover classes viz., barren land, grass/scrub/ crop land, sparse vegetation, and wet land/dense vegetation, were delineated and mapped based on the temporal decorrelation properties (coherence) in repeat pass InSAR data.
2.3 Sand Dune Characterization
Sand dunes cover up to a quarter of many desert regions. Fixed and semi fixed sand dunes are distributed around the desert periphery, and the mobile dunes are distributed mainly in the inner part of the deserts. Information about the dune attributes is very important for understanding environmental changes in arid regions. In general, desert regions are difficult to access. Remotely sensed data are therefore very useful for monitoring desert environments.
Blumberg (1998) studied the windblown morphology in desert environments using polarimetric SAR. Qong (2000) estimated sand dune attributes from satellite SAR data (JERS-1 and ERS-1). The emphasis of this study was on, study the radar backscattering from the linear dunes surfaces to extract dune attributes such as dune height, inter dune spacing, and dune direction. These studies showed that dune height can accurately be estimated using RMS slope parameter derived from SAR satellite data. Two approaches are generally employed to derived RMS slope parameter from
SAR backscatter image – (i) generation of image showing difference in local incidence angle corresponding to backscatter variation and radar incidence angle; (ii) Fast Fourier Transformation (FFT) and generation of power spectrum (Fig. 6). The spectrum derived from the JERS-1 SAR image exhibited several major peaks, and the central part of the peaks was also consistent with the local prevailing wind direction. The inter dune spacing was calculated using the wave number k of the spectra. The dune heights derived from the present algorithm agreed fairly well with the dune heights observed in the field investigation. 2.4 Soil texture and Hydraulic Properties
An accurate estimation of spatially variable soil physical properties such as texture and hydraulic properties is necessary to develop reliable models of water flow and transport throughout the soil-plant-atmosphere continuum, for efficient management of soil resources for improving crop productivity, and for maintenance of environmental quality. Measurements of these soil physical properties are time-consuming and expensive. In addition, a large number of measurements are necessary to quantify their space-time variability.
Several research studies showed that spatial variability of soil texture and hydraulic parameters could be assessed using temporal microwave remote sensing derived changes in brightness temperature and soil moisture content ( Camillo et al. 1984; Mattikalli et al.1995; Mattikali et al. 1997; Mattikalli et al.1998; Chang and Islam, 2000; Santanello et al. 2007). The results of these studies indicated that close relationships existed between space-time evolution of remotely sensed passive microwave brightness temperature and soil moisture and soil types with respect to soil textural class (Fig. 7), and such a relationship can be used to identify soil texture and saturated hydraulic conductivity (Ksat) from a sequence of remotely sensed images of brightness temperature and remotely sensed soil moisture.
Chang and Islam (2000) followed three layered Feed – Forward – Neural Network (FFNN) approach for estimation of soil texture using satellite derived microwave brightness temperature and soil moisture status (Fig.8).
The FFNN consists of three layers of neurons: an input layer, a hidden layer, and an output layer. The input neuron receives and delivers the signal without changing it. The output neuron weights and sums the coming signals, and then the net result is passed through a linear activation function. The hidden neurons are similar to the output neurons except that a binary sigmoid is used as the activation function.
Profile harmonic-mean Ksat bears strong with two-day changes in surface soil mo correlation coefficients of 0.77, 0.83 and 0 and 60 cm depths, respectively). The resu loam and loam soils were characterized by h moisture content, whereas sandy loam a associated with lower changes. These ch related to hydraulic properties of the soil. S hydraulic conductivity drained quickly, having lower hydraulic conductivity drain Engman, 1997).
(A)
(B) Fig. 1: Image showing imaginary part of d and Soil Electric Conductivity (EC) Map (B
Fig. 2: Multi-look (5 x 1) backscattering ERS1 SAR data of the study area - after G filtering in order to suppress the micro te highlighting the meso and macro textures.
positive relationships oisture (Fig. 9) (with 0.68 for 5 cm, 30 cm ults indicated that silt higher changes of total and sandy soils were
haracteristics may be andy soils with higher whereas loamy soils slowly (Mattikali and
dielectric constant (A) B)
g coefficient image of Gamma MAP adaptive exture or speckles for
Fig. 3: Ravine density classes in information of the speckle-su image. (A_B and C_D are the along which ground truths on th 100 m regular interval.)
Fig.4: Interferogram (a) and from ERS SAR tandem pair data
Fig.5: Spatial disposition of diff study area as obtained from the tandem pair data of 1996.
n the study area based on textural uppressed ERS SAR amplitude e traverses across the ravine belt, he ravine density were collected at
InSAR-based DEM(b) generated a of April 1996 for the study area.
Fig. 6: Two-dimensional linear dune wave number spectra derived from JERS-1 SAR and ERS-1 AMI images in the study area. (a) Wave number spectrum derived from JERS-1 SAR image. (b)Wave number spectrum derived from ERS-1AMI image. ka and kr are the azimuth and range wave number of the power spectrum at peak frequency (Qong, 2000).
Fig. 7: Remotely sensed brightness temperature in 0 K [(a) June 10; (b) June 12; (c) June 14; (d) June 16; (e) June 18] and derived soil moisture in percent [(f) June 10; (g) June 12; (h) June 14; (i) June 16; (j) June 18] for the Washita92 experiment. Figure 1k refers to soil texture (1, sand; 2, loamy fine sand; 3, fine sandy loam; 4, loam; 5, loam; 6, silty clay loam/clay loam; 7, pits, quarries, urban; 8, gypsum; 9, water). [Chang and Islam (2000)]
Fig.8: Comparison of the TFNN model estimated (a, b) and observed (c) soil texture (Chang and Islam 2000).
Fig. 9: Relationships between profile harmonic-mean Ksat derived from hydrologic model simulations and two-day initial changes in surface soil moisture obtainable from microwave remote sensing (Mattikali and Engman, 1997).
Fig. 10: Within-field soil drainage mapping using canonical variates derived from a) hyperspectral reflectance principal components (HR PCs), b) C-Band SAR linear HH and VV polarizations, and c) apparent soil electrical conductivity within 0–30 cm (ECa30) and 0–100 cm (ECa100) depths. A higher drainage index represents a better drainage condition.
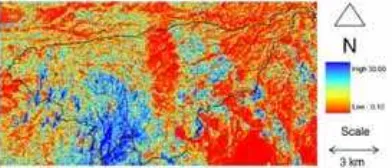
Fig 11: Roughness map (hRMS in cm) derived from radar images by the use of IEM, as formulated in Eq. (4). The solid line represents the boundary of USDA ARS Walnut Gulch Experimental Watershed (Rehman et al 2008).
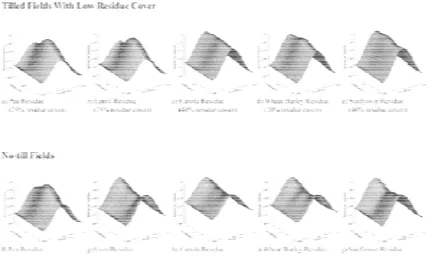
Fig 13: C-Band co-polarization signature presented in this figure are for tilled fields w residue (top) as well as for no-till fields (c been normalized to intensity values betwee et al, 2002).
2.5 Soil Drainage
Among the various soil properties, soil drai directly affects plant growth, water flow a soils. Drainage refers to the natural ability to infiltrate and percolate. Drainage ma because soil map users usually need in properties or soil behaviour rather than taxo use and management decision. For microw the magnitude of radar backscattering fr governed by the dielectric constant and so The dielectric constant in turn, is depen moisture content and, to some extent, on soi Therefore, radar remote sensing has the properties, such as soil drainage.
Liu et al (2008) evaluated different datas electrical conductivity (ECa), remotely s airborne hyperspectral reflectance (HR) a aperture radar (SAR) backscattering coe precision digital elevation model (DEM) measurements for soil drainage mapping wi (experimental farm in Ottawa, Ontario, demonstrated the potential utility of satell data to discriminate and map different dra well drained, moderately drained, imperfect drained following supervised digital classif analysis. Moderate agreement for drainag ground truth was achieved using the SA digital supervised, with ț=0.52. The
between the water regime descriptors and SAR was 0.75. For the C-band SAR datas of HH and VV backscattering coeffic (both 0.95). Areas with a better drain index and smaller canonical score)
e plots. Sample plots with lower amounts of centre). All plots have en 0 and 1 (McNairn
inage is important as it and solute transport in of soil to allow water apping is of interest nformation about soil onomic classes for land
wave remote sensing, rom a soil surface is oil surface roughness. dent strongly on soil il texture composition.
potential to map soil
sets viz. apparent soil ensed high-resolution and C-band synthetic fficients, and a high generated from GPS ithin agricultural fields
Canada). This study lite polarimetric SAR ainage classes such as tly drained and poorly fication and canonical e class mapping with AR dataset following canonical correlation
the evaluated dataset set, the loading factors cients were positive nage (higher drainage (Fig.10) had lower
backscattering values in these t radar backscattering coefficien moisture content and a better dr lower level of soil moisture (Liu
2.6 Soil Surface Roughness
Soil surface roughness (SSR) properties, infiltration rate, sur soil to erosion. Spatial and temp from natural or anthropogeni erosion, raindrop impact and ph Croft, 2009). For natural surf surface roughness can be summ standard deviation of surface which specifies the vertical correlation length (L) represe which similar (correlated) rough
conventionally measured by a field-deployed laser scanners (F Anderson and Croft (2009) and detail review of application techniques for estimation of surf
Rehman et al (2008) developed estimation of SSR and soil m multi angle radar back scatte Integral Equation Model (IEM model which quantifies radar moisture content and surface rou
McNairn et al (2002) studied practices on polarimetric SAR r data. This study examined the and polarimetric parameters pedestal height, and co-polar Results indicated that the dom the fields varies depending on cover, and whether the cro parameters most sensitive to perform best at characterizing parameters are the pedestal he polarization (HV) and the circu polarization signature plots and with the PPD are also useful i (Fig. 13).
3. CONC
Past and recent research studi passive microwave remote potentials for assessment of lan several soil characteristics such parameters, soil erosion condit and sand dunes), drainage cond
two polarizations. This is because nt is positively related with soil rained soil is likely to have relative u et al, 2008).
has influences on soil thermal rface run-off and susceptibility of mporal variations in SSR can result c phenomena, including tillage, hysical crusting etc (Anderson and
faces, the statistical properties of marized using two parameters: the height (root mean square, rms)
scale of roughness, and the enting the horizontal scale over hness conditions are detected. It is
pin meter and more recently, by Figs 11,12) (Rahman et al, 2008).
Baghdadi et al (2008) have given ns of various remote sensing
face roughness.
d a methodology for simultaneous oisture using multi temporal and ers data following inversion of M) – a physical radar back scatter
r back scatter as a function of ughness of the medium.
the effects of various soil tillage response using SIR-C polarimetric sensitivity of linear polarization (circular polarized backscatter, rized phase differences (PPD)). minant scattering mechanism from
n the type and amount of residue op had been harvested. Radar
volume and multiple scattering g these surface conditions. These eight, as well as the linear cross-ular polarization (RR). The co-d the stanco-darco-d co-deviation associateco-d
in categorizing these cover types
CLUSIONS
tillage conditions etc. However, more research studies on use of multi-frequency and full polarimetric microwave remote sensing data and modelling of interaction of multi-frequency and full polarimetric microwave remote sensing data with soil are very much needed for operational use of satellite microwave remote sensing data.
REFERENCES
Anderson, K. and Croft, H. (2009).Remote sensing of soil properties, Progress in Physical Geography, 33(4) pp 457-473. ASD (2006) Feasibility study on potential use of microwave SAR data in soil salinity induced land degradation study, M. Tech. Thesis (unpublished), Agriculture and Soils Division, Indian Institute of Remote Sensing (IIRS), Dehradun
Baghdadi, N., Mehrez Zribi , Cécile Loumagne , Patrick Ansart , and Thais Paris Anguela (2008) Analysis of TerraSAR-X data and their sensitivity to soil surface parameters over bare agricultural fields,Remote Sensing of Environment. 112, pp 4370 - 4379.
Bell, D., C. Menges, W. Ahmad, J.J. Van Zyl, (2001) The application of dielectric retrieval algorithms for mapping soil salinity in a tropical coastal environment using airborne polarimetric SAR. Remote Sensing of Environment. 75, pp 375-384.
Ben-Dor, E., Taylor, R. G., Hill, J., Dematte, J.A.M., Whiting, M. L., Chabrillat, S., Sommer, S., and Donald, L.S. (2008) Imaging spectrometry for soil applications. Advances in Agronomy, Academic Press, pp 321-392.
Blumber, D. G. (1998) Remote sensing of desert dune forms by polarimetric SAR, Remote Sensing of Environment,65, pp 204 -216.
Camillo, P. J., O’Neill, P. E., and Gurney, R. J. (1984) Estimating soil hydraulic parameters using passive microwave data. IEEE Transaction Geosciences and Remote Sensing. 24(6), pp930–936. Chang, D.H. and Islam, S.( 2000) Estimation of soil physical properties using remote sensing and ANN, Remote Sensing of Environment, 7, pp 534–544.
Chatterjee, R. S., Saha, S. K., Suresh, Kumar, Sarika, M., Lakhera, R. C., and Dadhwal, V. K. (2009) Interferometric SAR for characterization of ravines as a function of their density, depth, and surface cover, ISPRS Journal of Photogrammetry and Remote Sensing,64, pp 472 - 481.
Dubois, P. C., van Zyl, J. J., & Engman, T. (1995). Measuring soil moisture with imaging radars. IEEE Transactions on Geoscience and Remote Sensing, 33 (4), pp 915 - 926.
Jiangui Liu, Elizabeth Pattey , Michel C. Nolin , John R. Miller and Oumar K (2008) Mapping within field soil drainage using remote sensing, DEM and apparent soil electrical conductivity, Geoderma 143, pp261–272.
McNairna, H., Duguayb, C., Briscoc, B. and Pultza, T.J.(2002) The effect of soil and crop residue characteristics on polarimetric radar response, Remote Sensing of Environment. 80, pp 308 – 320.
Mattikali, N. M. and Engman, E. T.(1997) Microwave remote sensing and GIS for monitoring surface soil moisture and estimation of soil properties, RS & GIS Systems for Design and Operation of Water Resources Systems, Proc. Of Rabat Symposium, S3, IAHS Publication No. 242, pp 229 – 236. Mattikalli, N. M., Engman, E. T., Ahuja, L. R., and Jackson, T. J. (1995), Estimating soil properties from microwave remote sensing of soil moisture. In Remote Sensing for Agriculture Forestry, and Natural Resources, Proc. SPIE, Vol. 2585 pp. 89– 101.
Mattikalli, N. M., Engman, E. T., Jackson, T. J., and Ahuja, L. R. (1998a), Microwave remote sensing of temporal variations of brightness temperature and near-surface soil water content during a watershed scale field experiment, and its application to the estimation of soil physical properties. Water Resources Research. 34(9):2289–2299.
Mattikalli, N. M., Engman, E. T., Ahuja, L. R., and Jackson, T. J. (1998b), Microwave remote sensing of soil moisture for estimation of profile soil property, International Journal of Remote Sensing, 19(9), pp 1751 – 1767.
Qong, M.(2000) Sand dune attribute estimation from SAR images. Remote Sensing of Environment. 74, pp 217 – 228. Rahman, M.M., Moran, M. S., D.P. Thoma, D. P., R. Bryant, R., Holifield, C. D., Collins, Jackson, T., Orr, B. J. andTischler, M. (2008) Mapping surface roughness and soil moisture using multi-angle radar imagery without ancillary data, Remote Sensing of Environment, 112, PP 391–402.
Santanello Jr., J. A., Christa D. Peters-Lidard , Matthew E. Garcia, David M. Mocko b,d, Michael A. Tischler , M. Susan Moran,and D.P. Thoma (2007) Using remotely-sensed estimates of soil moisture to infer soil texture and hydraulic properties across a semi-arid watershed, Remote Sensing of Environment, 110, PP 79 - 97.
Sreenivas, K., Venkataratnam, L. and Rao, P.V.N.(1995) Dielectric properties of salt-affected soils, International Journal of Remote Sensing, 16(4), pp 641 – 649.
Stogryn, A. (1971), Equations for calculating the dielectric constant of saline water. IEEE Transactions on Microwave Theory and Techniques, (MIT-19, pp733 - 736.
Taylor, G. R., Abdullah H. Mah, Fred A. Kruse, T, Kathy S. Kierein-Youngi , Robert D. Hewson, and Brian A. Bennett (1996) Characterization of saline soils using airborne Radar Imagery, Remote Sensing of Environment, 57, PP 127 - 142.