EVALUATION OF INSAR DEM FROM HIGH-RESOLUTION SPACEBORNE SAR DATA
Kinichiro Watanabe a , Umut Sefercik b, Alexander Schunert c, Uwe Soergel c a Geospatial Information Authority of Japan –
watakin@gsi.go.jp b
Zonguldak Karaelmas University, Turkey – ugsefercik@hotmail.com
c Institute of Photogrammetry and GeoInformation (IPI), Leibniz Universität Hannover, Hannover, Germany – (schunert, soergel)@ipi.uni-hannover.de
Commission VII, WG VII/2
KEY WORDS: InSAR, TerraSAR-X, DSM Generation, Building Height Estimation, Accuracy
ABSTRACT:
In recent years a new generation of high-resolution SAR satellites became operational like the Canadian Radarsat-2, the Italian Cosmo/Skymed, and the German TerraSAR-X systems. The spatial resolution of such devices achieves the meter domain or even below. Key products derived from remote sensing imagery are Digital Elevation Models (DEM). Based on SAR data various techniques can be applied for such purpose, for example, Radargrammetry (i.e., SAR Stereo) and SAR Interferometry (InSAR). In the framework of the ISPRS Working Group VII/2 “SAR Interferometry” a long term scientific project is conducted that aims at the validation of DEM derived from data of modern SAR satellite sensors. In this paper, we present DEM results yield for the city of Barcelona which were generated by means of SAR Interferometry.
1. INTRODUCTION
One major application of SAR is the generation of DEM. This task can be accomplished by various techniques, for instance, SAR Stereo (e.g., Raggam et al, 2010) or SAR Interferometry (e.g., Bamler and Hartl, 1998). The former relies on matching correspondences in the magnitude images of complex SAR data, which requires the acquisitions been taken from unlike satellite tracks of sufficiently large viewing angle difference. The latter on the contrary is based on the pixel-by-pixel differential phase and therefore is restricted to very similar viewing geometries in order to maintain sufficient spectral overlap (Toutin and Gray, 2000). It's a matter of common knowledge that Shuttle Radar Topography Mission (SRTM) is among the most striking success stories of radar remote sensing (Rabus et al, 2003). The SAR data gathered during this shuttle mission in the year 2000 were processed to a DEM of almost global coverage, which is the best elevation model for many regions of the world and widely used still today.
Recent years saw the advent of a new generation of space-borne SAR sensors such as German TerraSAR-X (TSX) and Italian COSMO-SkyMed, which feature high-resolution mapping capability in the scale of one meter or even below. On the one hand, this fine spatial grid offers the opportunity to obtain DEM of richer level of detail compared to SRTM. On the other hand, repeat-pass SAR data acquisition inevitably comes along with temporal decorrelation of the scene and systematic disturbances of the interferometric phase caused by changing water vapour distribution in the atmosphere. Since SAR Stereo is solely based on the magnitude image, it suffers only from the first issue. In this sense SAR Stereo is the more robust technique, provided enough image patches can be matched.
We believe it is an interesting scientific topic to evaluate the quality of DEM derived from SAR data of modern satellite sensors. Twelve international groups of scientists participate in
a long term project managed by ISPRS Working Group VII/2. The groups apply different techniques for DEM generation (Radargrammetry, standard InSAR, multi-baseline InSAR etc.) and the results shall be validated against high quality ground truth. Furthermore, the DEM derived by the various approaches are mutually compared to investigate their pros and cons. The DLR agreed to provide about 85 TSX images of several urban areas for the project.
Since high-resolution SAR sensors like TerraSAR-X are preferably designed to map urban scenes, the focus of the project lies on cities. On the other hand, settlement areas are difficult terrain for SAR due to ubiquitous layover and occlusion issues attached to buildings. This leads to limited visibility of objects (Soergel et al., 2003), which decreases the number of correspondences for stereo analysis and also increases the size of areas hard to handle in InSAR processing, for example, pure noise in shadow regions. Those limitations can be mitigated at least to some extent by analysis of multi-aspect SAR data, be it by means of Radargrammetry (Soergel et
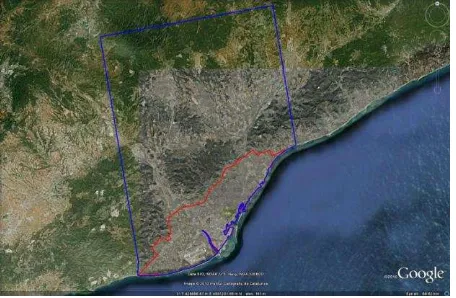
Figure 1. Test Site (Blue: Large Area, Red: Urban Area)
al., 2009) or InSAR (Thiele et al., 2010). If many images of the same orbit are collected over time, application of techniques like multi-baseline InSAR can raise significantly the accuracy of the height estimate, in particular for persistent scatterers, which are found preferably in cities. SAR Tomography even enables imaging in elevation direction, that is, to overcome layover by resolving objects located at different elevation angles, which are mapped into the same SAR resolution cell (Zhu and Bamler, 2010).
In this paper, we present intermediate results of the project obtained for the city of Barcelona. For this scene TerraSAR-X imagery are available which were taken in StripMap mode. Unfortunately, the orbit configuration is such that SAR stereo is not feasible. Instead we will exclusively focus on results obtained by means of SAR Interferometry.
2. TEST FIELD AND DATA SETS
Barcelona is the capital of Catalonia, Spain, and densely populated with about 1.6 million inhabitants of the city and 4 million in the region. The evaluation of the height model was conducted for two areas separately: “Large Area” covers almost the entire scene of the used image pair, “Urban Area” is a subset of Large Area covering the urban area of Barcelona.
The Large Area contains open and flat parts, mountainous
terrain, and forested zones; the altitude spans from sea level up to more than 1000 meter. The Urban Area is mostly flat, but it also contains some undulated built-up areas and the hill of Montjuïc, the main site of the Olympic Games in 1992. The maximum altitude inside Urban Area is about 250 meter.
2.1 Data Sets
The satellite TerraSAR-X was launched on June 15th 2007. It is one of the most modern space borne SAR sensors and the resolution is significantly better compared to previous civil space-borne SAR satellites. It features three observation modes - namely SpotLight, StripMap and ScanSAR - and is also capable to gather imagery of different polarization. The repetition rate is 11 days only, which helps to limit temporal decorrelation.
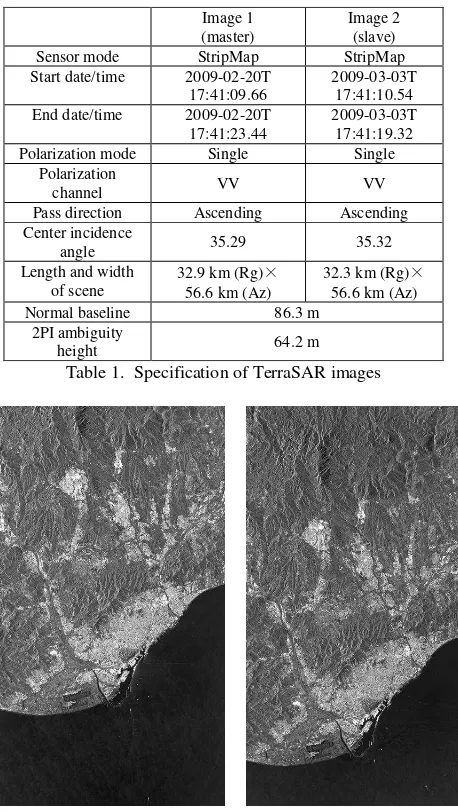
In this study, two TerraSAR-X images obtained by StripMap mode were used as an interferometric pair. Some relevant parameters of the two acquisitions are given in Table 1 and the amplitude images of are shown in Figure 2. The time lag between the acquisitions was 11 days. The resolution of the data is around three meter. One of the main advantages of StripMap mode is that it may cover very long continuous stripes of terrain. Hence, compared to Spotlight mode, which provides higher spatial resolution in 10 km x 10 km or 5 km x 10 km tiles, this mode is a better choice for applications which require rather large coverage than fine level of detail.
3. HEIGHT MODEL GENERATION
For the generation of a DSM from TSX, the standard InSAR technique was used. This is quite different from 3d measurement based on optical imagery. The processing consists of several steps (e.g. co-registration, interferogram generation, flattening, filtering, coherence estimation, phase unwrapping, orbital refinement, phase to height conversion, and geocoding). Thereby, proper threshold values and other parameters have to be chosen to obtain good results, which were optimized during the investigation. We used the commercial software SARscape, which is an extension module of the ENVI package. We restrict ourselves to a summery here, more details about the processing can be found in Sefercik and Soergel (2010).
During InSAR processing, multi-looking by factor of 4 (2 both azimuth and range) was conducted and SRTM DEM was used as height reference to flatten the interferogram. This facilitates the phase unwrapping due to the decreased phase gradients. Filtering according to Goldstein et al. (1998) was applied to denoise the interferogram before phase-unwrapping by region growing (Reigber 1997) occured. After that the unwrapped phase was converted to height and the generated DSM was geocoded onto a ten by ten meter grid. Finally, the resulting
Figure 3. TSX DSM (Left: Large Area, Right: Urban Area)
Image 1 (master)
Image 2 (slave)
Sensor mode StripMap StripMap
Start date/time 2009-02-20T
Polarization mode Single Single
Polarization
channel VV VV
Pass direction Ascending Ascending
Center incidence
Table 1. Specification of TerraSAR images
Figure 2. TSX images (Left: Image 1, Right: Image 2)
DSM was cut into two areas mentioned in section 2. The resulting DEMs are shown in Figure 3.
It turned out that interferogram filtering was an especially crucial step in the process. Hence, we decided to apply also a second method. We chose the Windowed Fourier Filtering (WFF) approach of Qian Kemao (Qian, 2007). Similar to the Goldstein filter WFF is based on Windowed Fourier Transform (WFT).
The MATLAB code of WFF available on Qian’s web site was used in this study. The availability of the source code opened the opportunity to tune parameters. The filtered interferogram by WFF was re-converted into ENVI format for further processing.
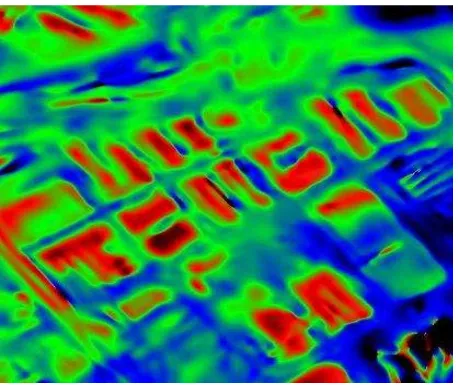
We discuss the results for the example of a industrial area close to the harbour of Barcelona, which is characterized by large halls. In Figure 7 a Google image is shown for better visual comparison. The filtered interferograms by Goldstein and WFF methods are depicted in Figure 4 and Figure 5, respectively. It can be seen that the main building structure are visible in both results. The WWF method leads to stronger noise suppression without over-smoothing at building boundaries.
4. EVALUATION METHOD AND RESULT
4.1 DSM
The resulting DSM was evaluated with the software BLUH (Bundle Block Adjustment Leibniz University Hannover), de-veloped by Dr. Karsten Jacobsen, Institute of Photogrammetry and Geoinformation (IPI), Leibniz Universität Hannover (Ja-cobsen, 2007). Table 2 shows the modules of BLUH which were used in the evaluation.
The reference height model was provided by the Cartographic Institute of Catalonia (Institut Cartogràfic de Catalunya, ICC), the official organization of surveying in Catalonia. It is a terrain model of grid size of 15m (Figure 6).
In order to perform the accuracy analysis, the TSX DSM should be filtered since the reference DTM is not a surface model but a terrain model. Therefore, the TSX DSM was filtered with RASCOR in BLUH system. After that the horizontal shift be-tween reference DTM and filtered DEM, which was obtained from TSX DSM, was calculated and removed by DEMSHIFT. In this operation, the acceptable maximum difference of height was set to 50 meter and the maximum number of iteration was set to 11. Table 3 shows the RMSZ values before filtering, after filtering, and after shifting. Even though the shift is more than 20 m, the effect on RMSZ numbers is not strong. However, for other sites we saw more significant influence Sefercik and Soergel (2010).
Original RMSZ
[m]
RMSZ after Filtering
[m]
Shift by DEMSHIFT
[m]
RMSZ after Shifting
[m]
X Y
Large
Area 11.9 11.9 3.4 23.8 11.6
Urban
Area 9.0 8.7 19.8 27.9 8.6
Table 3. Adjusted shifts
Figure 6. Reference DTM (Left: Large Area, Right: Urban Area) Figure 4. Interferogram after Goldstein filtering
Figure 5. Interferogram after WFF filtering
Program Function
RASCOR Filtering, analysis, correction and plot of a DEM
DEMSHIFT Shifting of a DEM to another in X, Y, Z and scaling in Z
DEMANAL Accuracy analysis of DEM against a reference DEM
BLCON
Conversion of ground coordinates window function, reduction to equal distributed points, change of spacing
Table 2. BLUH modules and their description
After shifting the filtered TSX DEM, its accuracy was analyzed with the program DEMANAL. In this operation, the maximum acceptable height difference was again set to 50 meter and the maximum tangent value of terrain inclination was selected to 1.00. That means, all points which exceed those limits will be labeled as blunders and discarded. DEMANAL iterates the analysis twice and the shift and vertical scale are respected in the second iteration. The tool is also able to deal with the va-riance of inclination of slope in the analysis. Table 4 shows the final result.
In the result for the Large Area in Table 4 the factor of local slope is contained, but it is not in the result of Urban Area. This is due to the fact that Urban Area is nearly flat and the slope factor was not reliable. In both areas the accuracy of the DEM is better than 10 meter for non-inclined areas.
Given the high spatial resolution of TSX at first glance one might expect better performance. However, this result is not surprising for several reasons. Firstly, Huber et al. (2010) show that for the TanDEM configuration multilooking by factor 16 would be required plus averaging of two interferograms to meet the ambitious aim of a point-to-point height error well below two meters. Secondly, in contrast to TanDEM we deal here with repeat-pass acquisitions, therefore temporal decorrelation and also the change of atmosphere cause further nuisance terms. Thirdly, we compare a reference DTM to InSAR DSM, so in-evitably a bias occurs at buildings and over forested areas. In order to look at the third issue, we conduct a comparison for part of the scene with a given 3d city model which is discussed in the next section.
4.2 Building Height
For the purpose of our investigation, the already introduced industrial harbor area characterized by large flat-roofed halls was selected (Figure 7). The height of each building was meas-ured from a 3d city model accessible in on Google Earth. This model is of very good quality, because it is based on data (also
provided by ICC) of higher resolution and accuracy than the reference DTM shown in Figure 6.
Before comparing the height of buildings, again some prepro-cessing steps had to be conducted for correct evaluation. Initial-ly the DSM was filtered with RASCOR using the specific pa-rameters adjusted for this area. Then shift and undulation be-tween terrain and filtered DEM were calculated and employed to the original DSM. This process was conducted for the DSMs obtained with both Goldstein filtering and WFF. In such man-ner DSMs adjusted to reference based on the ground were ob-tained.
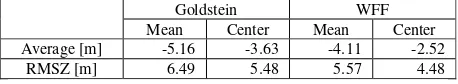
Since DSMs generated by standard InSAR technique are smoothed in the processing, the mean height of points located in the footprint of each building and the height of the center point of each building were calculated and used in the analysis. The final result is shown in Table 5.
Accuracy [m]
Large Area 9.1 + 4.8 × tan(), : local slope
Urban Area 8.6
Table 4. Accuracy of TSX DEM against reference DTM
Figure 7. Selected buildings on industrial area of Barcelona Figure 8. DSM in industrial area on Google Earth (Goldstein)
Goldstein WFF
Mean Center Mean Center
Average [m] -5.16 -3.63 -4.11 -2.52
RMSZ [m] 6.49 5.48 5.57 4.48
Table 5. Accuracy of Building Height
Figure 9. DSM in industrial area on Google Earth (WFF)
Due to multi-looking and smoothing, it is clear that the RMSZ of center height is better compared to mean height. The results also indicate that WFF gave slightly better results than Gold-stein filtering in preserving the building shapes clearer at least for the test site investigated in this paper. The results can be seen in Figure 8 and Figure 9. Interestingly we observe a nega-tive bias even for the building centres. The reason for this is not fully understood yet.
In order to avoid or at least mitigate the blur by smoothing across building borders, we believe that novel interferogram filtering and phase-unwrapping approaches have to be devel-oped. For example, those methods could introduce features derived from Radargrammetry such as the bright line of double-bounce signal that indicates the true position of parts of the accuracy of estimated building heights was investigated. It was shown that the accuracy of TSX DSM was less than ten meter both in the Large and the Urban Area in quite flat regions. The determined height of individual building heights were also presented and discussed.
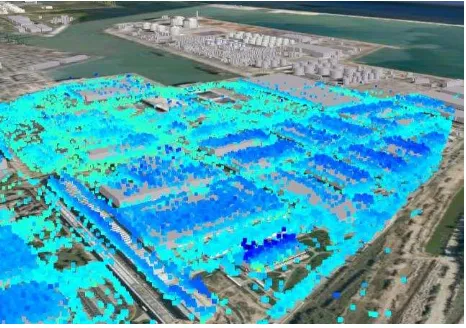
In the future, the height models generated with standard InSAR, Multi-baseline InSAR or other methods will be compared and evaluated. The accuracy and characteristics of each method will be assessed. An exemplary multi-baseline result for the industrial area is shown in Figure 10. The height estimates have been obtained using a stack of 30 TSX StipMap images and an algorithm similar to the one described in (Ferretti et al 2000) was used. It is easy to see, that the height information is just available for points exhibiting a stable backscattering behaviour over time (the so called Persistent Scatterers). It is expected, that the accuracy of height estimate especially for buildings are much better than that obtained with standard InSAR (Zhu and Bamler, 2010). This is mainly due to the necessity to unwrap the topographic phase component in space within the InSAR processing. Because of the smoothness assumption inherent to the common phase unwrapping algorithms, phase jumps caused by vertical walls cannot be modelled. Furthermore, a multi-baseline approach mitigates atmospheric effects by considering both spatial and temporal information. However, a numerical evaluation of the results achieved with both methodologies still has to be performed.
In order to compare different DEM extraction techniques from SAR including both Radargrammetry and InSAR we will shift our focus in the future to test site Berlin. For this city already several TerraSAR hundred images have been collected from ascending and descending orbits and seven different illumination angles.
The satellite TanDEM-X (TerraSAR-X add-on for Digital Elevation Measurement) was launched on June 21th 2010. It flies close to TerraSAR-X keeping distances between 250 meter and 500 meter. Since both systems acquire data bi-static, atmospheric effects and decorrelation are avoided. Thus, a significant improvement of the DEM quality can be expected. In the framework of our project we will in the future validate also those interferograms for our urban test sites.
ACKNOWLEDGEMENT
We want to thank DLR (German Aerospace Center) for providing about 85 TerraSAR-X images of built up regions without any cost in the framework of the project LAN0634.
REFERENCES
Bamler, R., Hartl, P. 1998. Synthetic aperture radar interferometry. Inverse Problems, Vol. 14, No. 4, R1-R54. Ferretti, A., Prati, C., Rocca, F. 2000. Nonlinear Subsidance Rate Estimation Using Permanent Scatterers in Differential SAR Interferometry. Transactions on Geoscience and Remote Sensing, Vol. 38, No. 5, pp. 2202-2212
Goldstein, R.M., Werner, C.L. 1998 Radar interferogram filtering for geophysical applications. Geophysical Research Letters, Vol. 25, No. 21, pp. 4035-4038
ISPRS Working Group VII/2 - SAR Interferometry. http://www.commission7.isprs.org/wg2/ (accessed 15 Apr. 2011)
Huber, S., Younis, M., Krieger, G., 2010. The TanDEM-X mission: overview and interferometric performance. International Journal of Microwave and Wireless Technologies, 2, pp 379-389 doi:10.1017/S1759078710000437
Jacobsen, K. 2007. Orientation of high resolution optical space images, ASPRS annual conference, Tampa, CD, 9 p.
Qian, K. 2007. Two-dimensional windowed Fourier transform for fringe pattern analysis: Principles, applications and implementations. Optics and Lasers in Engineering, Vol. 45, pp. 304-317.
Qian, K. MATLAB code of WFF and further documents. http://www.ntu.edu.sg/home/MKMQIAN/ (accessed 15 Apr. 2011)
Rabus, B., Eineder, M., Roth, A., Bamler, R. 2003. The Shuttle Radar Topography Mission – A new class of digital elevation models acquired by spaceborne radar. ISPRS Journal of Photogrammetry and Remote Sensing, Vol. 57, No. 4, pp. 241-262.
Figure 10. Multi-baseline result for the industrial area
Raggam, H., Gutjahr, K. H., Perko, R., Schardt, M. 2010. Assessment of the Stereo-Radargrammetric Mapping Potential of TerraSAR-X Multibeam Spotlight Data. IEEE Transactions on Geoscience and Remote Sensing, Vol. 48. No. 2. pp 971-977. Reigber, A., Moreira, J. 1997. Phase unwrapping by fusion of local and global methods. International Geoscience and Remote Sensing Symposium (IGARSS), Singapore, Vol. 2, pp. 869-871 Sefercik, U., Soergel, U. 2010. Comparison of High Resolution InSAR and Optical DEMs. EARSeL Joint SIG Workshop: Urban - 3D – Radar – Thermal Remote Sensing and Developing Countries, Ghent, CD, 13 p.
Soergel, U., Michaelsen, E., Thiele, A., Cadario, E., Thoennessen, U. 2009. Stereo Analysis of High-Resolution SAR Images for Building Height Estimation in case of Orthogonal Aspect Directions. ISPRS Journal of Photogrammetry and Remote Sensing, Elsevier B.V., Vol. 64, No. 5, pp. 490-500.
Soergel, U., Thoennessen, U., Stilla, U. 2003. Visibility Analysis of man-made Objects in SAR Image. IEEE/ISPRS Joint workshop on remote sensing and data fusion over urban areas, Urban 2003, pp. 120-124.
Thiele, A., Wegner, JD., Soergel, U. 2010, Building Reconstruction from Multi-Aspect InSAR Data. In: Soergel U (ed.): Radar Remote Sensing of Urban Areas, Series Remote Sensing and Digital Image Processing, Springer Netherlands, pp. 187-214.
Toutin, T., Gray, L. 2000. State-of-the-art of elevation extraction from satellite SAR data. ISPRS Journal of Photogrammetry and Remote Sensing. Vol. 55. No. 1. pp 13-33. Zhu, X. and Bamler, R. 2010. Very high resolution spaceborne SAR tomography in urban environment. IEEE Transactions on Geoscience and Remote Sensing, Vol. 48, No. 12, pp. 4296 – 4308.