CALCULATION OF PER PARCEL PROBABILITY FOR DUD BOMBS IN GERMANY
Seyed Mohammad Tavakkoli Saboura ([email protected]),*, Jürgen Agariusb ([email protected]), Javad Sadidia ([email protected]) a Department of Remote Sensing and GIS, Faculty of Geography, Kharazmi University, Tehran, Iran
b IGGH, Geibelstr. 63, DE-30173 Hanover, Germany
KEY WORDS: Data mining, Hazards, GIS, Statistics, History, Estimation, Analysis
ABSTRACT:
Unexploded aerial Bombs, also known as duds or unfused bombs, of the bombardments in the past wars remain explosive for decades after the war under the earth’s surface threatening the civil activities especially if dredging works are involved. Interpretation of the aerial photos taken shortly after bombardments has been proven to be useful for finding the duds. Unfortunately, the reliability of this method is limited by some factors. The chance of finding a dud on an aerial photo depends strongly on the photography system, the size of the bomb and the landcover. On the other hand, exploded bombs are considerably better detectable on aerial photos and confidently represent the extent and density of a bombardment. Considering an empirical quota of unfused bombs, the expected number of duds can be calculated by the number of exploded bombs. This can help to have a better calculation of cost-risk ratio and to classify the areas for clearance. This article is about a method for calculation of a per parcel probability of dud bombs according to the distribution and density of exploded bombs. No similar work has been reported in this field by other authors.
1. BACKGROUND
A dud bomb creates a whole without or with little throw-off that is considerably smaller than the crater of an exploded bomb. Wholes caused by 100 lbs or bigger dud bombs can be well detected on the high quality aerial photos at 1:5,000 or larger scales. Unfortunately, most aerial photos from the Second World War in Germany are available at scales smaller than 1:10,000 characterized by medium or low quality due to the age of photos, loss of quality by reproduction, old photography techniques and safe photography at high flight elevation during the war. Hence, many dud bombs are not detectable on available photos. Another issue is the time of photography. The small and shallow whole of a dud bomb may vanish by natural erosion, vegetation growth or human activities within few weeks after a bombardment. Therefore, aerial photos taken long time after a bombardment may not include the dud bombs. Unfortunately, aerial photos were often not taken immediately after every bombardment. In addition, it is usually not possible to use all available historical photos of a study area due to the costs of data preparation and interpretation. Hence, there is no guaranty that the study area can be investigated using aerial photos taken shortly after every bombardment. (Dodt et. al. 2003, 2004) Some land cover types may prevent the impact of unfused bombs to be seen on aerial photos independently from the photos scale and quality. The canopy of a forest is rarely affected by dud bombs while it covers the whole made by it. Also, throw-off around the crater of an exploded bomb may cover neighboring dud wholes. The whole of a dud bomb felt in an existing crater of a detonated bomb is often not detectable due to the low contrast between the whole and the crater. Exploded bombs cause bigger craters and obvious trace of throw-off. The craters are detectable on much smaller scales as low as 1:50,000 up to years after a bombardment especially if not filled intendedly. A detonation destroys often some trees in a forest and spreads the throw-off around; therefore, the impact can be seen on aerial photos of forest areas.
It is known that about 80% to 95% of released bombes during the WWII have exploded, hence, ca. 5% to 20% duds are left
depending on the type of the bombs (Mark 2004). Therefore, it is possible to guess the number of expected dud bombs considering the type, number and distribution of exploded bombs.
The rate of unfused bombs and the impact of size and type of bombs on dud quota have been intensively discussed by researchers in the past 70 years. On the other hand, there is no report about attempts for evaluation of dud probabilities according to the distribution of bombardments. This article is concerned with this issue and is reporting the first work in this field. This is also the reason that no similar work of other authors can be referenced in this field. A quantitative parameter is calculated for every parcel depending on the distance from craters of exploded bombs in the study area. This parameter is used to determine the probability of craters per parcel, which can be used to calculate the probability of duds for every parcel.
1.1. Study Area
The sample data used for this article is provided from an area close to a German military site and a former air force airport. The area has been a known target for the Allies air forces up to the end of the war. Therefore, it has been attacked many times from 1941 till 1945. The local government has planned a resort park in the study area. The ground should be, therefore, free of any explosive ammunition, in order to ensure the safety of the work site.
2. THE METHOD
can be calculated. With an experimentally known dud quota (Mark 2004), the probability for occurrence of a dud per parcel can be achieved by the number of exploded bombs.
2.1 Expected Number of Craters Per Parcel Based On
d
= Distance between the center of parcel i and the crater ji
depends, therefore, on the density of craters around a parcel. It is higher in an area with dense distribution of exploded bombsthan
i for a parcel in a less dense area. This distanceparameter represents the distribution of craters. It is always over zero because no threshold is set for the distance to craters,
although,
i for parcels far from bombarded areas may becomevery close to 0 showing very low density of craters.
A problem for this concept constitute the high impact of own craters on distance parameter of parcels having at least one known crater. Inclusion of the own craters cause a minimum of
i
for such parcels that is considerably higher than other parcels. This minimum sets a threshold that separates the list of parcels in two parts. All parcels with known craters get concentrated in the area higher than the threshold while most parcels without own crater remain under the threshold in the list.This results in a considerable underestimation of
i for parcelswith no known crater and an overestimation of distance parameter for parcels with own crater. Another issue is the placement of a crater inside the parcel. In a 30 meter parcel a crater may be located at less than one or more than 30 meter distance to the center of the parcel. The impact of this crater on the distance parameter depends strongly on its location within the parcel while it does not considerably influence the risk for the parcel in the reality. Figure 1 shows a sample of this issue. It shows an unreasonable high variation in the dud probability if own craters are included in the calculation. The parcel with crater number 1 has a very high dud probability because of the crater located in the center. In addition, the calculated probabilities for parcels without known craters are much lower than the ones with own craters whereas all parcels are in an area with a similar density of craters and risk.
Therefore, the own craters should be excluded from the calculation of distance parameter.
Next,
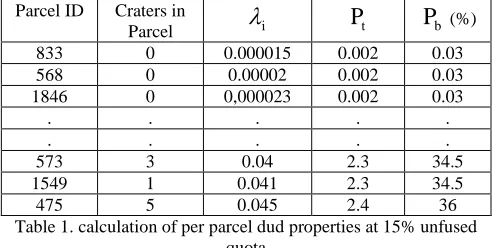
i and the number of known craters of every parcel areinserted in two columns of a table (Table 1) and sorted
according to the
i in ascending order. A moving average overthe number of known craters per parcel represents the per parcel density of exploded bombs around every parcel.
This value is the expected number of craters per parcel (
P
t) according to the density of bombs in the neighborhood.Expected number of unfused bombs per parcel (
P
bt) can beFigure 1. The red points are numbered known craters; the values in percent are calculated dud probability according to distance parameter. Inclusion of known craters resulted in unreasonable
probabilities.
Table 1. calculation of per parcel dud properties at 15% unfused quota
2.2. Optimum Parcel Size
Parcel is the geometric unit of the suggested method. Parcel size can affect the accuracy, usage and calculation effort of the results. A very large parcel size (for example 1 km) reduces the resolution and geometric accuracy of the results. A very small parcel size increases the calculation effort, while the accuracy may not be improved so far. An aerial fused bomb creates a crater with ca. 5 to 30 meter diameter. The minimum affected area will have about 10 meter diameter considering the throw-off by the explosion. Therefore, an interpreter can usually not separate craters very close to each other. So, it is very rare that more than one crater can be found in a small parcel (e.g. at 5
meter parcel size) and the value for
P
m is falsely calculated1
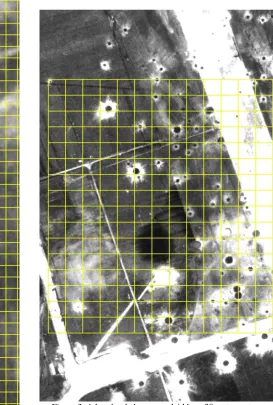
equal or very close to zero for small parcels. A lower border for parcel size can be considered so that the accuracy is reduced if the parcel size gets smaller. Figures 2 to 4 explain this issue. Figure 2 (scale 1:600) shows a raster of 5 meter parcels over an aerial photo of a bombarded area. The parcels are smaller than craters and therefore, the interpreter cannot find more than one crater per parcel, while it is possible that more than one bomb hit the same parcel.
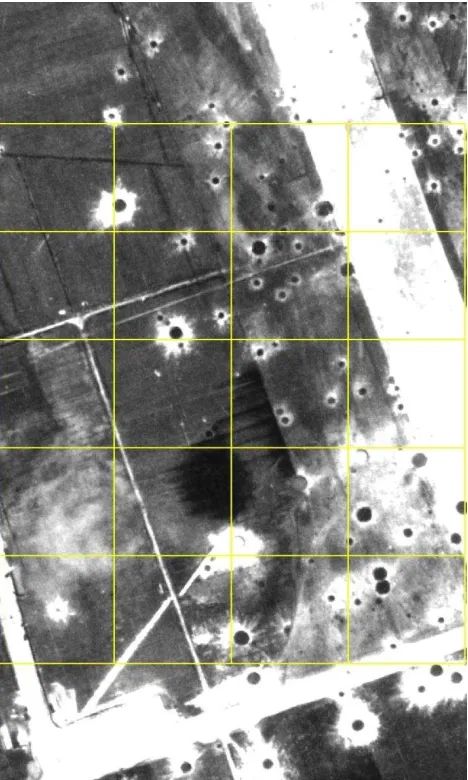
Figure 3 (scale 1:2000) shows a 30 meter raster and figure 4 (1:2000) another raster in the same area with 100 meter parcel size. Every 100 meter parcel covers a large area providing low spatial resolution. One probability is used for a parcel with 1ha area that is too inaccurate for many applications.
Table 2 shows the impact of parcel size on the probability of per parcel number of craters according to the own known craters (
m
P
). It can be seen that theP
m value increases with parcel size, which is expected. The larger the parcel, the higher the chance of containing more than one crater.Figure 2. a bombarded area overlaid by a 5 meter raster. No parcel contains more than one crater because of the small size of
the parcels.
Parcel size / Parcel area
(m / m²)
Number of parcels
Parcels having at
least one crater (N1)
Parcels having at least two crater (Nm)
Pm in % per Parcel
Pm in % per m²
5m / 25qm 8000 89 0 0 0,000
10m / 100qm 2000 87 2 2,3 0,023
20m / 400qm 500 80 8 10 0,025
30m / 900qm 208 63 17 27 0,030
50m / 2500qm 80 45 27 60 0,024
100m / 10000qm 20 16 13 81,25 0,008
Table 2. Parcel size and
P
m value for parcels with known craters.It is also expected that the value of
P
m divided by parcel’s area is reduced by the parcel size because the larger parcels includeless dense bombarded areas and the division of
P
m by the large area results in smaller values. On the other hand, small parcels with known craters are concentrated in bombarded area andcannot include not bombarded areas. Hence the value of
P
m remains close to the real density of the bombarded area and it is supposed that the smaller parcels result in better accuracy, which is shown by the last column of Table 2.Figure 4. the same area of Figure 3 with 100 meter raster. The spatial precision is reduced and the large parcels cover inhomogeneous surface. The impact of the known craters on the
statistics is distributed over a large parcel resulting in underestimation of the risk for a part of a parcel.
The last column of the Table 2 contains the values for division
of
P
m by parcel’s area. It can be seen that large parcels result insmall values as expected but the value of
P
m perm
2is reduced at parcel sizes under 30 meters that is in contrast withthe last expectation. This happens because of the known issue that some neighbor craters cannot be seen and mapped on aerial photos if placed very close to each other. This underestimation of the number of craters affects the statistics of small parcels more than large parcels.
In fact, there are two sources for underestimation of
P
m: first, inclusion of the not bombarded areas in large parcels, second, underestimation due to the very small distance between craters making them get detected as a single crater. Hence, the optimalparcel can be at the size that results in highest value of
P
m per area. It will be 30 meter for the study area according to the Table 2.3. RESULTS
Figure 5 shows a diagram of distance parameter vs. per parcel expected number of craters. The expected number of craters is calculated by a variable moving average over the number of known craters per parcel in a list of parcels sorted according to the distance parameter. In the parts of the list with less density of craters a larger neighborhood is averaged and in more dense parts smaller neighborhood, in order to avoid zero probabilities in low density areas and to ensure the expected details in densely bombarded parts of the study area.
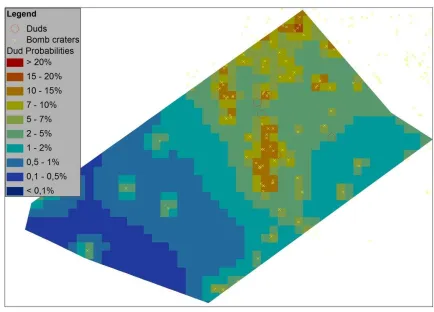
The diagram shows a high correlation between expected number of craters and the calculated distance parameter. A linear relation could be established between the two correlated parameters with 0.916 positive agreements. This high correlation indicates the potential of distance parameter to represent the bombardment density and to guess the number of expected duds. A map of per parcel dud probability could be provided using the introduced distance parameter and considering 0.10 dud quota (Figure 6).
The map is divided into 30 meter parcels and every parcel has a dud probability calculated by the suggested method. Densely bombarded parcels are colored dark red to light red indicating high risk of duds and low dud probabilities are colored in blue tons having dud probabilities less than 2% per parcel. Yellow points show the location of known craters and red circles are the found duds during the clearance of the area. Theses dud could not be located by photo interpretation which proves the necessity of the approach introduced in this article. Visual investigation of the map indicates a reasonable correlation between the calculated probabilities and the spatial distribution of duds. Four of five found duds are placed in the area with highest crater density and dud probabilities. One dud is found at the border between parcels with high and low dud probabilities. Hence, distribution of duds approves the idea that dud's distribution follows the spatial distribution of craters and dud probabilities can be guessed according to craters distribution. Another issue is the number of found duds and the ratio of dud/crater. 46 craters are mapped by photo interpretation and 5 duds are found during complete clearance inside the study area. This corresponds to a dud quota of 11% which is close to the used quota of 10%. Although, the dud quota strongly depends on the type and size of the bombs. Hence, it should be individually investigated for every study area.
Figure 5. distance parameter vs. expected number of craters per parcel.
Figure 6. Dud probabilities for an area bombarded during the WWII. Yellow points are the known craters by photo interpretation, colored parcels indicate the calculated probabilities and the red circles are found duds during the clearance.
Ex
p
ec
ted
n
u
m
b
er
o
f
cra
ters
4. CONCLUSION
A method has been used in this study than provides a per parcel dud probability regarding the distribution of known craters caused by aerial bombardments during the WWII. The implemented method is the first attempt in this field. Hence, not many related works could be referenced. The only referenced work that is directly related to the field of this article was about our earlier attempts.
It has been shown that the parcel size affects the accuracy of the results. We could calculate a 30 meter optimum parcel size according to the density of known craters per parcel’s area. The results are represented as a map that accurately indicates the risk level of duds and their expected distribution. The dud quota and the reasonability of the calculated probabilities could be validated by comparison with spatial distribution of craters as well as number and distribution of recovered duds during the field clearance.
The produced map of probabilities can be also used to calculate the expected number of an area larger than a parcel by integrating the statistics of parcels.
5. REFERENCES
Dodt J. and Mark H., 2003. Die Protokolle der Luftschutzpolizei - eine Quelle zur Verfassung altlastverdächtiger Flächen des zweiten Weltkriegs, Altlasten Spektrum 5/2003
Dodt J., Mark H. and Ruppel G. 2004. Kriegsbedingte Kontaminationsanteile auf altlastenverdächtingen Altstandorten. - Materialien zur Raumordnung, Bd. 63, Bochum, 118p Mark H., 2004. Aktuelle Inhalte und Fragestellungen Historischer Recherchen, Altlasten Spektrum 5/2004
Schmidt F. and Mosler K., 2004. Wahrscheinlichkeits-berechnung und schließende Statistik, Springer-Verlag Berlin Heidelberg