P.Walczykowski a, A.Orych a *, M. Kędzierski a , A. Fryśkowska a
a Department of Remote Sensing and Photogrammetry, Geodesy Institute, Faculty of Civil Engineering and Geodesy, Military University of Technology, Warsaw, Poland - (pwalczykowski, aorych, mkedzierski, afryskowska)@wat.edu.pl
!"# $%& 'Remote sensing, Imagery, Accuracy, Processing, Experiment
() *%( *'
There are two different methodologies which can be used to acquire imagery from which it would be possible to obtain spectral reflectance characteristics - the first based on images of a scene in which a reference panel had been included, and the second based on precisely selected exposure parameters. This paper is concerned with the first of these two methods based on experiments conducted using a 14bit XEVA XS-1.7.320 infrared sensor. The paper firstly describes the effect of different exposure settings on the accuracy with which we can later determine the spectral reflectance coefficients. The next step when working with such imagery in laboratory conditions is to eliminate the effect of the uneven distribution of illumination. In the paper we present two proposed methods for eliminating the uneven distribution of illumination - an additive method and a quotient method.After that it is essential to stretch the DN values. Once again we investigated two possible methods of doing this - firstly, by stretching the data using only the white reference panel, adjusting the maxDN value of the image of the surface of the reference panel to 95%. The second method additionally adds a second reference point - a black reference panel which reflects 5% of incident radiation. The spectral reflectance coefficients of chosen samples acquired using all of the above mentioned methods are compared with reference data obtained using a spectroradiometer. Establishing the most optimal methodologies will greatly increase the accuracy of obtained spectral response coefficients, which at the same time will increase the accuracy with which, in this case, water pollutants will be identified.
* Corresponding author. Agata Orych – [email protected]. + ,*%$&- * $,
+ + . /
The work described in this paper had been conducted as part of the “IRAMSWater - Innovative remote sensing system for the monitoring of pollutants in rivers, offshore waters and flooded areas” project (PBS1/B9/8/2012), financed by polish National Centre for Research and Development. This project will enable the execution of the Water Framework Directive (2000/60/WE). In recent years there had been a visible increase in the availability of light weight “amateur” UAV’s, which can be adapted for remote sensing applications, e.g. for research concerning water pollution. One of the many methods used to detect pollutants in water is a method based on spectral reflectance coefficients (i.e. Miller , 1977; Han, 1997; Rijkeboer , 1998; Schalles , 1998; Kallio , 2001; Thiemann , 2002; Ruddick , 2006)..
Spectral reflectance coefficients can be obtained from imagery acquired in different bands of the electromagnetic spectrum due to their close correlation to the pixel value (DN) on acquired imagery. There are two different methodologies which can be used to acquire imagery from which it would be possible to obtain spectral reflectance characteristics - the first based on images of a scene in which a reference panel had been included (i.e. Peddle , 2001; Thome, 2001; Schaepman, 2007; Milton , 2009; Kopackova 2014), and the second based on precisely selected exposure parameters (Walczykowski 2014). This paper is concerned with the first of these two
methods based on experiments conducted using a 14bit XEVA XS-1.7.320 infrared sensor.
0 " "% 1",*
The experiments consisted of a number of measurements taken on images acquired using the XEVA XS-1.7.320 infrared sensor equipped with a 1050nm interference filter. The images all included a 95% white reference panel and 7 different samples:
aluminium coated with light grey paint aluminium coated with black paint green plastic sheet
plywood spruce khaki cotton
aluminium coated with dark grey paint
The spectral reflectance coefficients of chosen samples acquired were additionally compared with reference data obtained using a spectroradiometer.
Images of this scene were all acquired and/or processed in such a way as to be able to determine:
the impact of the exposure parameters on the accuracy of acquired spectral reflectance coefficients
the impact of illumination distortion corrections on the accuracy of acquired spectral reflectance coefficients
the impact of DN stretching on the accuracy of acquired spectral reflectance coefficients
The International Archives of the Photogrammetry, Remote Sensing and Spatial Information Sciences, Volume XL-1, 2014 ISPRS Technical Commission I Symposium, 17 – 20 November 2014, Denver, Colorado, USA
This contribution has been peer-reviewed.
0 + "/ .
A series of three images of the test field, consisting of wooden and textile samples and a 95% white reference panel were obtained. Each scene was illuminated in exactly the same way. Between each acquisition the f-stop was changed in order to obtain a sensor response of 90%*214DN, 60%*214DN and 30%*214DN on the white reference panel (Figure 1)
234 534 634
Figure 1. Imagery acquired with different exposure parameters ensuring 90%, 60% and 30% reflection from the white
reference panel (in the centre of the image).
Next, the same procedure was repeated, only this time the f-stop was being set so that a grey reference panel reaches a given sensor response value. In this case it was technically impossible to obtain a 90%*214DN value on the grey reference panel, so only two images (60% and 30%) were obtained (Figure 2).
534 634
Figure 2. Imagery acquired with different exposure parameters ensuring 60% and 30% reflection from the grey reference panel
top of the image).
The spectral reflectance coefficients acquired from each of these images as well as an assessment of their accuracy is found in the Results section.
0 0 . .
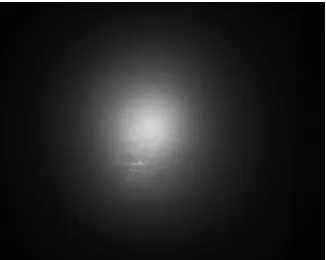
The next step when working with such imagery in laboratory conditions is to eliminate the effect of the uneven distribution of illumination. This step can usually be omitted when acquiring imagery in field conditions, however in laboratory conditions it is almost impossible to obtain perfectly scattered light. Figure 3 is an example image which was used to correct the negative effect of the uneven distribution of illuminations within the scene.
Figure 3. Illumination distribution correction image for 90% white panel image.
Two different image correction algorithms were tested - Image difference and Image Product. Both of these algorithms use the illumination distribution correction image (Ci) to calculate illumination distribution correction coefficients (Cc) for each pixel, which is then either added or multiplied by the uncorrected image (Uimg) to form the corrected image (Cimg):
Image Difference
(2.1)
Image Product
(2.2)
An example of a corrected image had been shown in Figure 4.
-7 & 8 7 . 8
Figure 4. The 90% white panel image corrected for illumination distribution using two different algorithms
As is seen in Figure 4, the Image Difference algorithm does not sufficiently correct the image, introducing in some instances even more distortions to pixel values (and therefore also the final spectral reflectance coefficients), so it was not used to correct any data for the purpose of this research. The Results section of this paper contains results obtained using the Image Product algorithm.
The International Archives of the Photogrammetry, Remote Sensing and Spatial Information Sciences, Volume XL-1, 2014 ISPRS Technical Commission I Symposium, 17 – 20 November 2014, Denver, Colorado, USA
This contribution has been peer-reviewed.
0 6 &, 9
For imagery acquired using an uncalibrated sensor it is essential to stretch the DN values from the acquired imagery. Once again we investigated two possible methods of doing this - firstly, by stretching the data using only the white reference panel, adjusting the maxDN value of the image of the surface of the reference panel to 95%. The second method additionally adds a second reference point - a black reference panel which reflects 5% of incident radiation.
Spectral reflectance coefficients acquired using both of these methods are analysed in the Results section of this paper.
6 %" -:*
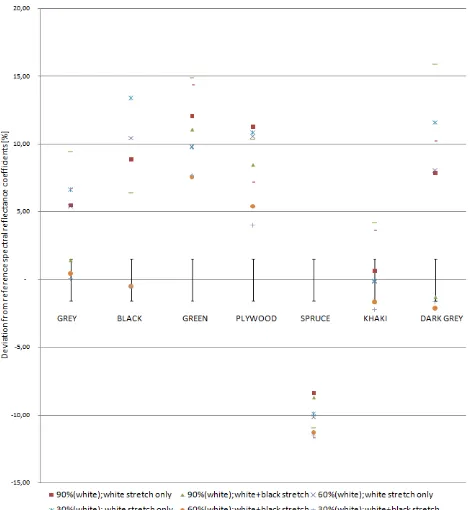
All imagery acquired using different exposure parameters (described in 2.1) was firstly corrected for illumination distribution errors using the Image Product algorithm (described in 2.2). From this corrected image it was possible to collect spectral reflectance coefficient measurements from all samples using one of two DN stretching algorithms (described in 2.3). These spectral reflectance coefficients were then compared to reference data measured using an ASD FieldSpec4 Wide-Res spectroradiometer. Knowing that that sensors noise level is about 250DN it was possible to calculate the relative errors in determining spectral reflectance coefficients.
For easier analyses all image-based measurements of samples were standardised to the reference spectral reflectance coefficient acquired using the spectroradiometer. Figure 5 represents the results of these measurements together with permissible errors from the reference measurements.
Figure 5. Deviation of spectral reflectance coefficients acquired using different methods in comparison to reference data
As is evident from Figure 5, it is extremely hard to acquire and process imagery data for the purpose of obtaining spectral reflectance coefficients with sufficient accuracy. However the proposed methods, if correctly implemented and possibly further developed, have the potential to greatly increase the near-lambertian scattering. This is probably most visible on the matte khaki textile.
These experiments have also shown that performing a DN stretch using both a white and black reference panel greatly increases the accuracy of obtained spectral reflectance coefficients.
It is also possible to increase the accuracy of this spectral information if the sensor exposure parameters are set using a reference panel, which has a spectral reflectance coefficient close to that of the sample.
$, :- $,
The performed experiment have shown that it is possible to obtain very high accuracy spectral data from imagery data acquire by the XEVA infrared sensor for samples which have matte surfaces. Further experiments are needed to perfect these methodologies for other types of samples. these further experiments will consist of measurements taken at different angles to the measured samples, as well as using different scene illumination angles. Additionally we will perform experiments using more diffused light sources in order to eliminate the need to perform illumination distribution corrections.
Establishing the most optimal methodologies will greatly increase the accuracy of obtained spectral response coefficients, which at the same time will increase the accuracy with which water pollutants will be identified within the IRAMSWater project.
( !,$ :"& "1",*
The presented article is part of research work carried out in the “Innovative remote sensing system for the monitoring of pollutants in rivers, offshore waters and flooded areas“ project- PBS1/B9/8/2012 financed by the polish National Centre for Research and Development NCBiR.
%";"%", "
Kopackova, V., Misurec, J., Lhotakova, Z., Oulehle, F., Albrechtova, J., 2014, Using multi- date high spectral resolution data to assess the physiological status of macroscopically undamaged foliage on a regional scale, !
"## $ % &'( ) $ * ! , 27 (2014), pp.
169- 186
Han, L., 1997, Spectral Reflectance with Varying Suspended Sediment Concentrations in Clear and Algae- Laden Waters,
+ % $ , - ( , 63,
pp. 701–705.
Kallio, K., Kutser, T., Hannonen, T., Koponen, S., Pulliainen, J., Vepsalainen, J., Pyhalahti, T., 2001, Retrieval of water quality from airborne imaging spectrometry of various lake types in different seasons, . - ! . % ) 268 (2001), pp. 59- 77.
The International Archives of the Photogrammetry, Remote Sensing and Spatial Information Sciences, Volume XL-1, 2014 ISPRS Technical Commission I Symposium, 17 – 20 November 2014, Denver, Colorado, USA
This contribution has been peer-reviewed.
Miller, J. R., Jain, S. C., O’ Neill, N. T., 1977, Interpretation of Airborne Spectral Reflectance Measurements over Georgian Bay, , - ( ! % ) 6 (1977), pp. 183- 200.
Milton, E. J., Schaepman, M. E., Anderson, K., Kneubuhler, M., Fox, N., 2009, Progress in field spectroscopy, ,
- ( ! % ) 113 (2009), pp. s92- s109.
Peddle, D. R., White, H. P., Soffer, R. J., Miller, J. R., LeDrew, E. F., 2001, Reflectance processing of remote sensing spectroradiometer data, # / * ( , 27 (2001), pp. 203- 213.
Rijkeboer, M., Dekker, A. G., Gons, H. J., 1998, Subsurface irradiance reflectance spectra of inland waters differing in morphometry an hydrology, "0 % 1 31, pp. 313- 323.
Ruddick, K. G., de Cauwer, V., Park, Y-J., Moore, G., 2006, Seaborne measurements of near infrared water-leaving reflectance: The similarity spectrum for turbid waters, 2
& 51(2), 2006, pp. 1167–1179.
Schaepman, M. E., 2007, Spectrodirectional remote sensing: From pixel to processes, ! "## $ %
&'( ) $ * ! 9 (2007), pp. 204- 223.
Schalles, J. F., Gitelson, A. A., Yacobi, Y. Z., Kroenke, A. E., 1998, Estimation of Chlorophyll a from time series measurements of high spectral resolution reflectance in an eutrophic lake, + 1 ., 34, pp. 383- 390.
Thiemann, S., Kaufmann, H., 2002, Lake water quality monitoring using hyperspectral airborne data- a semiempirical multisensory and multitemporal approach for the Mecklenburg Lake District, Germany, , - ( ! % ) 81 (2002), pp. 228- 237.
Thome, K. J., 2001, Absolute radiometric calibration of Landsat 7 ETM+ using the reflectance- based method, , - (
! % ) 78 (2001), pp. 27- 38
Walczykowski, P., Orych, A., Jenerowicz, A., 2014, Using XEVA video sensors in acquiring spectra reflectance
coefficients, 3 ! 4% )
% 5 ( 2 22-23.05.2014 .
The International Archives of the Photogrammetry, Remote Sensing and Spatial Information Sciences, Volume XL-1, 2014 ISPRS Technical Commission I Symposium, 17 – 20 November 2014, Denver, Colorado, USA
This contribution has been peer-reviewed.