INTEGRATED ESTIMATION OF SEISMIC PHYSICAL VULNERABILITY OF TEHRAN
USING RULE BASED GRANULAR COMPUTING
H. Sheikhiana, M.R. Delavarb and A. Steinc
a MSc. Student, GIS Dept., School of Surveying and Geospatial Eng., College of Eng., University of Tehran, Tehran,
b Center of Excellence in Geomatic Eng. in Disaster Management, School of Surveying and Geospatial Eng., College of Eng.,
University of Tehran, Tehran, Iran, [email protected]
c Department of Earth Observation Science, University of Twente, The Netherlands, [email protected]
Commission IV, WG IV/7
KEY WORDS: Granular Computing (GrC) algorithm; Geospatial Information System (GIS); Earthquake Physical Vulnerability Assessment; Multi-Criteria Decision Making
ABSTRACT:
Tehran, the capital of Iran, is surrounded by the North Tehran fault, the Mosha fault and the Rey fault. This exposes the city to possibly huge earthquakes followed by dramatic human loss and physical damage, in particular as it contains a large number of non -standard constructions and aged buildings. Estimation of the likely consequences of an earthquake facilitates mitigation of these losses. Mitigation of the earthquake fatalities may be achieved by promoting awareness of earthquake vulnerability and implementation of seismic vulnerability reduction measures. In this research, granular computing using generality and absolute support for rule extraction is applied. It uses coverage and entropy for rule prioritization. These rules are combined to form a granule tree that shows the order and relation of the extracted rules. In this way the seismic physical vulnerability is assessed, integrating the effects of the three major known faults. Effective parameters considered in the physical seismic vulnerability assessment are slope, seismic intensity, height and age of the buildings. Experts were asked to predict seismic vulnerability for 100 randomly selected samples among more than 3000 statistical units in Tehran. The integrated experts’ point of views serve as input into granular computing. Non-redundant covering rules preserve the consistency in the model, which resulted in 84% accuracy in the seismic vulnerability assessment based on the validation of the predicted test data against expected vulnerability degree. The study concluded that granular computing is a useful method to assess the effects of earthquakes in an earthquake prone area.
1. INTRODUCTION
Earthquakes are among the most hazardous natural disasters. They are unpredictable in time, location and intensity. They seriously affect the population, building constructions and infrastructure, especially in urban areas. They often occur close to geological faults and plate boundaries. The city of Tehran is located on several faults that have had a long period of inactivity. The faults thus contain a high risk for releasing a large amount of seismic energy, thus exposing the city to a catastrophic earthquake followed by destruction of thousands of buildings, its infrastructure, a number of fatalities and leaving many injured inhabitants. The city has suffered huge earthquakes in cycles of approximately every 150 years. Since there have not been any large earthquakes (greater than 6 at the scale of Richter) in Tehran in the past 185 years, seismologists expect a large earthquake to happen in Tehran soon (JICA, 2000). This confirms the need to estimate the expected damage and the associated loss caused by an earthquake in order to effectively mitigate its consequences.
Several institutions have carried out risk assessment in Tehran, in particular the International Institute of Earthquake Engineering and Seismology (Zare et al., 1999, Zaré and Memarian, 2003, Boustan and Shafiee, 2011) that classified potential Tehran earthquake damage from a geotechnical point of view and the Japan International Cooperation Agency (JICA, 2000) that produced seismic micro-zoning maps for the city.
Defining earthquake physical vulnerability as a multi-criteria decision making depends upon various parameters including building properties such as the material, the number of floors and
earthquake characteristics such as intensity, surface topography attributes like slope and expert’s judgments. All of these contain large uncertainties (Aghataher et al., 2005, Silavi et al., 2006, Amiri et al., 2008, Samadi Alinia and Delavar, 2011, Jahanpeyma et al., 2007, Khamespanah et al., 2013a,b, Panahi et al., 2013, Moradi et al., 2014a,b).
Abundant research efforts were carried out to address the earthquake modelling problem. Examples are coseismic displacement modelling (Yaseen et al., 2013a,b), hybrid models (Kappos et al., 1998) and spatio-temporal models (van Lieshout and Stein, 2012).
multi-criteria decision making supported by density induced ordered weighting average operator was applied to the problem by Moradi et al. (2014a).
In this study we turn towards Granular Computing (GrC) to extract compatible and accurate rules from a training data set to classify the whole study area (Samadi Alinia and Delavar,2011). GrC uses granules of information to find appropriate solutions (Zadeh, 1998,Yao, 2001, 2004). This model was implemented in the basic form by Samadi Alinia and Delavar (2011) and in an integrated form with Dempster-Shafer theory (Shafer,1992) by Khamespanah et al. (2013b) to assess Tehran seismic vulnerability.
Here, a new model for rule extraction process by GrC is proposed. It uses generality and absolute support for rule extraction and coverage as well as entropy to determine quality of the rules to be used in forming the granular tree. In the past, attention was focused on determining Tehran seismic vulnerability in the case of activation of the North Tehran fault (Samdi Alinia and Delavar, 2011, Khamespanah et al., 2013a), or activation of the three faults separately (Moradi et al., 2014a). In this paper, seismic vulnerability is assessed against aggregated activation of the North Tehran fault, the Mosha fault and the Rey fault simultaneously. In this way, the maximum seismic vulnerability imposed by the three faults is obtained and used to determine the physical seismic vulnerability of Tehran as the worst case scenario of the simultaneous activation of the three faults.
Geospatial information system (GIS) has been used as a spatial modelling and fusion framework, where GrC has been applied. Tehran urban statistical units have been considered as objects and six physical vulnerability criteria are taken into account as attributes of the objects forming an information table.
The rest of the paper is organized as follows. The theory of GrC and the customized model used in this paper is presented in Section 2. Data characteristics and obtained results are presented in Section 3. Section 4 finally presents the discussion and conclusions of the paper.
2. GRANULAR COMPUTING ALGORITHM
GrC is the science of processing data in different granularity levels (Bargiela and Pedrycz, 2003, Pawlak, 1982, Hobbs, 1985, Zadeh and Kacprzyk, 1999, Nguyen et al., 2001, Miao and Fan, 2002, Keet, 2008, Yao, 2008). In order to do so, information is divided into subsets, which are called granules of information (Yao, 2001, Lin, 2003, Yao, 2008).
The basic idea of information processing in GrC presents the information table, which is a finite set of objects commonly named the universe described by a finite set of describing attributes presented by Equation (1) (Pawlak, 1982):
S
(
U A L V
, , ,
t{
a|
a
A
t} {
,
F
a|
a
A
t)
(1)
where U is a finite non-empty set of objects, At is a finite
non-empty set of attributes, L is a language defined by using attributes in At, Va is a non-empty set of values of a At, Ia: U → Va is an
information function mapping an object from U to exactly one possible value of attribute a in Va (Pawlak, 1982). To classify a
data set by means of GrC, a set of rules is extracted. In a number of studies of machine learning and data mining, an IF–THEN
statement paraphrases a rule, “If an object satisfies Φ, then the object satisfies Ψ.”. In this way, a rule can be expressed in the form of ΦΨ, where Φ and Ψ are intensions of the two concepts (Gupta et al., 1979, Pawlak, 1982). The interpretation suggests a
cause and effect relationship between Φ and Ψ (Yao, 2001). GrC applies several measures for a single-granule properties, a relationship between two granules, and a relationship between a granule and a set of granules.
2.1 Generality
The generality of concept displays the relative size of constructive granule of the concept , as defined in Equation (2). It confirms that a larger granule will result in the greater generality index (Pawlak, 1982):
| ( ) | | )
|
( m
G
U
(2)
where | | is the size of granule that constructs the concept and |U| is the size of constructive granule of the whole universe.
2.2 Absolute Support
For the two given concepts and , the absolute support (AS) or confidence that provides to the , is defined by Equation (3) displaying the conditional probability of a situation that a randomly selected object satisfying , also satisfies (Yao, 2001):
( ) m
AS
m
(3)
where | | is the size of granule which supports both concepts and . The quantity AS is between 0 and 1 and expresses the degree to which implies (Yao, 2001).
2.3 Coverage
The coverage of concept provided by concept is defined by Equation (4) (Yao, 2001):
CV (→) =| |
| | (4)
where | | is the size of constructive granule of concept, and | | is the size of granule constructing both concepts
and. This quantity displays the conditional probability of a randomly selected object to satisfy , when satisfies and shows the coverage of upon (Yao, 2001, 2008).
2.4 Conditional Entropy
For formulas a family of formulas of Ψ = {Ψ1, Ψ2, . . . , Ψn} is considered that induces a partition π(Ψ) = {m(Ψ1), . . . ,m(Ψn)} of the universe. The conditional entropy H (|) that reveals the uncertainty of formulas based on formulas Ψ, is defined by Equation (5) (Yao, 2008):
H (|) = - ∑�=1 �| � �| (5)
where: � | = | � |
| | .
2.5 Mining association rules
rules and constructing granules from training data set, until algorithm extracts the best rule set for the predictions.
2.6 Mining exception rules
According to Yao (2001), a major drawback of the association rules extracted by the original GrC is the possibility of existing rules relating some concepts in the data that may not exist in reality, or rules that are not extractable by applying this model, making association rules incomplete to classify the dataset appropriately.
For example, based on the association rule extraction principles, for the two concepts Φ and Ψ, the rule Φ→Ψ may have a high absolute support, whereas it has not been extracted as an
association rule. However, if Ψ is a concept with high generality, considering the absolute support formula, it could be concluded that in reality Φ supports Ψ negatively and association does not exist (Yao, 2001, Khamespanah et al., 2013a). Existing of suitable rules for classifying data that may not have a high generality but not extracted by the association rules is also possible (Yao, 2001).
Exception rules can be extracted for a rule like Φ →Ψ if the formula Φ' is found and added to the initial rule and a converse result to initial rule is obtained for instance, Φ'^Φ →¬Ψ; in which it has high absolute support, no matter how low the generality is (Yao, 2001).
Figure 1: Schema of obtaining classification rules by the GrC algorithm
3. EXPERIMENTAL RESULTS
In this section, the procedure of data preparation, model implementation and the obtained results are discussed.
3.1 Data preparation
The physical vulnerability of Tehran against earthquake is based on the activation of the three major faults, i.e. the North Tehran fault, the North and South Rey faults and the Mosha fault as presented in Figure 2.
The North Tehran Fault is 90 Km long located at the southernmost piedmont of Central Alborz. It has an E–W to ENE–WSW strike, a dip of less than 75o, and a thrust mechanism
(Berberian and Yeats, 1999). It proved the major active fault threatening directly the city due to several historical earthquakes recorded. The shape of this fault does not have a distinct scarp (Berberian and Yeats, 1999). Some authors suspect that events in the past, such as the 855 A.D and 856 A.D earthquakes, could be associated to this fault (Berberian and Yeats, 1999, 2001). The Mosha Fault is located at the northeast side of Tehran with a length of 150 Km. It has experienced several earthquakes with magnitude greater than 6.5 in the past (Berberian and Yeats, 1999). The South and North Ray Faults are located south of Tehran (JICA, 2000). The North Ray Fault has a length of 16.5 Km, in the W–E direction and a dip towards the north. The South
Ray Fault is 18 km long with ENE–WSW direction (Berberian and Yeats, 2001).
Census data of 2000 were used because of data availability, although the most recent Tehran census data was carried out in 2010. This data set contains 3175 statistical units in the Tehran metropolitan area.
The average slope of the land, the intensity of earthquake in MMI and building parameters are considered as effective seismic parameters (Aghataher et al., 2005, Silavi et al., 2006, Amiri et al., 2008, Samadi Alinia and Delavar, 2011, Khamespanah et al., 2013). Material and the number of floors of building are taken as the most important building parameters in assessing the seismic vulnerability. The percentage of materially weak-constructed and less-than-or-equal-to-four-floors buildings and the percentage of weakly founded buildings of more than four floors in any given urban statistical unit are taken as the two major parameters in building seismic vulnerability (Aghataher et al., 2005, Silavi et al., 2006, Amiri et al., 2008, Samadi Alinia and Delavar, 2011, Khamespanah et al., 2013a,b).
Since Iranian regulations for building designs have been approved in 1966, buildings constructed before this date are considered as non-standard constructions. Moreover, fortification regulations against earthquakes were applied for the first time in 1988. In this regard, the percentage of buildings constructed
Extract rules with maximum generality and absolute support (R)
Eliminate attribute records that contribute in these rules (B=U-R) Prepare the data in the
form of information table (U)
Check if the universe is empty (B=ɸ)
Yes No Set the U as the root
node of the granular tree
Set the B as the universe
Check if there are active nodes that can be classified
by more than one rule
Accepting the extracted rules Yes
No Setlect active node (N) with
maximum value of activity ( maximum coveraage,
minimum entropy) Compute the coverage
and entropy of the active node with respect to all remained attribute values Select the granules with minimum
intersection (least overlap) with the union of all non-active nodes in
granule tree
Select the granules with minimum entropy from granules selected in the
previous section
If there are more than one concept selected, the one with the maximum coverage of these concepts with respect to all considered classes
is selected.
Modify the granule network (GN) by adding the selected
granule as a new node, connecting it to granule (N)
Update the activity status of the N and
new granule
before 1966 and the percentage of buildings constructed between 1966 and 1988 are considered as effective parameters (Khamespanah et al., 2013a).
To determine physical seismic vulnerability for each statistical urban sample unit, experts were asked to rank the degree of vulnerability for 100 randomly selected units, using numbers from one to five, corresponding to the classes of ‘very low
vulnerability’, ‘low vulnerability’, ‘intermediate vulnerability’, ‘high vulnerability’ and ‘very high vulnerability’, respectively.
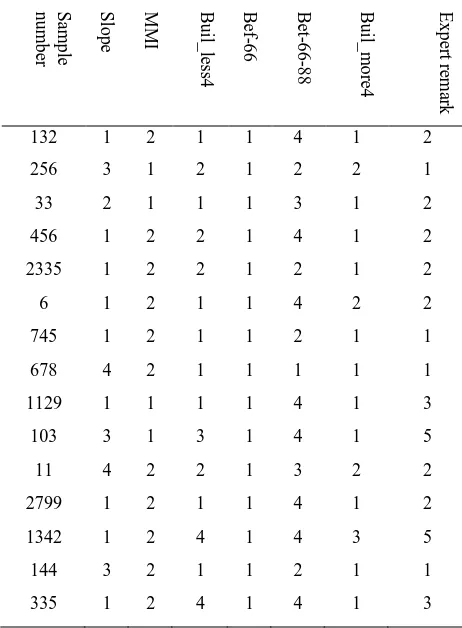
The effective parameters were divided into four intervals of equal length and output vulnerabilities were divided into five classes. Views for 15 selected samples are shown in Table 1.
Figure 2: Position of North Tehran fault, Mosha fault and Rey faults
Table 1: Classified vulnerability information for 15 out of 100 randomly selected building with Slop: Slope, MMI: MMI, Build_less4: Percentage of weak buildings having less than or equal to 4 floors, Build_more4: Percentage of buildings having more than 4 floors, Bef-66: Percentage of buildings built before 1966 and Bet-66-88: Percentage of buildings built between 1966
and 1988 (Samadi Alinia and Delavar, 2011).
3.2 Extracting rules
The rules satisfying maximum generality and absolute support parameters were selected as the effective rules. These rules were assessed by maximum coverage and minimum entropy to ensure that rules of the highest quality for the classification of seismic physical vulnerability of Tehran were extracted. The extracted rules employing the granular tree to determine the seismic vulnerability of Tehran are illustrated in Figure 3. In this tree, extracted rules are placed in prioritized order from left to right, showing confidence accounted for each rule based on minimum entropy and maximum coverage. Attributes are abbreviated as delineated in Table 1. This tree is used to assign seismic physical vulnerability class to the Tehran urban statistical units.
Figure 3. The granule tree of the extracted rules from training data set for classifying statistical units of Tehran with respect to
their seismic physical vulnerability
3.3 Applying granular tree
The extracted granular tree was used to classify Tehran statistical unitsinto the seismic vulnerability classes. The seismic physical vulnerability maps resulted for Mosha fault, Rey fault and North Tehran fault using GrC are illustrated in Figures 4, 5 and 6, respectively. These maps present the degree of vulnerability imposed to each statistical urban unit by the considered faults. It can be interpreted that activation of the North Tehran fault will have the highest destructive impact among the three faults, whereas activation of the Mosha fault will have the least destructive impact on Tehran, due to its distance to the city compared to that of the other two faults.
Figure 5. Tehran seismic physical vulnerability map against Rey fault activation using GrC
Figure 6. Tehran seismic physical vulnerability map against North Tehran fault activation using GrC
3.4 Aggregated value of Tehran seismic vulnerability
Next, we considered the aggregated value for Tehran’s seismic
physical vulnerability. We aimed to identify the effects at the areas with the highest seismic vulnerability. For all statistical urban units of Tehran, vulnerabilities from the North Tehran fault, the Mosha fault and the Rey fault have been determined using the extracted granular tree. For each unit, the highest resulted seismic physical vulnerability is considered as the aggregated measure of vulnerability. Aggregated vulnerability therefore shows the worst case scenario that may happen for a particular statistical unit in Tehran.
Table 2 demonstrates the aggregated seismic vulnerability value for the 15 statistical urban sample units presented in Table 1, indicating the imposed vulnerability from the three major faults and the maximum value that considered to be the worst case for that sample. Figure 7 illustrates Tehran physical seismic vulnerability map considering the worst case scenario using GrC, which shows the maximum possible vulnerability for the statistical units. In addition, Figure 8 demonstrates percentage of Tehran statistical units allocated to each vulnerability degree for different scenarios considered. According to Figure 8, activation of the Mosha fault and the Rey fault, will result in more than 70% of the units falling into the medium and low vulnerability classes. Activation of the North Tehran fault, however, will result in more than 50% of the units to have a high or very high degree of vulnerability. In the worst case model, therefore, more than 90% of the statistical units occur in the high and very high vulnerability classes.
Statistical unit number
Physical seismic vulnerability Maximum
Value North
Tehran fault
Mosha fault
Rey fault
132 3 2 1 3
256 3 1 2 3
33 2 1 1 2
456 2 3 5 5
2335 5 4 4 5
6 2 2 2 2
745 1 2 1 2
678 4 2 1 4
1129 3 2 1 3
103 5 4 4 5
11 3 3 2 3
2799 2 2 1 2
1342 5 4 3 5
144 3 4 3 4
335 3 1 1 3
Table 2. Selected samples of Tehran statistical units and their aggregated seismic physical vulnerability
Figure 7. Tehran seismic physical vulnerability map considering the worst case scenario using GrC
Figure 8. Comparison of Tehran seismic physical vulnerability imposed by the four scenarios of the fault activation
3.5 Validation of the results
Since there is no large earthquake happened in Tehran within about last 150 years of a magnitude above 6 at the scale of Richter, the only way to validate the model output is to assess the
27 24
38
9
2
26 29 28
9 8
2
13
31
19
35
1 1
7
23
68
0 10 20 30 40 50 60 70 80
1 2 3 4 5
P
er
ce
n
tag
e
o
f
st
at
is
ti
cal
u
n
it
s
Vulnerability Degree
Mosha Fault Rey Fault
accuracy of the classification based on the data used to extract the classification rules. The model is therefore assessed to realize the number of the units correctly assigned to the degree of vulnerability as defined by the experts. The overall classification accuracy of the seismic physical vulnerability is calculated using
�
�+ , where k is the statistical urban sample unit correctly
classified and n is the number of incorrectly classified units, based
on the available data set and experts’ remarks (Yao, 2005, Pedrycz et al., 2008). The final accuracy for the North Tehran fault is estimated as 84% which confirms the reliability of the algorithm in comparison with previous GrC algorithms implemented by Samadi Alinia and Delavar (2011) an Khamespanah et al. (2013a), which resulted in 72% and 60% accuracy for the North Tehran fault, respectively.
4. DISCUSSION
The seismic physical vulnerability of Tehran has been assessed by historical proofs (Berberian and Yeats, 2001) where precise prediction of time, intensity and location of possible earthquakes is restricted by technological and scientific advances. Thus, it is imperative to produce seismic physical vulnerability maps to enable planners in order to develop risk reduction plans, which is the aim of this paper. In this regard, a new classification model based on the GrC algorithm was applied. Moreover, an aggregated seismic vulnerability value estimated the impact of the three major threatening faults around Tehran.
Seismic vulnerability maps showed that Tehran is highly vulnerable against earthquakes arising from the three major faults around the city. The effect of the Mosha fault was the least among the three faults, because the fault is located farthest from Tehran. Activation of the Rey fault, however, will impose a medium destructive impact on the city. Finally, the North Tehran fault is the most threatening fault because there are more statistical urban units associated to it at a high degree of vulnerability. The worst case scenario happens when these three faults are simultaneously activated, because earthquakes are not always related to a specific fault and it is possible for the three major Tehran faults to become active in response to a regional stress (Mucciarelli et al., 2001, Ashtari et al., 2005). The model developed in this study verified that for all of the three major faults of Tehran, most of the statistical urban units that have a high vulnerability are located in the south of Tehran. This corresponds with the actual building conditions in Tehran, because most of the aged buildings and non-standard constructions exist in the southern part of the city.
The new GrC algorithm implemented in this paper uses generality and absolute support for rule selection and prioritizes the extracted rules by entropy and coverage. Since there is no real earthquake happened in Tehran in the past 185 years, the only way to validate the results is to compare the acquired results with
the experts’ judgments. This algorithm led to 84% accuracy in
classification of Tehran statistical units into seismic physical vulnerability classes, which exceeds previous attempts on Tehran
seismic vulnerability classification by GrC algorithm
implemented by Samadi Alinia and Delavar (2011) and Khamespanah et al. (2013a), resulting in 72% and 60% accuracy, respectively.
5. CONCLUSION
Natural disasters have always been imposed catastrophic casualties and devastations to the human society, and even today, precise prediction of the disaster is not adequately addressed by
scientific and technological advancements. However,
prognostication of the natural disasters seems insufficient to
shield the peoples and their holdings from disaster consequences.
Improving resistance of the urban environments by
comprehensive planning can be regarded as the solution to the problem. Earthquake, is one of the most calamitous disasters endangering human kind all over the world, mostly because of its abrupt nature. Tehran, capital of Iran, is a highly populated city with numerous non-standard construction and aged buildings, surrounded with several known and unknown faults exposing the city to possibly huge earthquakes. In order to enable the urban managers to develop seismic damage reduction plans, this paper aimed at evaluating the seismic physical susceptibility of Tehran in the form of vulnerability classification maps.
This paper proposed a new granular computing algorithm which uses generality and absolute support for rule extraction, and utilizes coverage and entropy for rule ordering, to obtain the seismic physical vulnerability considering the effects of the three major known faults of Tehran, namely North Tehran fault, Mosha fault and Rey fault. Slope, seismic intensity in term of MMI, height and age of the buildings were considered to be the effective criteria in the classification procedure, accompanied with expert knowledge.
The new granular algorithm led to a higher accuracy in seismic vulnerability classification than precedent algorithms applied to the problem. Moreover, an aggregated model of seismic vulnerability is implemented to investigate the worst possible situation imaginable for Tehran.
6. REFERENCES
Aghataher, R., M. Delavar and N. Kamalian. 2005. Weighing of contributing factors in vulnerability of cities against earthquakes. Map Asia Conference Jakarta, Indonesia, Aug. 13 2005, pp. 22-25.
Amiri, A., M.R Delavar, S. Zahrai and M. Malek. 2008. Earthquake Risk Assessment in Tehran Using Dominance-Based Rough Set Approach. Proc. the ISPRS Workshop on Geoinformation and Decision Support Systems, Tehran, Iran, Jan. 14 2008. pp. 13-26.
Ashtari, M., D. Hatzfeld and N. Kamalian. 2005. Microseismicity in the region of Tehran. Tectonophysics 395(3), pp 193-208.
Bargiela, A. and W. Pedrycz. 2003. Granular Computing: an Introduction. Kluwer Academic Publishers, Boston. 452p.
Berberian, M. and R. S. Yeats. 1999. Patterns of historical earthquake rupture in the Iranian Plateau. Bulletin of the Seismological Society of America 89(1), pp 120-139.
Berberian, M. and R. S. Yeats. 2001. Contribution of archaeological data to studies of earthquake history in the Iranian Plateau. Journal of Structural Geology 23(2), pp 563-584.
Boustan, E. and A. Shafiee. 2011. Fuzzy-Probabilistic seismic hazard assessment of Tehran region. Journal of the Earth 6(20), pp 17-29.
Hobbs, J. R. 1985. Granularity. Proc. the Ninth International Joint Conference on Artificial Intelligence, University of British Columbia, Vancouver, Canada, Aug 6-7 1985, pp. 432-435.
Jahanpeyma, M.H., Delavar, M.R., Malek, M.R., Kamalian, N., 2007, Analytical evaluation of propagation of uncertainty in assessment of seismic vulnerability of Tehran using geospatial information system , Proc. the 5th International Symposium on Spatial Data Quality, June 13-15 2007, Enschede, The Netherlands, pp. 25-32.
JICA. 2000. The study on seismic microzoning of the Greater Tehran Area in the Islamic Republic of Iran. Pacific Consultants International Report, OYO Cooperation, Japan 01, 390p.
Kappos, A., K. Stylianidis and K. Pitilakis. 1998. Development of seismic risk scenarios based on a hybrid method of vulnerability assessment. Natural Hazards 17(2), pp. 177-192.
Keet, C. M. 2008. A Formal Theory of Granularity, PhD Thesis, KRDB Research Centre, Faculty of Computer Science, Free University of Bozen-Bolzano, Italy. 298p.
Khamespanah, F., M. Delavar and M. Zare. 2013a. Uncertainty management in seismic vulnerability assessment using granular computing based on covering of universe. ISPRS-International Archives of the Photogrammetry, Remote Sensing and Spatial Information Sciences 1(1), pp. 121-126.
Khamespanah, F., M. R. Delavar, H. S. Alinia and M. Zare. 2013b. Granular Computing and Dempster–Shafer Integration in Seismic Vulnerability Assessment. Intelligent Systems for Crisis Management. S. Zlatanova, Peters, R., Dilo, A., Scholten, H., Springer, pp. 147-158.
Lin, T. Y. 2003. Granular computing. Rough Sets, Fuzzy Sets, Data Mining, and Granular Computing, Springer, pp 16-24.
Miao, D.Q. and S.D. Fan. 2002. The Calculation of Knowledge Granulation and its Application. Systems Engineering-theory & Practice 1, pp. 7-14.
Moradi, M., M. Delavar, B. Moshiri and F. Khamespanaha. 2014a. A novel approach to support majority voting in spatial group MCDM using density induced OWA operator for seismic vulnerability assessment. ISPRS-International Archives of the Photogrammetry, Remote Sensing and Spatial Information Sciences 1, pp. 209-214.
Moradi, M., M. R. Delavar and B. Moshiri. 2014b. A GIS-based multi-criteria decision-making approach for seismic vulnerability assessment using quantifier-guided OWA operator: a case study of Tehran, Iran. Annals of GIS 22(3), pp 1-14.
Mucciarelli, M., P. Contri, G. Monachesi, G. Calvano and M. Gallipoli. 2001. An empirical method to assess the seismic vulnerability of existing buildings using the HVSR technique. Pure and Applied Geophysics 158(12), pp. 2635-2647.
Nguyen, S. H., A. Skowron and J. Stepaniuk. 2001. Granular computing: A rough set approach. Computational Intelligence 17(3), pp. 514-544.
Panahi, M., F. Rezaie and S. Meshkani. 2013. Seismic vulnerability assessment of school buildings in Tehran city based on AHP and GIS. Natural Hazards and Earth System Sciences Discussions 1(5), pp. 4511-4538.
Pawlak, Z. 1982. Rough sets. International Journal of Computer & Information Sciences 11(5), pp 341-356.
Pedrycz, W., S. Bassis and D. Malchiodi. 2008. The Puzzle of Granular Computing, Springer.
Samadi Alinia, H. and M.R. Delavar. 2011. Tehran’s seismic vulnerability classification using granular computing approach. Applied Geomatics 3(4), pp. 229-240.
Shafer, G. 1992. The Dempster-Shafer theory. Encyclopedia of Artificial Intelligence, pp. 330-331.
Silavi, T., M. Delavar, M. Malek, N. Kamalian and K. Karimizand. 2006. An integrated strategy for GIS-based fuzzy
improved earthquake vulnerability assessment. ISPRS
International Symposium on ‘‘Geo-information for Disaster Management (Gi4DM), Goa, India, pp , Sep. 25-26 2006. 16-26.
van Lieshout, M. and A. Stein. 2012. Earthquake modelling at the country level using aggregated spatio-temporal point processes. Mathematical Geosciences 44(3), pp. 309-326.
Yao, Y. 2004. A partition model of granular computing. Transactions on Rough Sets I, Springer, pp 232-253.
Yao, Y. 2005. Perspectives of granular computing. IEEE International Conference on Granular Computing, Beijing, China, 25-27 July 2005, pp. 85-90.
Yao, Y. 2008. A Unified Framework of Granular Computing.
Handbook of Granular Computing. W. Pedrycz, A. Skowron and V. Kreinovich (Eds), John Wiley & Sons, pp. 401-410.
Yao, Y. Y. 2001. On Modeling data mining with granular computing. 25th Annual IEEE International Conference on Computer Software and Applications, Chicago, US, Oct. 8-12 2001, pp. 638-643.
Yaseen, M., N. A. Hamm, V. Tolpekin and A. Stein. 2013a. Anisotropic kriging to derive missing coseismic displacement values obtained from synthetic aperture radar images. Journal of Applied Remote Sensing 7(1), pp. 1-18.
Yaseen, M., N. A. Hamm, T. Woldai, V. Tolpekin and A. Stein. 2013b. Local interpolation of coseismic displacements measured by InSAR. International Journal of Applied Earth Observation and Geoinformation 23, pp. 1-17.
Zadeh, L. A. 1998. Some reflections on soft computing, granular computing and their roles in the conception, design and utilization of information/intelligent systems. Soft Computing-A Fusion of Foundations, Methodologies and Applications 2(1), pp. 23-25.
Zadeh, L. A. and J. Kacprzyk. 1999. Computing with words in Information/Intelligent systems 1: Foundations, Springer. 518p.
Zare, M., P.-Y. Bard and M. Ghafory-Ashtiany. 1999. Site characterizations for the Iranian strong motion network. Soil Dynamics and Earthquake Engineering 18(2), pp. 101-123.