ESTIMATING CARBON STOCK CHANGES OF MANGROVE FORESTS
USING SATELLITE IMAGERY AND AIRBORNE LiDAR DATA
IN THE SOUTH SUMATRA STATE, INDONESIA
Y. Maeda a,*, A. Fukushima a, Y. Imai a, Y. Tanahashi b, E. Nakama b, S. Ohta b, K. Kawazoe c, N. Akune c a
Kokusai Kogyo Co.,Ltd., 2-24-1 Harumicho Fuchu-City Tokyo, Japan - (yoshiko_maeda, ayumi_fukushima, yasuteru_imai)@kk-grp.jp
b
Japan International Forestry Promotion and Cooperation Center, Rinyu Bldg., 1-7-12 Koraku, Bunkyo-ku, Tokyo, Japan - (yuhei, eiichiro, otasei) @jifpro.or.jp
c
YL Forest Co., Ltd., 6-1 Chikkouhonmachi, Hakata-ku, Fukuoka-shi, Japan - (k_kawazoe, n_akune) @ylforest.co.jp
Commission VIII, WG VIII/7
KEY WORDS: LiDAR, Satellite imagery, Biomass, Carbon stock change, Mangrove forest
ABSTRACT:
The purposes of this study were 1) to estimate the biomass in the mangrove forests using satellite imagery and airborne LiDAR data, and 2) to estimate the amount of carbon stock changes using biomass estimated. The study area is located in the coastal area of the South Sumatra state, Indonesia. This area is approximately 66,500 ha with mostly flat land features. In this study, the following procedures were carried out: (1) Classification of types of tree species using Satellite imagery in the study area, (2) Development of correlation equations between spatial volume based on LiDAR data and biomass stock based on field survey for each types of tree species, and estimation of total biomass stock and carbon stock using the equation, and (3) Estimation of carbon stock change using Chronological Satellite Imageries. The result showed the biomass and the amount of carbon stock changes can be estimated with high accuracy, by combining the spatial volume based on airborne LiDAR data with the tree species classification based on satellite imagery. Quantitative biomass monitoring is in demand for projects related to REDD+ in developing countries, and this study showed that combining airborne LiDAR data with satellite imagery is one of the effective methods of monitoring for REDD+ projects.
1. INTRODUCTION
While efforts to prevent global warming is called for action around the world, REDD+ (an effort to reduce greenhouse gas emissions from deforestation and forest degradation in developing countries ) has gained attention as one of mitigation measures. Measurement, reporting, and verification (MRV) is particular emphasized when implementing REDD+ projects. Moreover, for measurement and verification, combination of ground surveys and remote sensing technology is required for estimating biomass with high accuracy. Using LiDAR is acknowledged as a remote sensing technique to estimate amount of biomass. However, there are only few case studies using LiDAR to measure biomass of mangrove forests. The purposes of this study were (1) to estimate the biomass in the mangrove forests using satellite imagery and airborne LiDAR data in the South Sumatra state, Indonesia, and (2) to estimate the amount of carbon stock changes using biomass estimated.
2. STUDY AREA AND PILOT AREA
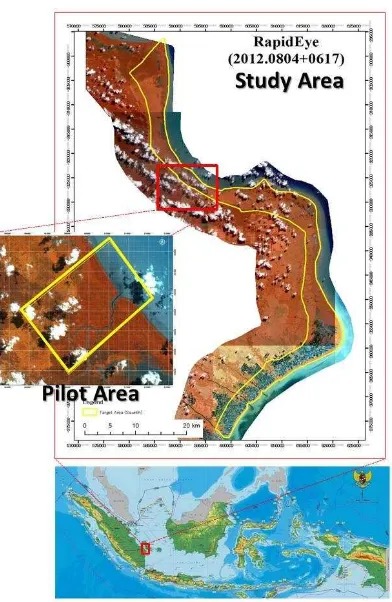
The study area is located in the coastal area of the South Sumatra state, Indonesia. This area is approximately 66,500 ha with mostly flat land features(Figure 1). And the pilot area of 2,100 ha was established within the study area.
Figure 1. Study area and pilot area The International Archives of the Photogrammetry, Remote Sensing and Spatial Information Sciences, Volume XLI-B8, 2016
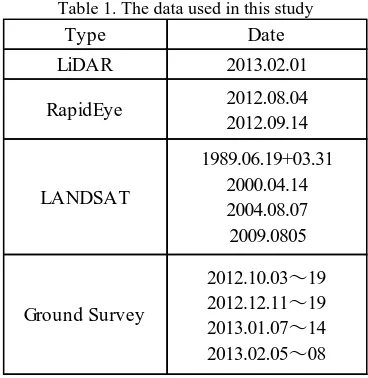
3. DATA USED The data used in this study are shown on Table 1.
Table 1. The data used in this study
3.1 LiDAR Data
RapidEye imageries were used for classification of types of tree species in the study area. Chronological LANDSAT imageries were used for estimation of carbon stock changes.
3.3 Ground Survey Data
Ground surveys were conducted at total of 178 plots, which 134 plots were arranged systematically, and 44 plots were established in the area which had typical vegetation. Shape and size of plots were set as shown on Fig.2 , based on the Standardized Research Method of Indonesia. Within each plot, DBH (Diameter at Breast Height) were measured for tree species without stilt roots, and for species with stilt roots (ex. Rhizophora sp.), diameter at 1.3m from the bottom of the mangrove trunk were measured. Position of the plots were measured by DGPS (Differential GPS) using Pro6H (Reference station) and ProXRT (Mobile station) from Trimble Co., Ltd.
Figure 2. Shape and size of plots
4. METHODS Step of the research is shown in Fig.3.
Figure 3. Steps of research
4.1 Classification of Types of Tree Species
Object-based image analysis was applied for classification of types of tree species. The following 8 types were set up as tree species, i.e. Major mangrove tree species of Rhizophora sp., Bruguiera sp. and Avicennia sp., widely distributed Melaleuca sp. and Nypa sp., and Grassland, Bare-land, Water. Rhizophora sp. and Bruguiera sp. were ecologically close species, and since the color pattern of the satellite imagery was also similar. As a reason, Rhizophora sp. and Bruguiera sp. were set up as 1 type, and were classified into 2 types for each density i.e. High Density Rhizophora sp. + Bruguiera sp. (hereinafter called “HD Rhizophora sp. + Bruguiera sp”), Low Density Rhizophora sp. + Bruguiera sp. (hereinafter called “LD Rhizophora sp. + Bruguiera sp”).
4.2 Estimation of Above Ground Biomass by Ground Survey
Allometric equations were applied to calculate the biomass stock of each plot.
Major mangrove tree species of Rhizophora sp., Bruguiera sp. and Avicennia sp. applied to the following equation, which proposed by Cheva (2005):
ln = - . + . ∗ ln � + ln ��
where AGB = Above Ground Biomass (kg/tree) DBH = Diameter at Breast Height (cm) WD = Wood Density (t/m3)
Melaleuca sp. applied to the following equation (T. K. VAN et al, 2000):
4.3 Correlation Analysis of Above Ground Biomass and Spatial Volume
The correlation of the spatial volume based on Lidar data and the above ground biomass based on ground survey was analysed according to types of tree species.
Airborne Lidar data can be divided to Digital Surface Model (DSM) and Digital Elevation Model (DEM). By product-sum operation of the difference of DSM and DEM (m) and plot area of Type C (i.e. Circle with a radius of 14m), the spatial volume (m3) of forest was calculated.
Correlation analysis were conducted at 110 plots which were dominated by Rhizophora sp. + Bruguiera sp., Avicennia sp., Melaleuca sp. or Nypa sp. among 170 plots ground survey conducted (Table3 ).
Table 3. Ground survey data
4.4 Estimation of Total Biomass Stock and Carbon Stock Total biomass stock of study area was estimated by conversion formula from the spatial volume to above ground biomass and area of types of tree species.
The below-ground biomass was calculated using the following equation shown in IPCC GPG for LULUCF (2003):
= exp − . + . ∗ ln ⁄
where BGB =Below Ground Biomass (tdm/ha) AGB = Above Ground Biomass (tdm/ha)
Then, a carbon stock was calculated by multiplying the total biomass by 0.5. Furthermore, a carbon stock factor was calculated by dividing the carbon stock by the area of each type of tree species.
4.5 Estimation of Carbon Stock Change
Carbon stock change of study area was estimated based on the product-sum operation of a carbon stock factor and area of types of tree species which it estimated by chronological LANDSAT satellite imagery.
5. RESULTS AND DISCUSSION
5.1 Classification of Types of Tree Species
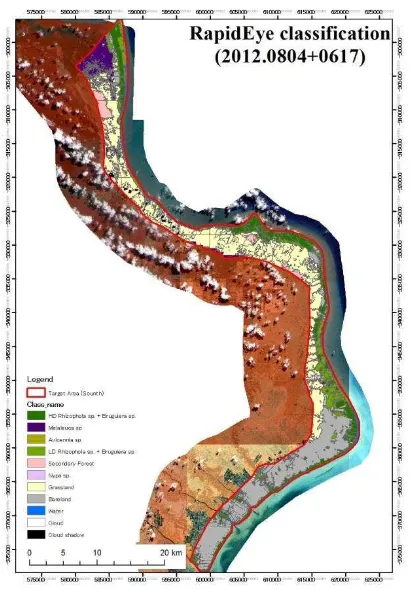
The result of classification of types of tree species using RapidEye imagery is shown in Fig.4.
Area from the coastline to about 2000m inland was covered with mangrove forests. This area was dominated in order of Avicennia sp. , Rhizophora sp. + Bruguiera sp. from the
coastline. In the inland area, communities of Nypa sp. were distributed along the river, and Melaleuca sp. and Grassland were widely distributed in the other area.
Figure 4. The result of classification of types of tree species
5.2 Estimation of Above Ground Biomass by Ground Survey
The amount of AGB of each plot which was calculated by allometric equations and ground survey data is shown in Fig.6. It was found that AGB of mangrove forests is relatively large.
5.3 Correlation Analysis of Above Ground Biomass and Spatial Volume
Distribution of spatial volume based on LiDAR data is shown in Fig.5. It was found that spatial volume of mangrove area was larger than other area.
Figure 5. Distribution of spatial volume based on LiDAR data Types of
Tree Species Number of Plots
Number of Plots Used for Correlation Analysis Rhizophora sp.+
Bruguiera sp. 71 68
Avicennia sp. 12 8
Mela leuca sp. 20 14
Nypa sp. 24 20
Other 51 0
Total 178 110
The result of correlation analysis of above ground biomass and spatial volume is shown in Fig.6, and the conversion equations from spatial volume to AGB are shown in Table 4.
In all types of tree species, direct proportional relationship between spatial volume and AGB were confirmed. Moreover, in all types of tree species, the correlation coefficient were high i.e. Rhizophora sp. + Bruguiera sp. is 0.802, Avicennia sp. is 0.851, Melaleuca sp. is 0.708 and Nypa sp. is 0.721.
Around 200t/ha has been reported as the upper limit of estimating AGB using backscattering coefficient of SAR. However, the method used in this research has no upper limit. Thus, the result showed that spatial volume analysis can be applied to high biomass area.
On the other hand, the slope of the regression equation differed greatly between the types of tree species. To increase the accuracy of the spatial volume method, it would require appropriate classification of types of tree species using satellite imagery.
Figure 6 . The result of correlation analysis
Table 4. Conversion equations
5.4 Calculation of Carbon Stock factor
Total biomass including BGB in the pilot area were estimated at 220,223 t d.m.. The carbon stock factor was calculated from total biomass and the area of each type of tree species (Table 5).
Table 5. Carbon stock factor
5.5 Estimation of Carbon Stock Change
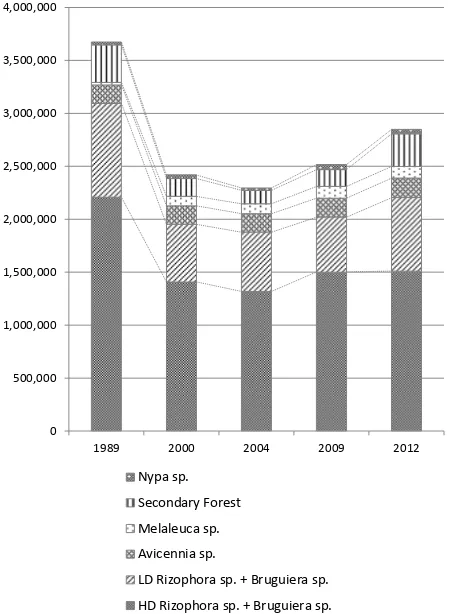
The result of classification of types of tree species, based on carbon stock factor and chronological satellite imageries, was used to calculate the changes of carbon stock over the years. The carbon stock has rapidly decreased about 1.25 million t-C from 1989 to 2000 due to development of aquaculture ponds. Since 2000, Rhizophora sp.+Bruguiera sp.in northern area, which once became bare land due to aquaculture pond development, gradually recovered, and carbon stock has gradually increased. However, carbon stock of 2012 is still about 825,000 t-C below 1989 level (Fig.7 and Table6).
Figure 7. Estimation of carbon stock change
Table 6. Estimation of carbon stock change
6. CONCLUTION
This study examined the biomass estimation method based on spatial volume calculated by LiDAR data at mangrove forest of the South Sumatra state, Indonesia. The result showed the biomass and the amount of carbon stock changes can be estimated with high accuracy, by combining the spatial volume based on LiDAR data with the tree species type classification based on satellite imagery. Therefore, this approach contributes to the reduction of ground survey plot required by REDD+. In addition, quantitative biomass monitoring is in demand for projects related to REDD+, and this study showed that
LD Rizophola sp.+ Bruguiera sp. 92.2
Avicennia sp. 170.0
LD Rizophora sp. + Bruguiera sp.
HD Rizophora sp. + Bruguiera sp.
(tC) 1989 2000 2004 2009 2012
HD Rizophora sp. + Bruguiera sp. 2,207,443 1,407,105 1,317,001 1,499,882 1,508,908 LD Rizophora sp. + Bruguiera sp. 885,467 544,811 560,630 520,117 694,933 Avicennia sp. 174,000 173,667 173,588 178,070 184,620 Melaleuca sp. 24,338 91,185 94,545 111,691 109,238 Secondary Forest 353,927 166,164 126,088 158,357 308,156 Nypa sp. 27,460 35,043 23,162 48,186 41,483 Total 3,672,634 2,417,975 2,295,013 2,516,303 2,847,339 The International Archives of the Photogrammetry, Remote Sensing and Spatial Information Sciences, Volume XLI-B8, 2016
combining airborne LiDAR data with satellite imagery is one of the effective methods of monitoring for REDD+ projects.
REFERENCES
Beaudoin, A., 1994. Retrieval of forest biomass from SAR data. International Journal of Remote Sensing, 15(4), pp.2777-2796.
Basyuni, M., Kusmana, C. and Siregar, J., 2002. Composition and species diversity of vegetation in mangrove production forest, Riau. Master thesis Ryukyu University
Cheva, J., Andalo, C., Brown, Cairns, M., A., Chambers, J., Q., Eamus, D., Folster, H., Fromard, F., Higuchi, N., Kira, T., Lescure, J., P., Nelson, B., W., Ogawa, H., Puig, H., Riera, B. and Yamakura, T., 2005. Tree allometry and improved estimation of carbon stocks and balance in tropical forests. Oecologia, 145, pp.87-99.
IPCC: Good Practice Guidance for Land Use, Land-Use Change and Forestry, 2003.
Ketterings, Q., M., Coe, R., Noordwijk, M., V., Ambagau., Y. and Palm C.A., 2001. Reducing uncertainty in the use of allometric biomass equations for predicting above-ground tree biomass in mixed secondary forests. Forest Ecology and Management, 146, pp.199-209.
Matue, K., Itoh, T. and Naito. K., 2006. Estimating forest resources using airbone LiDAR-Estimating stand parameters of Sugi (Cryptomeria japonica D. Don) and Hinoki (Chamaecyparis obtusa Endl.) stands with differing densities. Journal of the Japan Society of Photogrammetry and Remote Sensing, 45(1), pp.4-13.
Motohka, T., Shimada, M., Isoguchi, O., Ishihara, M., I. and Suzuki, N., 2011. Relationships between PALSAR backscattering data and forest above ground biomass in Japan. Proceedings of IGARSS 2011, pp3518-3521.
Van, T., K., Rayachhetry, B. and Center, T., D., 2000. Estimating above ground biomass of Melaleuca quinquenervia in Florida, USA. J. Aquat. Plant Manag, 38, pp.62-67.
Tanahashi Y., Nakama, E., Mori, T., Imai, Y., Arai, K., and Akune, N. 2013. Study of the method of estimating the biomass stock of the mangrove forest in the south sumatra state,
Indonesia through a ground survey(in Japanese㸧. Proceedings
of The 23rd Annual Meeting of the Japan Society of Tropical Ecology (JASTE23)A13
APPENDIX
This study was conducted as part of FY2012 Mitigation Project against Global Warming (Non-energy originated GHG Emission Reduction Project promoted for Technology Facilitating and Transference) FY2014 Feasibility studies towards visualization of contribution by Japanese companies for prevention from deforestation and degradation in developing countries (Ministry of Economy, Trade and Industry).