HOMOGENEOUS GEOVISUALIZATION OF COASTAL AREAS
FROM HETEROGENEOUS SPATIO-TEMPORAL DATA
A. Masse a, *, S. Christophe a
a
Institut National de l'Information Géographique et Forestière - Laboratoire Cogit, Université Paris-Est, 73 avenue de Paris, 94165 Saint-Mandé cedex, France - (antoine.masse, sidonie.christophe)@ign.fr
Commission II, WG II/6
KEY WORDS: Geovisualization, Style, Realism, DTM, Lidar, Coastline, Tides
ABSTRACT:
On coastal areas, recent increase in production of open-access high-quality data over large areas reflects high interests in modeling and geovisualization, especially for applications of sea level rise prediction, ship traffic security and ecological protection. Research interests are due to tricky challenges from the intrinsic nature of the coastal area, which is composed of complex geographical objects of which spatial extents vary in time, especially in the intertidal zone (tides, sands, etc.). Another interest is the complex modeling of this area based on imprecise cartographic objects (coastline, highest/lowest water level, etc.). The challenge of visualizing such specific area comes thus from 3D+t information, i.e. spatio-temporal data, and their visual integration.
In this paper, we present a methodology for geovisualization issues over coastal areas. The first challenge consists in integrating multi-source heterogeneous data, i.e. raster and vector, terrestrial and hydrographic data often coming from various ‘paradigms’, while providing a homogeneous geovisualization of the coastal area and in particular the phenomenon of the water depth. The second challenge consists in finding various possibilities to geovisualize this dynamic geographical phenomenon in controlling the level of photorealism in hybrid visualizations. Our approach is based on the use of a high-resolution Digital Terrain Model (DTM) coming from high resolution LiDAR data point cloud, tidal and topographic data. We present and discuss homogeneous hybrid visualizations, based on LiDAR and map, and on, LiDAR and orthoimagery, in order to enhance the realism while considering the water depth.
1. INTRODUCTION
The coastal zone is mainly composed by the intertidal region, which is very fragile and threatened by many human and un-human factors like erosion, storms, pollution, climate change, and urbanization. It is also constantly in motion, either by its covering by water or transfer, modification, or disappearance of those components (sand, rock falls, dunes, etc.) (Haslett, 2008). In coastal areas, the intertidal zone starts at the shoreline, just above the Highest Astronomical Tide mark (HAT) and finishes at the Lowest Astronomical Tide mark (LAT) (see Figure 1). An optimal coastal management is essential for its protection (shoreline evolution due to erosion, natural reserve protection, etc.) and for risk prevention (flooding, oil spill, etc.).
The coastal area is complex and contains highly variable spatio-temporal objects like tides and waves. Geographic data produced around this area differ from resolution, structure, pre-processing and representation choices, because coming from different mapping producers focusing on the sea part or on the land part. Therefore, geovisualization of the coastal area becomes complicated due to heterogeneous datasets, usages and producers. A challenging aspect is to consider two essential spatio-temporal objects for the visualization: the sea/land interface and the water depth. The sea/land interface is often depicted in a static way in existing coastal visualizations, as several objects such as rocks and sandbanks which are dynamic in space and time, as well as the water depth also depicted in a static way and often with contour lines.
* Corresponding author
Therefore, it is necessary to add tidal information to obtain real water depth at a chosen time. However, with new high resolution Digital Terrain Model (DTM) from bathymetric and airborne LiDAR (Light Detection and Ranging) surveys and precise tidal data observations and predictions, a precise integration of water depth, is now possible, in order to provide a correct perception of the seabed. Another challenging aspect is to propose tools and parameterization technics to render coastal information in order to introduce more photorealism and improve the user perception of the coastal area.
In this paper, our motivation is to propose a generic methodology to select, enrich and render heterogeneous geographic data, in order to propose homogeneous geovisualizations of the coastal area. The first part proposes a review of related research works and existing geovisualizations of coastal areas. In the second part, we present our methodology for geovisualization issues: integration, enrichment and rendering of heterogeneous data. Geovisualizations of the water depth, based on LiDAR/maps and on LiDAR/orthoimage, are finally presented and discussed.
2. STATE-OF-THE-ART
A geovisualization is defined as the “creation and use of visual representation to facilitate thinking, understanding and knowledge construction” (Longley, 2005). We here focus on the geovisualization of coastal areas and consider how being able to control their level of realism is relevant to understand a phenomenon such as water depth.
Figure 1: Illustration of the intertidal area, between the drying line and the coastline.
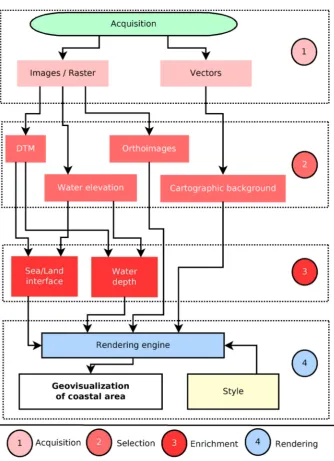
Figure 2: General method for coastal area geovisualization
2.1 Geovisualization of spatio-temporal phenomena in coastal areas
Coastal geovisualization are diverse, we can mention works about sea level rise, which represent a large part of coastal geovisualization (Nicholls and Cazenave, 2010; Yang et al., 2014). We can also cite works about flooding and tsunami prevention (Allen et al., 2010; Leone et al., 2014), tourism and planning (Sardá et al., 2005; Yang et al., 2012), ocean current modeling (Mengguo et al., 2000) or seabed monitoring (Tateosian et al., 2014). We propose to separate these geovisualizations into four categories: (1) static geovisualization i.e. visualized objects are static and do not represent a dynamic phenomenon (see example in Figure 4); (2) static geovisualization of dynamic objects, i.e. static visualization from one or several dynamic spatio-temporal elements (Yang et al., 2014); (3) interactive visualizations of dynamic elements i.e. users can interact and modify one or several characteristics like the water level1 ; and (4) dynamic visualizations i.e. with animated objects (Andrienko et al., 2008; Bertin, 1967; Keim et al., 2008). We aim at designing a tool to visualize dynamically the phenomenon of water depth: our first step is to prepare the required heterogeneous data and their visual integration in intermediary visualizations of a global animation.
2.2 Integration of heterogeneous data and rendering to increase realism of geovisualizations photo-realistic artificial reality using a synthetic orthophotograph. In the case of a non-photorealistic rendering, one of the inspiration sources of cartographic realism is to use real-world observational data (Patterson, 2002). These different aspects of realism associated with mapping and visualization are the level of detail, the symbolization realism, immersion and interactivity of representation, etc. (MacEachren and Kraak, 2001). Enhancing realism in visualization may also benefit from the introduction of expressive textures. For the coastal area, use of textures is limited to objects with low spatio-temporal variations, such as rocks (Loi et al., 2013), vegetation (Hurtut et al., 2009) or dynamics of ocean currents (Semmo et al., 2013; Yu et al., 2011). Hoarau and Christophe (2015) propose interpolation methods of colors, and, natural and procedural textures to control the level of photorealism in a continuum between orthoimagery and vector data: a specific use case on a coastal area allows visualizing the relevancy of controlling realism to attempt better efficient geovisualizations.
Patterson (2002) defines several rules to bring realism to the visualization. These rules include data selection, use of textures and rendering parameterization. The first step to accurately represent the sea is to use a high-resolution DTM, which will then be used to support mapping elements or tidal information. The primary remote sensing data for DTM production include aerial and satellite images, Interferometric Synthetic Aperture Radar (IfSAR) data, and LiDAR data (Hu, 2003). Wide-area analyze morphological changes of coastline. Hardin et al. (2014) use high resolution DTM from LiDAR data to visualize coastal landscape dynamics. Poulter and Halpin (2008) show that DTMs derived from LiDAR elevation data provide an additional benefit by allowing multiple, or transient, sea-level-rise scenarios to be evaluated. Allen et al. (2010) present geovisualization strategies for flood risk management and conclude on the necessity to have a high resolution DTM in coastal area for a good communication of risks through geovisualizations. Depraetere and Dahl (2007) conclude with the fact that bathymetric data provide a more accurate depiction of landforms for physical modelling related to coastal applications. These studies and their applications show the interest of high resolution DTM from LiDAR data for analysis and visualization of the coastal area. The combination of topographic LiDAR data on land and bathymetric LiDAR data at sea appears as an interesting solution for DTM generation in coastal areas due to its high precision (Louvart and Grateau, 2005; Pastol et al., 2007).
A cartographic style is considered as a specific manner to render geographical information, due to the specific history and practice of cartography according to various uses of “content and appearance” (Beconyte, 2011; Benová and Pravda, 2009; Kent, 2009). The rendering parameterization allows transmitting essential information using visual characteristics and cognitive mechanisms (Ory et al., 2013). This parameterization is made possible by OpenGIS® Standards of Open Geospatial Consortium (OGC): Styled Layer Descriptor standard (SLD) (Lupp, 2007) and the Symbol Encoding standard (SE) (Müller, 2006). Users can also be guided in the color choice and parameterization using specific tools, i.e. ColorBrewer (Harrower and Brewer, 2003) or ColorLegend (Christophe, 2011). For the representation of the sea in coastal areas, it is important to define a consistent stylization over land and sea (Patterson, 2014). We assume that a homogeneous coastal geovisualization may provide an efficient and coherent representation of a complex area over both land and sea, especially in the intertidal zone.
2.3 Our purpose
We assume that the geovisualization of the coastal area may be improved by adding new data that have shown a significant contribution in accuracy and quality of information transmission: a DTM obtained from airborne and bathymetric LiDAR survey and the tidal information. The first difficulty is to integrate this data to the others, so to handle the heterogeneity of data. The second difficulty is to add realism to the coastal geovisualization. We propose to enrich these new data to represent real dynamic phenomena such as water depth and sea/land interface, based on tidal statements.
3. METHODOLOGY FOR HOMOGENEOUS GEOVISUALIZATION OF WATER DEPTHS
We propose a methodology to solve the following problem in geovisualization of coastal areas: How could we obtain homogeneous geovisualizations of coastal areas with heterogeneous spatio-temporal data? Our methodology, presented in Figure 2 is composed of four main steps:
Step 1: Data acquisition. At first, data are acquired (raster or vector data, observations, predictions) and preprocessed (geometric corrections, interpolation, etc.). Typically, these operations are carried out by national mapping agencies producing geographical information.
Step 2: Data selection. From these databases, we select the data we want to visualize. In particular, to estimate and represent the water depth and the sea/land interface, we need two main information sources: a Digital Terrain Model (DTM) for terrain elevation information (submarine or not) and water elevation information provided by tidal observation agencies. In the case of viewing the coastline, we need a highly accurate DTM obtained from airborne and bathymetric LiDAR data. The water level is obtained from observed or predicted tidal information and interpolated for each water point on the globe at a time t (day / hour / minute).
Step 3: Data enrichment. The purpose of this step is to enrich the existing data to obtain the water depth and the sea/land interface. The water depth is obtained by computing the difference between the water elevation and the terrain elevation. The calculation of the sea/land interface is obtained from the two data presented in step 2 and by performing the intersection of the ground surface and the water surface. The result is thus a line between land and sea at a chosen time. The precision of these two enriched data therefore depends on the precision of the elevation model and the water depth estimation.
Step 4: Rendering. To visualize these data, we use a renderer that we parameterize with the help of a SLD, in order to describe each representation for each rendered layer.
4. APPLICATIONS
To illustrate and test our methodology, we present several results of coastal geovisualization at different water elevation. To render the new water depth, it is useful to use the parameterization according to the standards of the SLD and rendering capabilities provided by its parameter ColorMap
enabling assigning colors, color schemes or color gradients for selected values or ranges of values, which in our case are water depths. The use of color interpolation option in the parameter
ColorMap between several depth values allows obtaining a continuous rendering, as opposed to using hypsometric tints. We used QGIS® rendering engine, but our method is applicable to any software using the SLD standard.
Both proposed applications include hybrid geovisualization of LiDAR data (through the use of a DTM): the first hybrid with a map and the second hybrid with an orthoimage. We use a color palette considered as conventional for the first application based on cartographic standards, and natural for the second, based on the extracted colors of the orthoimage. Our purpose is to observe the visual effect of the integration of our new stylized data on the level of consistency and realism of the geovisualization.
4.1 Dataset and implementation
We choose an area of 25 km² in the city of Lanildut, Finistère, France. This place has been chosen for its particular topography -- estuary, preserve littoral, submerged/emerged rocks unsafe for navigation, high tidal range – and a variety of local uses – sailing, trekking, touring, fishing activities, etc. Beaches and rocks are moistened by the Atlantic Ocean. The tidal range is important in this area: about 8 meters. To enrich the coastal
geovisualization, a cartographic database is used, composed by topographic and hydrographic information. These data are usually provided with legends from national mapping standards for colors and symbols (IGN2 and SHOM3). To summarize, we have the following data in our test area:
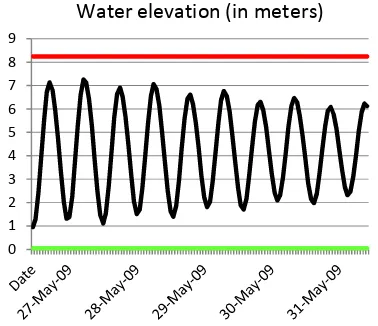
- DTM from Lidar data point cloud. - Tide prediction for Lanildut harbor. - Topographic vector data. provides free access to sea level data and products (observation, prediction, storm surge) slightly time-delayed (updated every hour), see Figure 3.
Figure 3: Water elevation estimation in meters at Lanildut harbor between May 27th and 31th of 2009, Highest Astronomical Tide Mark in red, Lowest Astronomical Tide
Mark in green
4.2 Application 1: hybrid geovisualization LiDAR and map
Currently, ScanLittoral® map is available for the French coastline (land and sea, see Figure 4), as a juxtaposition of the topographic map for the land and a nautical chart for the sea. The result mainly implies a visual heterogeneity of both sides of the coastline due to different levels of visual complexity and generalization, diversity and overlapping of symbols, due to the different purposes of both maps. No preprocessing method is applied on each map to maintain a certain homogeneity in the visual rendering. In order to improve the sea part visualization of existing maps, the official legend of the International Hydrographic Organization (IHO) marine charts has been used as an inspiration source to set up the water depth rendering parameters. The color parameterization is defined in Table 1.
Depth (m) 0 -5 -10 -20
Color #6fbeba #b3d9ff #cbf0ff #fefefe
Table 1. Color palette from official hydrographic chart (IHO)
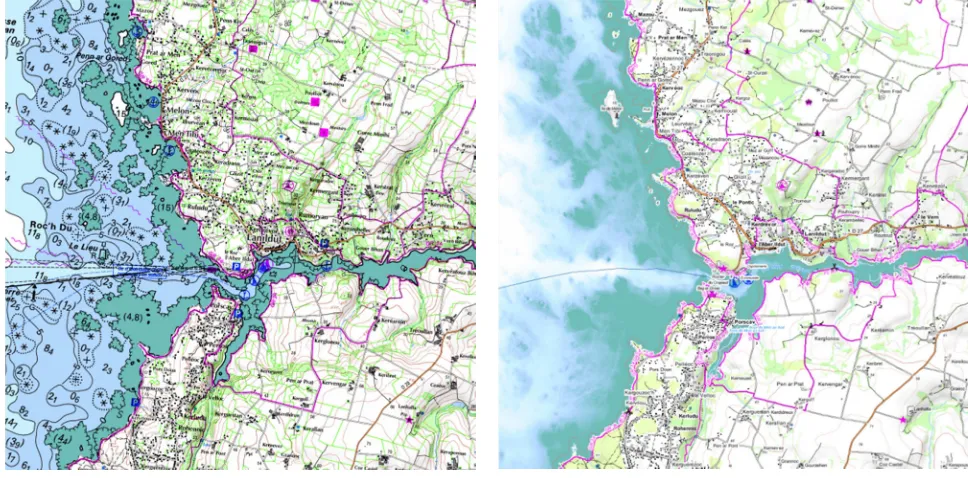
Figure 4. ScanLittoral® map, scale 1:25,000 Figure 5. Resulting geovisualization of application 1, scale 1:25,000
Figure 6. BdOrtho® 50cm orthoimage Figure 7. Resulting geovisualization from application 2 (sea part) and BdOrtho® 50cm (land part)
Depth intermediary colors are then obtained by linear interpolation. Resulting geovisualization (see Figure 5) is compared with the ScanLittoral® map (see Figure 4). Our geovisualization appears more realistic, it provides a better view of reality with a continuous rendering and distinction of the seabed.
4.3 Application 2: hybrid geovisualization LiDAR and orthoimage
In the case of coastal orthoimages and especially within the sea part, several phenomena can occur and cause visualization irregularities: water level, color, brightness, texture, etc. (see Figure 6 ). To correct these problems, we propose to replace the sea part of orthoimage by data enriched and stylized by our
method: water depth and sea/land dynamics. We were inspired by the sea colors extracted manually from orthoimage (see Table 2). The result is shown in Figure 9, the orthoimage is kept for the land part. The result is similar to the reality from the “good” parts of the orthoimage and corrects its irregularities on the other parts. The perception of the seabed adds meaning to the orthoimage and thus enables better transmission of information on the sea part.
Depth (m) 0 -5 -10 -20
Color #263641 #4A7570 #26454F #273D4C
Table 2. Color palette extracted from the orthoimage The International Archives of the Photogrammetry, Remote Sensing and Spatial Information Sciences, Volume XL-3/W3, 2015
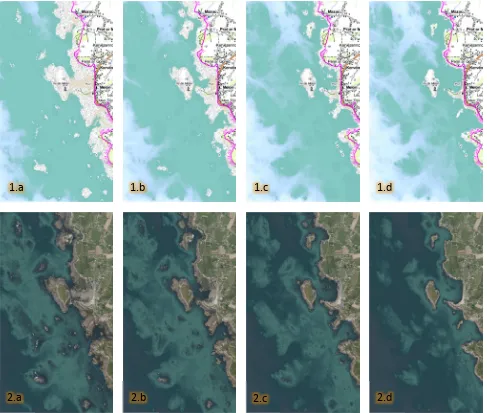
Figure 8. Evolution of the sea/land interface and the water depth at different water elevations/time of the day 05/28/2009 (see Figure 3) for application (1) and (2): (a) 1.4 meters, 14h00 (b) 3 meters, 15h30 (c) 5 meters, 16h45 and (d) 7 meters, 19h00
4.4 Illustration of rendering evolution depending on water elevation
Figure 8 shows evolution of the geovisualization based on the water elevation. In both applications, hybrid visualization of LiDAR/map (1.a to 1.d) and Lidar/orthoimage (2.a to 2.d), we observe changing colors and evolution of sea/land separation related to water elevation moves. This evolution brings more realism and credibility to the geovisualization and information it transmits to users, especially for tip/top rocks and perception of seabed. To go further in application 2, we see that depth information is not sufficient to precisely represent the sea part and we should add knowledge of the seabed nature, water composition or even modeling currents in order to simulate more realistically the sea part of the ortho-image.
5. CONCLUSION AND PERSPECTIVES
We can make several conclusions about applications of the proposed rendering method: (1) the use of more precise data positively affects the perception of realism, including the perception of seabed and submerged/emerged areas, which enhances the credibility of the transmitted information through
the geovisualization, (2) the method is generic, independent of data (orthoimage or cartographic information), (3) the rendering parameterization can be adapted to particular cases of applications, only the style is different in our applications and can be adapted to enhance the realism, and (4) the method allowed a visual heterogeneous data integration, with a homogeneous rendering. Our applications also open new use cases of the geovisualization of coastal area, hiking can now take into account the dynamics of the sea/land interface, but also other uses such as fishing or swimming, etc.
Three major perspectives are considered. The first is related to the integration of the various steps of our method in GeOxygene (Open source platform, OpenGL version developed within the Mapstyle ANR-project) which allow expressive rendering for stylization and realism improvement in geovisualization. The second perspective concerns evaluation of geovisualization including choice of styles and their impact on the level of realism perceived by users. This evaluation will be based on evaluation protocols introduced by Hoarau (2015) from a panel of expert users. The third perspective concerns the validation of the reproducibility of our method with the same type of data (LiDAR, orthoimage, map) but from different sources.
1.a
1.b
1.c
1.d
2.a
2.b
2.c
2.d
ACKNOWLEDGEMENTS
This work is supported by the French National Research Agency, MapStyle project [ANR-12-CORD-0025]. We would like to thank IGN and REFMAR projects for providing data.
REFERENCES
Allen, T., Sanchagrin, S., Lee, N., 2010. Geovisualization Strategies To Analyze and Communicate Inundation Risk From Storm Surges, pp. 1–5.
Andrienko, G., Andrienko, N., Dykes, J., Fabrikant, S.I., Wachowicz, M., 2008. Geovisualization of dynamics, movement and change: key issues and developing approaches in visualization research. Information Visualization 7(3-4), 173– 180.
Beconyte, G., 2011. Cartographic styles: criteria and parameters, Proc. of the 25th International Cartographic Conference (ICC 2011), Paris, France, 3-8.
Benova, A. and Pravda, J. (2009). Cartography and Art: Map Style. Lecture Notes in Geoinformation and Cartography. Springer Berlin Heidelberg, 145-154.
Bertin, J., 1967. Sémiologie graphique : Les diagrammes-Les réseaux-Les cartes, Mouton & Cie ed. Gauthier-Villars, Paris, France.
Bouatouch, K., Bouville, C., 2013. Photorealism in Computer Graphics. Springer Science & Business Media, Springer Verlag Berlin Heidelberg, 232p.
Christophe, S., 2011. Creative colours specification based on knowledge (ColorLegend System). The Cartographic Journal 48(2), 138–145.
Dachsbacher, C., Bolch, T., Stamminger, M., 2006. Procedural reproduction of terrain textures with geographic data. Til Aach and Rudiger Westermann. Vision, Modeling and Visualization (VMV 2006), Nov 2006, Aachen, Germany. IOS Press, 105-Susceptible to Erosion MacRidge, Training Area J, Fort Bragg, NC.
Haller, M., 2004. Photorealism or/and Non-photorealism in Augmented Reality, VRCAI '04 Proc. of the 2004 ACM SIGGRAPH. ACM New York, USA, 189–196.
Hardin, E., Mitasova, H., Tateosian, L., Overton, M., 2014. GIS-based Analysis of Coastal Lidar Time-Series. Springer New York, New York, NY.
Harrower, M., Brewer, C.A., 2003. ColorBrewer. org: an online tool for selecting colour schemes for maps. The Cartographic Journal 40(1), 27–37.
Haslett, S., 2008. Coastal Systems. Routledge, London. 240p.
Hoarau, C., Christophe, S., 2015. Color and textures interpolation for homogeneous sliding between orthoimagery and vector data, ISPRS Annals of the Photogrammetry, Remote Sensing and Spatial Information Sciences, Vol. II-3/W5.
Hoarau, C., 2015. Représentations cartographiques intermédiaires - Comment covisualiser une carte et une orthophotographie pour naviguer entre abstraction et réalisme ? PhD Thesis in GI Sciences, Paris-Est University.
Hu, Y., 2003. Automated extraction of digital terrain models, roads and buildings using airborne LiDAR data. PhD Thesis University of Calgary, Alberta, CA.
Hurtut, T., Landes, P.-E., Thollot, J., Gousseau, Y., Drouillhet, R., Coeurjolly, J.-F., 2009. Appearance-guided Synthesis of Element Arrangements by Example, NPAR 2009 - 7th International Symposium on Non-Photorealistic Animation and Rendering, New. Orleans, LA, United States, Aug 2009. ACM, pp. 51–60.
Keim, D., G. Andrienko, J.-D. Fekete, C. Görg, J. Kohlhammer and G. Melançon (2008). Visual Analytics: Definition, Process, and Challenges. In: Information Visualization: Human-Centered Issues and Perspectives (Editors: Andreas Kerren, John T. Stasko, Jean-Daniel Fekete, Chris North), Lecture Notes in Computer Science 4950, pp. 154-175, Springer.Kent, A., 2009. Topographic Maps: Methodological Approaches for Analyzing Cartographic Style. Journal of Map & Geography Libraries 5(2), 131-156.
Leone, F., Péroche, M., Gutton, R., 2014. Le risque tsunami en Martinique : planifier une évacuation préventive en optimisant l’accessibilité de sites refuges. VertigO - la revue électronique en sciences de l'environnement 14.
Loi, H., Hurtut, T., Vergne, R., Thollot, J., 2013. Discrete texture design using a programmable approach, ACM SIGGRAPH 2013 Talks, Anaheim, CA, USA. ACM Press, p. 1.
Longley, P.A., Goodchild, M.F., Maguire, D.J., Rhind, D.W., 2005. Geographic Information Systems and Science (Second edition). Chichester: Wiley.
Louvart, L., Grateau, C., 2005. The Litto3D Project. Oceans 2005 - Europe 2, IEEE, pp. 1244–1251.
Lupp, M., 2007, “Styled Layer Descriptor profile on the Web Map Service Implementation Specification”, Version 1.1.0 (revision 4), OGC 05-078r4, Open Geospatial Consortium.
Available online:
http://portal.opengeospatial.org/files/?artifact_id=22364 [Last accessed: 9 July 2015]
MacEachren, A.M., Kraak, M.-J., 2001. Research challenges in geovisualization. Cartography and Geographic Information Science 28(1), 3–12.
Mengguo, L., Dongming, C., Zheng, Z., Bei, L., 2000. A 2D Tidal Current Visualization Mathematical Model for Coastal and Estuarine Waters. Marine Science Bulletin-Tianjin 19, 57– 65.
Müller, M., 2006, “Symbology Encoding Implementation Specification”, Version 1.1.0 (revision 4), OGC 05-077r4, Open Geospatial Consortium. Available online: http://portal.opengeospatial.org/files/?artifact_id=16700 [Last accessed: 9 July 2015]
Nicholls, R.J., Cazenave, A., 2010. Sea-level rise and its impact on coastal zones. Science 328 (5985), 1517–1520.
Ory, J., Christophe, S., Fabrikant, S.I., 2013. Identification of styles in topographic maps, Proc. of the 26th International Cartographic Conference (ICC 2013), Dresden, Germany, 2013 25–30 Aug.
Pastol, Y., Le Roux, C., Louvart, L., 2007. LITTO3D: a seamless digital terrain model. The International hydrographic review 8, 38–44.
Patterson, T., 2002. Getting Real: Reflecting on the New Look of National Park Service Maps. Cartographic Perspectives 43, 43-56.
Patterson, T., 2014. Mountains Unseen: Developing a Relief Map of the Hawaiian Seafloor. Cartographic Perspectives 76, 5-18.
Poulter, B., Halpin, P.N., 2008. Raster modelling of coastal flooding from sea-level rise. International Journal of Geographical Information Science 22(2), 167–182.
Sardá, R., Avila, C., Mora, J., 2005. A methodological approach to be used in integrated coastal zone management processes: the case of the Catalan Coast (Catalonia, Spain). Estuarine, Coastal and Shelf Science 62(3), 427-439.
Semmo, A., Kyprianidis, J.E., Trapp, M., Döllner, J., 2013. Real-Time Rendering of Water Surfaces with Cartography-Oriented Design, Proc. International Symposium on Computational Aesthetics in Graphics, Visualization, and Imaging (CAe), Anaheim, CA, USA, 5–14.
Tateosian, L., Mitasova, H., Thakur, S., Hardin, E., Russ, E., Blundell, B., 2014. Visualizations of coastal terrain time series. Information Visualization 13(3), 266-282.
White, S.A., Wang, Y., 2003. Utilizing DEMs derived from LIDAR data to analyze morphologic change in the North Carolina coastline. Remote sensing of environment 85, 39–47.
Yang, B., Madden, M., Kim, J., Jordan, T.R., 2012. Geospatial analysis of barrier island beach availability to tourists. Tourism Management 33, 840-854.
Yang, Z., Wang, T., Cline, D., Williams, B., 2014. Hydrodynamic Modeling Analysis to Support Nearshore Restoration Projects in a Changing Climate. Journal of Marine Science and Engineering 2, 18-32.
Yu, Q., Neyret, F., Bruneton, E., Holzschuch, N., 2011. Lagrangian texture advection: Preserving both spectrum and velocity field. Visualization and Computer Graphics, IEEE Transactions on Visualization & Computer Graphics 17(11), 1612–1623.