CLASSIFICATION OF URBAN SETTLEMENTS TYPES BASED ON SPACE-BORNE
SAR DATASETS
T. Novack*, U. Stilla
Technische Universitaet Muenchen, Faculty of Civil, Geo and Environmental Engineering, 80333 Munich, Germany - (tessio.novack, stilla)@tum.de
Commission VI, WG VI/4
KEY WORDS: Urban structures types, Synthetic Aperture Radar, Feature selection, Histogram of Oriented Gradients
ABSTRACT:
In this work we focused on the classification of Urban Settlement Types (USTs) based on two datasets from the TerraSAR-X satellite acquired at ascending and descending look directions. These data sets comprise the intensity, amplitude and coherence images as well as binary images representing man-made structures. In accordance to most official UST maps, the urban blocks of our study site were considered as the analysis units. The urban blocks were classified into Vegetated Areas, Single-Family Houses and Commercial and Residential Buildings. As image attributes, Histogram of Oriented Gradients (HOGs) calculated in nine angles out of each image of our dataset were used. The descriptive statistics of the geometrical features of man-made structures inside the blocks were also used as image attributes. The pertinence of HOGs features for the concerning classification task is corroborated by feature selection algorithms used in the quantitative exploratory analysis of the attributes. 76% of 1926 blocks were correctly classified and a Kappa index of 0.60 was obtained. As in some of the urban blocks from our study site more than one UST class are found, we propose a method for detecting blocks with mixed classes and segmenting them into more objects whose classification becomes hopefully more stable and accurate.
* Corresponding author. This is useful to know for communication with the appropriate person in cases with more than one author.
1. INTRODUCTION
1.1 Urban Structure Types
Efficient urban planning and monitoring actions heavily rely on the spatial distribution of the city’s different settlements types. Waste production, traffic management, water and energy consumption are just a few socio-economic and environmental planning categories that should be tailored according to the spatial distribution of these different settlement types.
In Germany, the term Urban Structure Types (USTs) (Stadtstrukturtypen) was conceived in the nineties to categorize these different urban settlements. Since then, this concept has been used as the main spatial indicator used in urban planning and monitoring actions in this country and others.
Although there is no universally accepted definition of the term, USTs are usually understood as combining social and cultural aspects with the contextual and physical structure of the different settlements. More formally, USTs are characterized by: (1) the geometry, density and spatial configuration of buildings; (2) their social, cultural and economic usages (e.g. residential, commercial, industrial, amusement etc.) and (3) their environmental properties like the presence and type of vegetation and water bodies (Pauleit and Duhme (2000) and Heiden et al. (2012)).
1.2 Related Works and Our Contribution
Despite the tremendous potential of remote sensing data for rapidly providing accurate and inexpensive information on USTs, there haven’t been many works explicitly devoted to their automatic detection and classification based on remote sensing data. Most of these works have utilised multispectral
(Banzhaf and Höfer, 2008; Wurm et al., 2009; Huck et al., 2011; Wade et al., 2014), hyperspectral (Heldens, 2010; Heiden et al., 2012) imagery or simply some elevation data or vector dataset of the buildings (Steiniger et al., 2008; Yu et al., 2010; Wurm and Taubenboeck, 2010).
A common approach seems to be to extract first land cover objects and then, according to certain measures of their structure inside a spatial parcel (usually the urban blocks), estimate its UST. Huck et al. (2011) classified USTs at the block-level hierarchically applying thresholds on the relative area and density of land cover classes inside the blocks. Wade et al. (2014) also proposed the classification of USTs based on the topology of land cover objects extracted inside urban blocks. The topology is described by different measures of neighbourhood-graphs, which are then submitted to a random forest classifier. Heiden et al. (2012) used airborne hyperspectral and elevation data to map the USTs of Munich (Germany). They first perform land cover classification and correct it using elevation data, which is also used to derive urban volume indicators.
Topographic maps and cadastral data on buildings in vector format have also been used for deriving the USTs of urban blocks. Steiniger et al. (2008) used cadastral vector data of the buildings from Zurich (Switzerland) and their morphological and contextual properties to distinguish USTs based on the results of different classifiers. They rely on the assumption that buildings from a same UST have similar shape and distances between each other. Hecht et al. (2013) extracted building footprints from topographic maps and classified them according to a considered building typology. Following, urban blocks are classified into USTs depending on the dominating building type.
Without ever mentioning the term USTs, different research groups have tried to distinguish different types of urban settlement types based on medium-resolution Synthetic Aperture Radar (SAR) data. These works rely most of the times on textural attributes and simple backscattering measures (Weydahl, 2002; Dekker, 2003; Dell’Acqua and Gamba, 2006). Hoefner et al. (2009) in the other hand proposed jointly using high-resolution SAR and multispectral data to classify USTs. They suggest the use of a set of rules for USTs classification, which can be later improved based on textural features from SAR imagery. Nevertheless, they presented only very initial results.
From this brief overview, it is possible to notice that the classification of UST based solely on high-resolution SAR imagery has explicitly not been tried yet. Motivated by that, we investigated the feasibility of automatically classifying USTs based on high-resolution space-borne SAR data from ascending and descending look directions. Since the information content of SAR data is heavily related to the geometrical properties of the surface objects, we assume such data can be used to attain this goal. Differently from our previous research efforts in this direction (Novack and Stilla, 2014), we focus in this paper rather on the exploratory analysis of expressive SAR image attributes used on more realistic classification scenarios
2. METHODS
2.1 Semantic Grouping of UST Classes
Based solely on remote sensing data, it is very hard to distinguish two UST classes that do not differ on their physical aspects but only on their land use. Also, some UST classes are very specific on their land use and physical structure, what makes them rarely found on the urban area. Hence, in order to keep our experiments on a solid basis, we decided to exclude from our analysis these few rare and very specific classes and to group the remaining ones into three semantically broad USTs, namely: Parks and Vegetated Areas, Single-Family Houses and Commercial and Residential Buildings.
2.2 Data Preparation and Image Partitioning
For the realization of our experiments, two interferometric datasets from the TerraSAR-X satellite from the city of Munich (Germany) were used, being one of these datasets acquired at ascending look direction and one at descending look direction. All images were acquired in High-Resolution Spotlight mode, which yields a spatial resolution of approximately 1,1 m. Each dataset comprises the intensity and amplitude images from the master acquisition, as well as the computed coherence image. All images were kept in their original acquisition geometry, so that no information distortion was caused by re-projecting them.
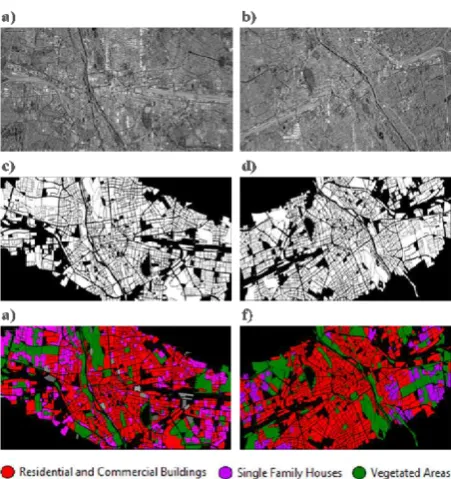
The first step of our processing chain was the partitioning of the images into image objects. The images were partitioned according to the vector data from the streets, river and railroad tracks by the simple superposition of both datasets. In other words, our image objects coincide with the urban blocks of Munich. This information was obtained in shapefile format from the prefecture of Munich (Munich, 2014). This file contains also the official UST map of Munich and was thus used as ground truth at the stage of evaluating our results. Figure 1 shows the master intensity images from the ascending and descending datasets, the urban blocks found on the common area of the two acquisitions, as well as the ground truth map projected to each of the datasets.
Figure 1. The ascending and descending SAR intensity images (a and b); the urban blocks of the study are common to the two acquisitions (c and d) and the ground truth map projected over
the two scenes (e and f).
2.3 Image Attributes
It is not easy to discover expressive image attributes for the classification of USTs. This task becomes even more difficult when deriving these attributes from SAR images. Ideally the attributes must express the contextual, geometrical and spectral structure of the whole block in order to be informative regarding its probable USTs. In this work we opted to explore the potential of Histograms of Oriented Gradients (HOGs) features. HOGs are a powerful image descriptor used for detecting human beings in computer vision applications (Dalal and Triggs, 2005), whose potential as attributes for classifying remote sensing imagery has not yet been extensively exploited. For each urban block, the HOGs feature were calculated in nine directions out of the intensity and amplitude images, as well as out of the binary images produced by a feature extraction process for detecting man-made structures.
This feature extraction procedure consisted simply on applying a threshold on the amplitude images. Several thresholds were tested. They were defined globally, i.e. for the whole image, and locally, i.e. for each block, by calculating their 0.7 quantiles. Following, other attributes were calculated out of these binary images. These attributes regard the mean, the standard deviation and the maximum value of the geometrical attributes from the man-made structures inside each block. Some of these attributes are: compactness, rectangular fit, direction of main line, length/width etc. Figure 2a shows a section of a feature extraction image on which, for each feature, different geometrical attributes can be calculated. Following, we can aggregate these values to the urban block-level by calculating its descriptive statistics (Figure 2b).
Figure 2. Examples of image attributes used for UST classification. First geometrical attributes are calculated for each extracted feature (a) then descriptive statistics of these values are calculated as a way to aggregate the information to
the block level.
2.4 Attribute Selection and the Classification Strategy
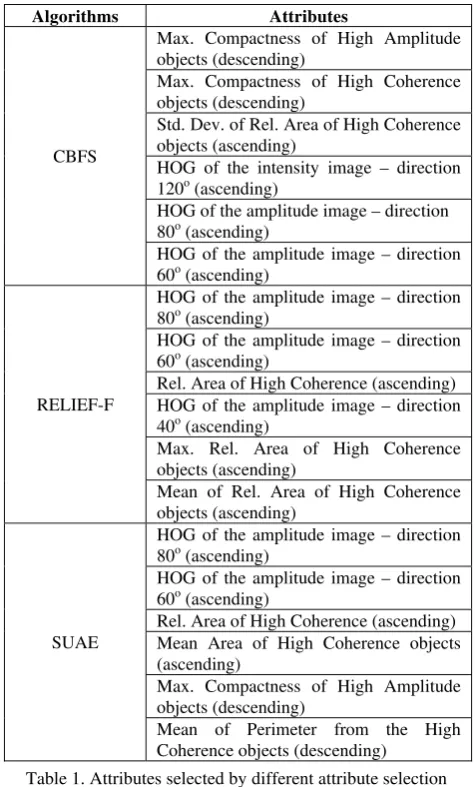
Considering all HOGs attributes and the descriptive statistics of the geometric attributes of the extracted man-made features, 94 attributes were available for performing the classification of the USTs. In order to reduce processing time, increase the classification accuracy and gain insight on the pertinence of the calculated attributes, we decided to reduce the dimensionality to the most expressive attributes by performing a quantitative exploratory analysis of these attributes. This exploratory analysis was carried out using three powerful attribute selection algorithms, namely: Symmetrical Uncertainty Attribute Evaluation (SUAE) (Weka, 2014), Correlation-Based Feature Subset (CBFS) (Hall, 1998) and RELIEF-F (Kononenko, 1994). We then took to the classification step only attributes selected by these three algorithms. Table 1 shows which attributes were selected by each of these algorithms.
The classification of the three considered USTs was actually divided into three different classification steps in increasing level of complexity. This strategy can be represented in the form of hierarchical network of classes (Figure 3). Firstly, the urban blocks were distinguished from the streets railroads and rivers by the information existent on the shapefile obtained from the prefecture of Munich (Figure 3 – Level 1). Following, Parks and Vegetated Areas were distinguished from Built-Up Areas using the Nearest-Neighbour (NN) classifier and the image attributes Rel. Area of High Coherence (ascending), Max. Rel. Area of High Coherence objects (ascending), Mean Area of High Coherence objects (ascending) and Max. Compactness of High Coherence objects (descending) (Figure 3 – Level 2). Finally, urban blocks classified as Built-Up Areas were subsequently distinguished between Single-Family Houses and Commercial and Residential Buildings also using the NN classifier and all other image attributes shown on Table 1 and not used on the classification of Level 2.
Algorithms Attributes
CBFS
Max. Compactness of High Amplitude objects (descending)
Max. Compactness of High Coherence objects (descending)
Std. Dev. of Rel. Area of High Coherence objects (ascending)
HOG of the intensity image – direction 120o (ascending)
HOG of the amplitude image – direction 80o (ascending)
HOG of the amplitude image – direction 60o (ascending)
RELIEF-F
HOG of the amplitude image – direction 80o (ascending)
HOG of the amplitude image – direction 60o (ascending)
Rel. Area of High Coherence (ascending) HOG of the amplitude image – direction 40o (ascending)
Max. Rel. Area of High Coherence objects (ascending)
Mean of Rel. Area of High Coherence objects (ascending)
SUAE
HOG of the amplitude image – direction 80o (ascending)
HOG of the amplitude image – direction 60o (ascending)
Rel. Area of High Coherence (ascending) Mean Area of High Coherence objects (ascending)
Max. Compactness of High Amplitude objects (descending)
Mean of Perimeter from the High Coherence objects (descending)
Table 1. Attributes selected by different attribute selection algorithms.
Figure 3. Hierarchical classification of USTs.
2.5 Measuring Classification Instability
Because of the fact that some urban blocks have more than one UST class inside it, we elaborated a way of detecting urban blocks with mixed classes based on the membership values of the urban blocks to the candidate classes. In the case of the NN classifier, the membership values to the classes are directly related to the distance in the feature space from a particular
image object to the samples of the candidate classes. A Gaussian function relates the distance in the feature space from a given image object to a given sample in order to assign a membership value from this image object to the class of this given sample (Figure 4a). In many cases, an object will have a membership value to more than one class. In this case the object is classified as the class to which it has the highest membership value (Figure 4b). Hence, each image object will have a membership value regarding each sample of each class and regarding each of the image attributes considered in the classification. For a given class and a given attribute, the membership of an image object to all samples of this class (regarding that attribute) is averaged. This mean value from all attributes is then averaged and the class with the highest overall membership value is the class associated to the concerning image object.
We are able to have a grasp of the stability of the NN classification, that is to say, how certain the classifier is regarding the class assignment, if we compare the highest and the second highest membership values. Obviously, if this difference is large, the class assignment is certain, whereas if it is small the class assignment is uncertain. We assume that urban blocks whose classification stability is low are probably mixed blocks. Hence, applying a threshold value to this classification stability index, it is possible to select potentially mixed blocks that have to be re-segmented in order to distinguish its UST and correctly classify them. Figure 5a shows to which stability category each of the blocks from our study area belongs. Applying a threshold value of 0.55, some of the blocks were selected as potentially having more than one UST class. Among these blocks we do not consider the ones with small area, because small block are less probable of having more than one class and because uncertainty may come from the fact that small blocks are more difficult to classify.
Figure 4. Membership function created by the NN classifier (a) and membership functions showing the class assignment in one
dimension. Adapted from eCognition (2014).
Figure 5. Classification stability map (a) and selected blocks with unstable classification (b).
3. RESULTS AND DISCUSSION
In this section we discuss (1) the results from the exploratory attribute analysis, as well as (2) the obtained UST classification. Lastly, we propose in general lines a measure for eliminating the problem of mixed-blocks by performing segmentation and re-classification of the new image objects inside these blocks.
3.1 Attribute Selection Analysis
As we only wanted to learn which seemed to be the most expressive features for the classification task at hand, we did not deeply analyse these selected features. Nevertheless, some comments about it are pertinent. Firstly, it is interesting to see that, as Table 1 shows, the three feature selection algorithms, although having very different search heuristics ranked as the best ones more or less the same features. Also interesting is that most of the selected features were calculated out of the images from the ascending acquisition and that HOG features calculated out of the amplitude image on angles from 40o to 80o seem to be good features for classifying USTs. Also worth mentioning is that features derived from the coherence image are very expressive. This is in accordance to the fact that the presence of vegetation and from man-made structures like buildings are related respectively to areas of low and high coherence values.
3.2 UST Classification
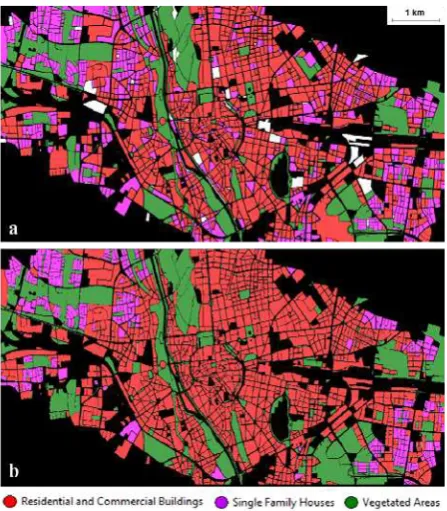
Our UST classification was compared with the official UST map provided by the prefecture of Munich. As mentioned, most UST classes were grouped on the three broad UST classes that we consider in this study. However, a few UST classes were not consider for being too specific or not occurring more than a handful of times in our study-site. Figure 6a shows our final classification obtained applying the NN classifier to our three UST classes and considering the above mentioned image attributes. Figure 6b shows the official UST map grouped into the three classes considered for this study. We can see from a visual analysis of these two classifications that they are not considerably different. Their structure regarding the spatial distribution of the classes is also similar.
We also evaluated our classification using quantitative overall and per-class quantitative measures derived from the confusion matrix. Table 2 shows the confusion matrix and these accuracy indexes. We can see that 76% of the 1926 blocks were correctly classified yielding a Kappa index of 0.61. Most misclassifications are false-positive Commercial and Residential Buildings that are actually Single-Family Houses. These misclassifications have decreased the user’s accuracy of this class to only 0.48. On the other hand, blocks classified as Single-Family Houses are very probably blocks of this class, as the producer’s accuracy of this class expresses (0.93). There seems also to be some confusion between classes Vegetated Area and Single-Family Houses. This is comprehensible since residential areas have lots of green spaces as well in the form of gardens and streets with lots of trees.
Confusion Matrix
VA SFH CRB Sum
VA 240 0 12 252
SFH 21 279 275 575
CRB 5 16 951 972
Unclassified 108 4 15 127
Sum 374 299 1253
Accuracy Indexes (Classes)
Producer 0.64 0.93 0.76
User 0.95 0.48 0.97
Kappa 0.58 0.90 0.51
Totals
Overall Accuracy 76%
Kappa 0.61
Table 2. Confusion matrix and accuracy index of our UST classification. The name of the classes is shown abbreviated –
Vegetated Areas (VA), Single Family Houses (SFH) and Commercial and Residential Buildings (CRB).
3.3 Classification Improvement – Segmentation of Mixed Block
We assume the best way of solving the problem of mixed classes inside a block is to first detect these blocks with possible mixed UST classes and then performing segmentation inside the block followed by the re-classification of its objects. On section 2.5 we showed how blocks with mixed UST classes can be selected based on the difference between their highest and second highest membership values. To what the segmentation concerns, several methods can be applied. It is even possible to formulate the segmentation and re-classification process as an optimization process where the classification instability becomes part of the cost function. With a mere illustrative
purpose, we show on Figure 7 how such segmentation would look (Figure 7c). The urban block in question was selected as having an unstable classification. It is possible to see from the intensity image that this block has indeed more than one type of structure. Its original and true segmentation is shown on Figure 7a and 7b respectively.
Figure 6. Final UST classification (a) and the official UST map grouped into the three classes considered for this study (b).
Figure 7. Segmentation of a block with mixed classes. Original partitioning of the image (a), ideal portioning of the image –
extracted from the official UST map (b) and a possible segmentation to be submitted to reclassification (c).
4. CONCLUSIONS
Although high-resolution (In)SAR has great potential for classifying USTs, this is not at all a trivial task. We showed that
in reducing the number and complexity of the classes, good results can be obtained using relatively simple procedures. The ultimate goal though is to extend the classification problem to more representative classes, but as the number of classes and their complexity increases, the problem gets harder. Anyways, breaking down the classification problem into simpler classifications using a hierarchical network of classes seems very clearly to be a good idea. Also, more expressive image attributes are needed when more complex classes are considered. HOGs features showed to be useable, but there is plenty of field for researching further in that area. For example, HOGs descriptors may be calculated at different scales and this would increase the feature space. Following, performing the feature selection analysis we suggested may lead to knowledge on the best scale(s) HOG features are more expressive regarding our study-area and such SAR data.
On future efforts we will concentrate on the exploration of other expressive image attributes and on the problem of detecting mixed blocks and segmenting and re-classifying them based on an optimization workflow.
ACKNOWLEDGEMENT
We acknowledge the financial help given by the Deutscher Akademischer Austausch Dienst (DAAD) during the time in which this paper was written, as well as the Referat fuer Gesundheit und Umwelt der Stadt Muenchen for providing us with the up-to-date official USTs map.
REFERENCES
Banzhaf, E., Höfer, R., 2008. Monitoring Urban Structure Types as Spatial Indicators With CIR Aerial Photographs for a More Effective Urban Environmental Management. Journal of Selected Topics in Applied Earth Observations and Remote Sensing, 1(2), pp. 129-138.
Dalal, N., Triggs, B., 2005. Histograms of oriented gradients for human detection. In: IEEE Computer Society Conference on Computer Vision and Pattern Recognition, Vol. I, pp. 886-893.
Dekker, R.J., 2003. Texture analysis and classification of ERS SAR images for map updating of urban areas in the Netherlands. IEEE Transactions on Geoscience and Remote Sensing, 41, pp. 1950-1958.
Dell'Acqua F, Gamba P. 2006. Discriminating urban environments using multiscale texture and multiple SAR images. International Journal of Remote Sensing, 27(18), pp. 3797-3812.
eCognition, 2014. eCognition User Guide. http://www.ecognition.com/ (30 Jul. 2014)
Hall, M. A., 1998. Correlation-based Feature Subset Selection for Machine Learning. The University of Waikato, PhD Dissertation, Halmiton, New Zealand.
Hecht, R., Herold, H., Meinel, G., Buchroithner, M. 2013. Automatic derivation of urban structure types from topographic maps by means of image analysis and machine learning. In: Buchroithner, M. et al. (Eds.): 26th International Cartographic Conference.
Heiden, U., Heldens, W., Roessner, S., Segll, K., Esch, T., Mueller, A., 2012. Urban structure type characterization using
hyperspectral remote sensing and height information.
Landscape and Urban Planning, 105, pp.361-375.
Heldens, W., 2010. Use of airborne hyperspectral data and height information to support urban micro climate characterisation. Bayerischen Julius-Maximilians-Universitaet Wuerzburg, PhD Dissertation, Germany.
Hoefner, R.; Banzhaf, E.; Ebert, A. (2009) Delineating urban structure types (UST) in a heterogeneous urban agglomeration with VHR and TerraSAR-X data. 2009 Urban Remote Sensing Joint Event.
Huck, A., Hese, S., Banzhaf, E., 2011. Delineating parameters for object-based urban structure mapping in Santiago de Chile using Quickbird data. In: International Archives of the Photogrammetry, Remote Sensing and Spatial Information Sciences, Hannover, Germany, Vol. XXXVIII-4/W19.
Kononenko, I., 1994 Estimating Attributes: Analysis and Extensions of RELIEF. In: European Conference on Machine Learning, pp. 171-182.
Munich, 2014. Referat fuer Gesundheit und Umwelt der Stadt Muenchen.http://www.muenchen.de/rathaus/Stadtverwaltung/R eferat-fuer-Gesundheit-und-Umwelt.html (30 Jul. 2014).
Novack, T; Stilla, U. (2014) Discriminative learning of Conditional Random Fields applied for the classification of urban settlements types. In: Wissenschaftlich-Technische Jahrestagung der DGPF, Hamburg, Germany, Vol. XXXIV.
Pauleit, S., Duhme, F., 2012. Assessing the environmental performance of land cover types for urban planning. Landscape and Urban Planning, 52, pp.1-20.
Steiniger, S., Lange, T., Burghardt, D., Weibel, R., 2008. An approach for the classification of urban buildings structures based on discriminant analysis techniques. Transactions in GIS, 12(1), pp. 31-59.
Walde, I., Hese, S., Berger, C., Schmullius, C., 2014. From land cover graphs to urban structure types. International Journal of Geographical Information Science, 28(3), pp. 584-609.
Weka, 2014. Data Mining Software in Java – University of Waikato. http://www.cs.waikato.ac.nz/ml/weka/ (30 Jul. 2014).
Weydahl, D.J., 2002. Backscatter changes of urban features using multiple incidence angle RADARSAT images. Canadian Journal of Remote Sensing, 28(6), pp.782-793.
Wurm, M., Taubenböck, H., Roth, A. and Dech, S., 2009. Urban structuring using multisensoral remote sensing data – by the examples of german cities – Cologne and Dresden. In:
Urban Remote Sensing Joint Event, Shanghai, China.
Wurm, M. and Taubenböck, H., 2010. Fernerkundung als Grundlage zur Identifikation von Stadtstrukturtypen. In:
Fernerkundung im urbanen Raum, Darmstadt, Germany, pp. 94–103.
Yu, B., Liu, H., Wu, J., Hu, Y., Zhang, L., 2010. Automated derivation of urban building density information using airborne LiDAR data and object-based method. Landscape and Urban Planning, 98, pp. 210-219.