IMMERSIVE VISUALIZATION OF THE QUALITY OF DIMENSIONALITY REDUCTION
Mohammadreza Babaeea∗, Mihai Datcub, Gerhard Rigolla a
Institute for Human-Machine Communication, Technische Universit¨at M¨unchen Munich Aerospace Faculty, Munich, Germany
{reza.babaee,rigoll}@tum.de b
Munich Aerospace Faculty, German Aerospace Center (DLR) Oberpfaffenhofen, 82234 Wessling, Germany
Commission III/3
KEY WORDS:dimensionality reduction, immersive visualization, quality assessment, neighborhood graph
ABSTRACT:
Dimensionality reduction is the most widely used approach for extracting the most informative low-dimensional features from high-dimensional ones. During the last two decades, different techniques (linear and nonlinear) have been proposed by researchers in various fields. However, the main question is now how well a specific technique does this job. In this paper, we introduce a qualitative method to assess the quality of dimensionality reduction. In contrast to numerical assessment, we focus here on visual assessment. We visualize the Minimum Spanning Tree (MST) of neighborhood graphs of data before and after dimensionality reduction in an immersive 3D virtual environment. We employe a mixture of linear and nonlinear dimension reduction techniques to apply to both synthetic and real datasets. The visualization depicts the quality of each technique in term of preserving distances and neighborhoods. The results show that a specific dimension reduction technique exhibits different performance in dealing with different datasets.
1 INTRODUCTION
The volume of Earth Observation (EO) data is increasing on the order of hundreds of terabytes per day. Simultaneously, data mining techniques exhibit significant performance, primarily by representing data by high-dimensional features. For instance, in large scale image retrieval, each image might be represented by a feature vector of the size105.
Although high-dimensional features improve the performance of data mining algorithms, they make knowledge discovery more complex. However, dimension reduction (DR) for visualization is the most widely used approach for visualizing high-dimensional features. Consequently, a huge variety of techniques have been developed to embed the high-dimensional data points into a low-dimensional space. Linear techniques perform the task by pro-jecting data, and nonlinear methods focus on preserving the dis-tances between points during dimension reduction. However, for recent data mining techniques and computer vision applications, distances between points play a key role. For instance, K-means, as one of the most widely used clustering approach, finds the clus-ter cenclus-ters by minimizing the distances of data points to clusclus-ter centers. In image classification, the distance of feature points to the visual words is considered as similarity measure. Finally, in object localization and scene recognition, distances of data points to a reference point is used to assign them to a set of predefined classes or categories.
Since distances between data points is a key property of datasets, recent dimension reduction techniques try to preserve this prop-erty during dimension reduction (Belkin and Niyogi, 2003, Chen and Buja, 2009, Hinton and Roweis, 2002). Hence, to measure the quality of these techniques, several quality measures have been proposed that consider the ability of a technique to preserve the neighborhood as quality criteria. However, these measures do not exhibit qualitatively where the distances are preserved. They
∗Corresponding author. The first author is a first year Ph.D. student
supported by Munich Aerospace Faculty at the Technische Universit¨at M¨nchen, Germany.
are generally useful to compare a technique with another. In this paper, we propose to visualize the quality of a DR tech-nique by presenting the Minimum Spanning Tree of a neighbor-hood graph before and after dimension reduction. A Minimum Spanning Tree can be imagined as a summary of a weighted graph whose edges depict the distance between points. This tree is computed from data points in two states, i.e. before and after dimension reduction. For visualization, we utilize an immersive 3D virtual environment in which the user is allowed to navigate inside the data and explore.
The remainder of this paper is organized as follows: The rele-vant background about the dimensionality reduction followed by quality assessment criteria are covered in Section 2. The details of immersive visualization system is provided in Section 3. We present the results of various experiments with synthetic and real data in Section 4. Section 5 provides the conclusion.
2 RELATED WORK
2.1 Dimension Reduction
In dimensionality reduction, a dataset of N high dimensional points, X = {x1, x2, . . . , xN} is transformed into a low di-mensional dataset,Y = {y1, y2, . . . , yN}. Since the last two decades numerous linear and nonlinear DR techniques have been proposed in different research areas. While linear approaches as-sume the data comes from a linear d-dimensional subspace of a high dimensional feature space, nonlinear approaches consider the data as a d-dimensional manifold embedded in a high dimen-sional space. Perhaps, the most famous linear algorithm is Prin-cipal Component Analysis (PCA) projecting data intod eigen-vectors corresponding todlargest eigenvalues of the covariance matrix of the data.
mates the low dimensional manifold embedded in a high dimen-sional space. The eigenfunctions of the Laplace Beltrami opera-tor on the manifold serve as the embedding dimensions.
Stochastic Neighbor Embedding (SNE) (Hinton and Roweis, 2002) is a probabilistic approach aiming to preserve the neighborhood of data points by working on probability instead of distances be-tween points. More precisely, the neighborhood relation of data points in both high and low dimensional spaces is represented by a probability matrix, in which the closer neighboring points have larger probability values than the farther ones. The sum of the Kullback-Leibler divergences over the probability matrices is used as the cost function in the minimization procedure.
2.2 Quality Assessment
Various dimension reduction techniques exhibit different results based on the input data and tuning parameter(s). Evidently, it is vital to evaluate their quality in order to choose a proper one with the right parameter(s) for data mining systems.
Since the majority of DR techniques focus on preserving the lo-cal neighborhood distances between data points, state-of-the-art approaches try to improve on the succession of DR techniques in preserving the distances. These approaches can be categorized to four categories. The first group evaluates the performance of DR by the assessment of the value of the cost function after conver-gence (Bernstein et al., 2000, Belkin and Niyogi, 2003). Clearly, these approaches are useful to compare the results of a specific technique with different set of parameter(s).
The second group focuses on the reconstruction error (Balasub-ramanian and Schwartz, 2002). However, since the reverse trans-formation does not exist for all techniques, it is hard to employ these approaches for all DR techniques.
The third group judges DR techniques based on the accuracy of classification applied on labeled data (Van der Maaten et al., 2009). The main drawback of this group is the need for labeled data which is not available in most cases.
Finally, the last group comprises approaches concentrating on preserving the structure of data. The current criteria for the as-sessment of the preservation of data structure are the local con-tinuity meta-criterion (LCMC) (Chen and Buja, 2006, Chen and Buja, 2009), the trustworthiness and continuity measures (T&C) (Venna and Kaski, 2006), and the mean relative rank error (MRRE) (Lee and Verleysen, 2007, Lee and Verleysen, 2009). All these criteria analyze the neighborhoods before and after the dimen-sion reduction. A recent work has put all these criteria to a single framework to compare them (Lee and Verleysen, 2009). The ad-vantage of this framework is its ability to propose new criteria for the assessment of DR techniques.
3 IMMERSIVE VISUALIZATION
3.1 Minimum Spanning Tree
The Minimum Spanning Tree is a spanning tree of an edge-weighted graph whose weight is minimum among the weight of other
span-ciple, if edges have distinct weights then there will be only one minimum spanning tree.
In dimension reduction, if distances are completely preserved, the minimum spanning trees of neighborhood graphs should not dif-fer. Therefore, by visualizing the two minimum spanning trees superimposed on each other, we can visually assess the quality of DR.
3.2 CAVE Automatic Virtual Environment
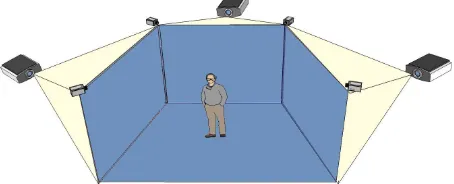
We propose an immersive 3D virtual environment for visualiza-tion of minimum spanning tree of data points. This environment, the so-called Cave Automatic Virtual Environment (CAVE) is based on Virtual Reality technology and comprises four room-sized walls aligned to form a cube to display the low-dimensional features. This configuration allows users to have a180degree horizontal view. The virtual scene is projected onto the walls using two projectors per wall in order to have stereoscopic sce-narios. Additionally, a real-time tracking system including six infrared cameras mounted on top of the walls computes the pose (position and orientation) of marked objects (e.g., Wii controller and shuttle glasses) inside the cube. See Figure. 1
For rendering and visualizing the data, the CAVE utilizes a three-layer cluster of PCs. The first three-layer captures user motions and navigation signals and send them to the middle layer. Motion capturing is performed by optical tracking system and the nav-igation signals are generated by a Wii controller. Middle layer comprises a master PC which is responsible for generating the virtual scene based on the incoming signals from the first layer. Once the scene is ready, it sends rendering signals to the third layer. Rendering and displaying the scene on the walls is car-ried out by four PCs (one for each wall). The schematic of the organization of the CAVE is depicted in Figure. 2.
Figure 1: Schematic of CAVE. Four walls play the role of dis-play while projectors are installed behind them. Infra-red track-ing cameras mounted on top of walls capture the motion of user.
4 EXPERIMENTAL RESULTS
Figure 2: The physical diagram of immersive visualization. The visualization system is compose of three layers with different re-sponsibility. First layer comprises motion capture (tracking) sys-tem and control capturing. A master PC in the middle layer for the synchronization, and finally four systems for rendering for each wall of the CAVE. All systems are connected together via an ethernet network.
after dimension reduction. Prim algorithm is used to compute the Minimum Spanning Tree of graphs.
4.1 Datasets
To assess the dimension reduction techniques, we used two syn-thetic datasets and one real-world dataset.
4.1.1 Synthetic Data The synthetic data is comprised of two datasets. The first one is a set of20003D points randomly drawn from a 2D S-curve embedded in 3D. The second one is a set of 20003D points randomly drawn from Swiss-roll (see Figure 3).
(a) S-curve (b) Swiss-role
Figure 3: Our synthetic data has been drawn randomly from 2D S-curve and Swiss-role embedded in 3D.
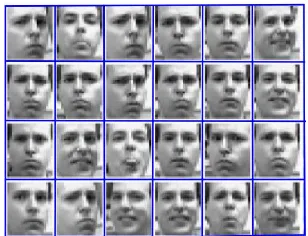
4.1.2 Real Data We used the B.J. Frey face database as our real dataset comprising1965pictures of the same face captured in different poses and expressions. The size of each face is28×20 pixels. Therefore, each face is represented by a feature vector of the size560. Consequently, the input of the dimension reduction process is a matrix whose dimensions are1965×560. Figure 4 presents some samples from the face database.
Figure 4: Samples from the face database.
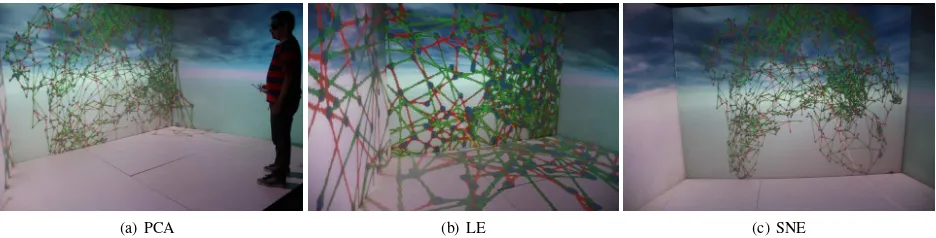
For both synthetic datasets, we used a mixture of linear and non-linear DR techniques, namely PCA, LLE, LE, SNE, and Isomap. The neighborhood parameter for nonlinear techniques was set to 12. First, we constructed the neighborhood graph of datasets with respect to euclidean distances between points. We performed a pre-processing in order to ensure that the distances differ. This was done due to the fact that if the edge weights in a graph are unique then the minimum spanning tree is also unique. The Prim algorithm was used to compute the tree. Second, we applied di-mension reduction to both synthetic and real datasets. For syn-thetic datasets we reduced the dimension from3to2and for real datasets from560to 3. For synthetic datasets, the position of points before dimension reduction were used for 3D visualiza-tion which is not important because we are interested in distances between points. For real dataset, the 3D position of points for visualization is actually the output of dimension reduction. The computed trees for different datasets and different dimension re-duction techniques are presented in Figures 5, 6, and 7. In these figures the blue points are data points, the green lines depict the edges of minimum spanning tree constructed from neighborhood graphs of data points before dimension reduction, and the red lines depict the edges of minimum spanning tree constructed after applying dimension reduction. In these visualization, if the min-imum spanning tree does not change we should not see and red lines. Therefore, red lines show how much and where the mini-mum spanning tree is changed during dimension reduction. For example, in figure 5, we see readily that LE and Isomap exhibit better performance than PCA, LLE, and SNE. Figure 6 shows that PCA, Isomap, and LE exhibit better performance than LLE and SNE. Additionally, LE has a weaker performance relative to PCA and Isomap. These two figures shows us that the performance of a specific dimension reduction may vary from dataset to dataset. For instance, PCA exhibits a better performance in dealing with Swiss-roll than S-curve datasets. The same process was carried out on real dataset and the results are depicted in Figure 7. As it might be understood, 2D figures can not truely show us the performance of a specific dimension reduction technique. For example, in Figure 7 it is hard to compare and evaluate the perfor-mance of PCA, LE, and SNE in dealing with real dataset (the face dataset). Therefore, we additionally visualized the results in an immersive 3D virtual environment (CAVE). Some images of the CAVE while the user is looking at the results are depicted in Fig-ure 8. In immersive visualization, the use can easily go inside the data and see where the distances are not preserved. Furthermore, by zooming in and out, the user get a local or global overview of the performance of the employed dimension reduction technique.
5 CONCLUSION
ACKNOWLEDGEMENTS
The authors would like to thank Munich Aerospace Faculty for the support to accomplish this research.
REFERENCES
Balasubramanian, M. and Schwartz, E. L., 2002. The isomap algorithm and topological stability. Science 295(5552), pp. 7–7.
Belkin, M. and Niyogi, P., 2003. Laplacian eigenmaps for dimen-sionality reduction and data representation. Neural computation 15(6), pp. 1373–1396.
Bernstein, M., De Silva, V., Langford, J. C. and Tenenbaum, J. B., 2000. Graph approximations to geodesics on embedded man-ifolds. Technical report, Technical report, Department of Psy-chology, Stanford University.
Chen, L. and Buja, A., 2006. Local multidimensional scaling for nonlinear dimension reduction, graph layout and proximity analysis. PhD thesis, Citeseer.
Chen, L. and Buja, A., 2009. Local multidimensional scaling for nonlinear dimension reduction, graph drawing, and proxim-ity analysis. Journal of the American Statistical Association 104(485), pp. 209–219.
Hinton, G. and Roweis, S., 2002. Stochastic neighbor embed-ding. Advances in neural information processing systems 15, pp. 833–840.
Lee, J. A. and Verleysen, M., 2007. Nonlinear dimensionality reduction. Springer.
Lee, J. A. and Verleysen, M., 2009. Quality assessment of dimen-sionality reduction: Rank-based criteria. Neurocomputing 72(7), pp. 1431–1443.
Roweis, S. T. and Saul, L. K., 2000. Nonlinear dimensional-ity reduction by locally linear embedding. Science 290(5500), pp. 2323–2326.
Sedgewick, R., 2002. Algorithms in Java, Parts 1-4. Vol. 1, Addison-Wesley Professional.
Van der Maaten, L., Postma, E. and Van den Herik, H., 2009. Dimensionality reduction: A comparative review. Journal of Ma-chine Learning Research 10, pp. 1–41.
(a) PCA (b) LLE (c) LE (d) SNE (e) Isomap
Figure 5: The MST of neighborhood graph of S-curve data points before and after dimension reduction. The green and red lines show the edges of trees before and after dimension reduction, respectively.
(a) PCA (b) LLE (c) LE (d) SNE (e) Isomap
Figure 6: MST of neighborhood graph of Swiss-roll data points before and after dimension reduction. The green and red lines show the edges of trees before and after dimension reduction, respectively.
(a) PCA (b) LE (c) SNE
Figure 7: The MST of neighborhood graph of the face data points before and after dimension reduction. The green and red lines show the edges of trees before and after dimension reduction, respectively.
(a) PCA (b) LE (c) SNE