www.elsevier.comrlocaterapplanim
Differences in food preferences between
individuals and populations of domestic cats
Felis sil
Õ
estris catus
J.W.S. Bradshaw
a,), L.M. Healey
b, C.J. Thorne
b,
D.W. Macdonald
c, C. Arden-Clark
ca
Anthrozoology Institute, School of Biological Sciences, UniÕersity of Southampton, Southampton SO16 7PX, UK
b
Waltham Centre for Pet Nutrition, Melton Mowbray, Leicestershire LE14 4RT, UK
c
Department of Zoology, UniÕersity of Oxford, OX1 3PS, UK
Accepted 17 January 2000
Abstract
The food preferences of 64 cats, of which 28 were domestic pets and 36 were free-ranging animals on three farms, were tested using five food types; a sixth type was also tested on the farm
Ž .
cats. Information was also gathered on the background diet of the house cats individually and of each farm cat colony. Consistent differences were found between the predefined groups of cats in
Ž . Ž . Ž .
their preferences for three foods, Hard Dry HD , Canned Meat CM and Raw Beef RB , the greatest differences being between house cats and farm cats as a whole. The three colonies of farm cats showed distinct differences in preference, for RB andror CM, and for the sixth food, Soft
Ž .
Dry SD . Differences between farms could be explained by a reduced preference for items similar to major components of the background diet of each colony, i.e. selection in favour of foods that were temporally rare. Differences between house and farm cats, and within the house cats, could not be explained in this way; the house cats were neophobic towards RB, and the farm cats ate little of the HD food, possibly because they found it difficult to ingest.q2000 Elsevier Science
B.V. All rights reserved.
Keywords: Cat; Food preference; Foraging behaviour; Choice tests; Individual differences
)Corresponding author. Tel.:q44-1703-594367; fax:q44-1703-594269.
Ž .
E-mail address: [email protected] J.W.S. Bradshaw .
0168-1591r00r$ - see front matterq2000 Elsevier Science B.V. All rights reserved. Ž .
1. Introduction
The domestic cat, Felis silÕestris catus, has specialised nutritional requirements
Ž
which are thought to be a consequence of its origins as an obligate carnivore reviewed .
by MacDonald et al., 1984; Legrand-Defretin, 1994 . For example, cats have a high
´
overall requirement for protein and particularly for arginine and sulphur-containing amino acids, especially taurine; a requirement for prostaglandin precursors; and a requirement for several vitamins, including Vitamin A, niacin and thiamine. Wild Felidae, provided they catch enough prey to satisfy their calorific requirements, should have little difficulty in achieving a nutritionally balanced diet, since much of their preyŽ .
is nutritionally exchangeable Rozin, 1976 . Modern domestic cats that are fed by their owners on nutritionally complete proprietary foods likewise have little need to select between foods on the basis of their nutritional content. However, many domestic cats,
Ž
often referred to as ‘‘farm cats’’ or ‘‘semi-ferals’’ see Bradshaw et al., 1999, for .
definitions , obtain their food by a mixture of hunting and scavenging from food sources provided accidentally or deliberately by humans. Given their exacting nutritional requirements, scavenging must present a particular challenge, since none of the indivi-dual food items encountered is likely to be nutritionally complete, yet large numbers of
Ž . Ž
cats successfully adopt this lifestyle in the UK Rees, 1981 and elsewhere e.g. .
McKnight, 1964 .
Ž .
Cats can rapidly learn to avoid foods which are either toxic Mugford, 1977 or
Ž .
lacking in certain nutrients, such as arginine Morris and Rogers, 1978 and thiamine ŽEverett, 1944 . However, deficiencies of other nutrients, such as taurine, induce little or.
Ž .
no aversion even when fed for long periods Sturman et al., 1986 , and there is little evidence to suggest that cats modify their feeding behaviour based upon the nutritional
Ž .
content of each meal taken Bradshaw et al., 1996 . They do appear to possess two selection mechanisms based on the sensory characteristics of potential foods; neophobia,
Ž .
the rejection of foods not encountered before Bradshaw, 1986 , and a transitory preference for previously familiar foods that have been unavailable for some time, the
Ž .
so-called ‘‘novelty effect’’ Mugford, 1977; Thorne, 1982 . If the latter is defined as a preference for foods that are temporally rare, it may be similar, at least in its effects on which foods are selected, to the preference for the rarer of two foods presented
Ž .
simultaneously demonstrated by Church et al. 1994, 1996 .
All of the experiments described above were carried out under highly controlled conditions. In order to assess the degree to which these mechanisms of food selection are expressed in both human-dependent and free-ranging populations of cats, we have compared the preferences for several foods in four populations of F. s. catus, three feral groups living on and around farms, and a sample of owned household cats typical of
Ž .
those found in the UK i.e. largely fed on nutritionally complete foods , and interpreted these in terms of the background diet and dietary experience of each group. We have not used the technique of presenting two foods simultaneously in varying ratios, as used by
Ž .
Ž .
taken Greenwood, 1984 . Second, the technique is unsuitable for foods that cannot be
Ž .
presented in discrete, identical pieces e.g. cooked fish . Instead, we have selected test foods that were temporally common or rare to one or another of the four populations, and presented them in conventional pairwise preference tests in which both foods are equally accessible.
2. Methods
2.1. Animals
Ž .
House cats 28 were selected at random from households in Nottingham, UK, the only restriction being that there should be no more than two cats, and no dog, in the household. Where there were two cats, only one was tested. The background diet of each cat was assessed by a questionnaire, in which each owner was asked to estimate their
Ž
average weekly use of five food types canned meat-based, raw meat, cooked meat, hard .
dry, and all types of fish , on a six-point category scale.
Three populations of feral cats were tested, each on a separate farm in Oxfordshire, UK. The largest colony, near Ducklington on a mixed farm, consisted of about 45 cats at the time of testing. Of the two smaller colonies, that at Wytham, on a beef-rearing farm, consisted of eight individuals; the colony at Horspath comprised about 12 individuals on a pig farm. All the farm cats tested were adult females, except for three males at Ducklington. All individuals could readily be distinguished from one another by appearance. The diets of the farm cats, excluding any prey caught, were assessed by questioning all those farm workers who came into contact with the cats and also by following cats to any neighbouring houses and questioning householders there.
2.2. Foods
Six foods were selected as follows to represent a wide range of materials which are both palatable to cats, and would be available to most of the house cats.
Ž .
1. ‘‘Canned Meat’’ CM — a mixture of mammalian and poultry meats and offals, processed by canning, and similar in appearance and palatability to the ‘‘premium’’ canned cat foods which are widely available in the UK.
Ž .
2. ‘‘Canned Fish’’ CF — fillets of pilchard, canned in a jelly base. Ž .
3. ‘‘Raw Beef’’ RB — minced shin of fresh beef. Ž .
4. ‘‘Cooked Beef’’ CB — as above, cooked by boiling in water, and with the liquid fat layer removed before draining.
Ž .
5. ‘‘Hard Dry’’ HD — extruded hard biscuit-like kibbles in the shape of three-pointed stars, made from cereals and meat and poultry offal, weighing approximately 0.3 g each.
Ž . Ž .
2.3. Procedures
All tests were carried out in places where the cats were accustomed to eat, either in the normal feeding place in houses, or at the main feeding site on the farms. Each cat was presented, on successive occasions up to 7 days apart, with two bowls side-by-side, each containing 200 g of two of the foods listed above. The first five foods were tested in all possible pairs, 10 in all, while SD was only paired with HD. These pairings present some theoretical problems because of redundant information due to transitivity: each cat can be thought of as using its own individual ranking of the six foods to determine its preference within any pair, thereby making the results of the individual preference tests non-independent. However, the method that is perhaps the most obvious alternative, that of testing all the foods against a common standard, would have biased the background diet of the cats during the test period, towards whatever standard was chosen. Extraction of the underlying rankings using multivariate statistics has been used to eliminate the redundancy in the preference data.
The food presented in the left-hand bowl was decided at random to eliminate any effects of side-bias. Each cat was allowed to feed for 10 min or until approximately 200
Ž .
g of food estimated visually had been consumed, whichever was the sooner, before both bowls were removed, and the remaining food weighed, to the nearest 5 g. If less than 5 g was eaten from both of the bowls, the test was recorded as a refusal. No test was repeated for the house cats, but any farm cat that refused a pair of foods was presented with that pair on three occasions before a refusal was recorded. The order of testing, which was maintained for each cat, is given in Table 1. Additionally, the farm cats were tested with SD vs. HD.
House cats were familiarised with the test procedure by a preliminary test in which
Ž .
two varieties of ‘‘Whiskas’’ canned cat food Pedigree Petfoods, UK were presented.
Table 1
Mean preferences for the first-named food in each pair, for the four populations of cats
Figures on each line followed by the same letter are not significantly different by Duncan’s New Multiple Range Test, at Ps0.05.
U
Food pair Order Ducklington Wytham Horspath House
HD vs. CB 5 10.1a 31.3a 20.9a 76.0b
HD vs. RB 3 11.8a 6.0a 25.5ab 65.7b
HD vs. CM 8 2.2a 2.3a 0.0a 33.8b
HD vs. CF 10 4.3ab 3.3ab 0.0a 26.9b
CM vs. CF 4 66.5a 68.1a 74.5a 18.7b
RB vs. CB 9 79.7a 69.9ab 73.3ab 43.4b
CF vs. CB 7 78.4a 88.9ab 85.7ab 93.8b
RB vs. CF 1 47.2a 44.4a 5.2b 25.3b
RB vs. CM 6 37.6a 45.6a 8.8b 19.0b
CB vs. CM 2 14.9a 5.8a 3.0a 12.9a
SD vs. HD 11 5.8a 12.4a 39.3b –
U
More extensive training was required for the farm cats to provide a reliable method for Ž testing one individual at a time. Pairs of bowls, initially containing minced raw pork an
. approximation to the chopped carcasses fed on occasion to many farm cats , were
Ž . Ž .
presented covered by transparent plastic containers, 42 cm l =24 cm w =15 cm Ž .h , with a hole 13.5 by 13.5 cm in one long side sufficient to allow access by only one cat. Some individuals on each farm did not adopt this method of feeding; the numbers of Ž . cats that were trained and completed the sequence of tests were — Ducklington 27 ,
Ž . Ž .
Wytham 4 , Horspath 5 . Once training was completed and testing proper had commenced, individual farm cats that had already completed a test were dissuaded from repeating it, by directing a brief jet of water at the ground immediately in front of them.
2.4. Statistics
Preferences were calculated for each pair of foods as the proportion of the first-named Žin Table 1 eaten in relation to the total eaten in that test, and converted to the arcsine. of their square roots before statistical analysis. Since the results of preference tests depend on the relative palatabilities of the two foods presented, it was often difficult to deduce whether a difference between individuals or groups was due to one or the other food of a pair, or some combination of the two. Hence, in addition to analysis of
Ž .
variance ANOVA on preferences from each test, the tests were combined together by Ž .
principal components analysis PCA , to compare the individual cats irrespective of Ž . Ž
origin, and canonical discriminant analysis CDA CANDISC procedure in the SAS
. Ž .
package SAS Institute, 1982 to compare groups. Both these methods allowed an element of replication to be extracted. The result of each preference test can be thought of as a balance between the palatabilities of two foods, and although each pair of foods
Ž .
was tested only once, each food was tested four times excluding SD . Thus, by combining the results of several tests together, trends relating to the palatabilities of each food for each individual or group could be detected. Food preferences and frequencies of foods in the background diets of the house cats were compared by canonical correlation ŽCANCORR procedure in the SAS package . In the multivariate analyses only, individ-. ual missing data were substituted for by the mean preference for that test.
3. Results
Ten cats did not complete all 10 tests; nine house cats refused RB vs. CB, and one farm cat refused both RB vs. CB and CB vs. HD. In over half the tests, the cats sampled both of the foods presented, but these tests were disproportionally divided between the
Ž . Ž .
house cats 35.4% and the farm cats 78.8% . The number of occasions on which one of Ž
the two foods in a test was not eaten varied between foods, as follows numbers of cats
. Ž . Ž . Ž . Ž .
that never ate that food in brackets : CM 26 0 , CF 13 0 , RB 57 6 , CB 75 6 , HD Ž .
3.1. Comparison of indiÕiduals
All of the individual cats were compared by PCA on the preferences from the first 10 tests. The first three principal components extracted were interpretable in terms of
Ž .
general acceptances for the foods Table 2 ; subsequent components had eigenvalues
-1. On the first component, all four preferences for HD were weighted negatively, and all four for RB positively. On the second component, all four preferences for CM were weighted negatively; on the third, three out of four preferences for CF were strongly weighted negatively, and three out of four for HD were positive. On each of these axes, other foods were either weighted weakly or inconsistently, i.e. sometimes positively and sometimes negatively.
Ž
The distributions of the individual cats on these axes are shown in Fig. 1 first two
. Ž .
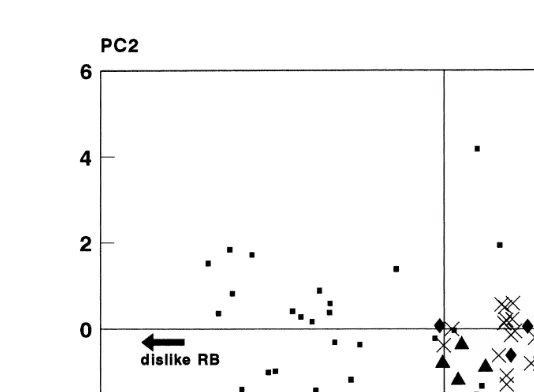
components and Fig. 2 first and third components . In Fig. 1, the farm cats are tightly clustered together, and are separated from all but five of the house cats. By contrast,
Ž .
both farm and house cats are spread across the third component Fig. 2 . Thus, much, but by no means all, of the variation between individuals can be accounted for in terms of variation between the predefined groups. Between farms, the five Horspath cats are tightly clustered in all three dimensions, while the Wytham and Ducklington cats overlap considerably, and exhibit more variation.
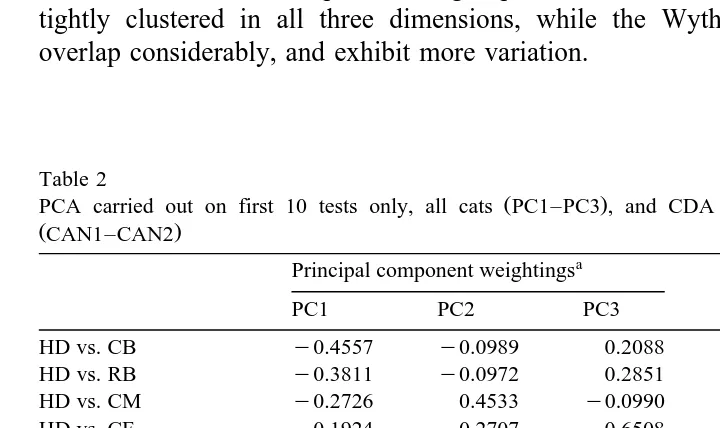
Table 2
Ž .
PCA carried out on first 10 tests only, all cats PC1–PC3 , and CDA on all 11 tests, farm cats only
ŽCAN1–CAN2.
a a
Principal component weightings Total canonical structure
PC1 PC2 PC3 CAN1 CAN2
HD vs. CB y0.4557 y0.0989 0.2088 y0.4660 y0.0687
HD vs. RB y0.3811 y0.0972 0.2851 y0.2265 0.3607
HD vs. CM y0.2726 0.4533 y0.0990 0.2384 y0.4306
HD vs. CF y0.1924 y0.2707 0.6508 0.1954 y0.2726
CM vs. CF 0.3271 y0.4133 y0.1330 y0.0292 0.0724
RB vs. CB 0.2746 y0.3442 0.2507 0.1578 0.0449
CF vs. CB y0.3544 0.0802 y0.2490 y0.1503 y0.0435
RB vs. CF 0.2706 0.0682 0.4426 0.1859 y0.6531
RB vs. CM 0.3299 0.3541 0.2208 0.1818 y0.4846
CB vs. CM 0.2135 0.5254 0.2335 0.4630 y0.1685
SD vs. HD y0.6891 y0.3721
Eigenvalue 3.81 1.58 1.31
% of variance 38.1 15.8 13.1
Canonical correlation 0.8378 0.7185
Ž
Fig. 1. Distribution of cats from all three farms Wytham, diamonds; Ducklington, crosses; Horspath,
. Ž .
triangles , and the house group small squares , on the first two principal components extracted from the 10 preference tests performed on all cats. Each component is labelled with the food type with which it is most closely identified in the weightings of the individual preference tests. The directions of the arrows are arbitrarily chosen, in the sense that each represents a continuum of relative acceptance from ‘‘like’’ to ‘‘dislike’’, from one end of each axis to the other.
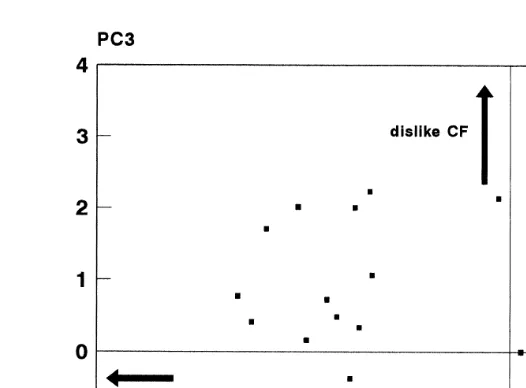
The diagonal combination of the first and third components is attributed largely to the
Ž .
acceptance of HD see Fig. 2 , and the farm and house cats separate almost completely along this axis. The first component is also associated with a lower acceptance of RB in many of the house cats compared to the farm cats, although the Horspath cats are
Ž .
intermediate Fig. 1 . The second component is identified most strongly with the CB vs. CM test, and then in order of decreasing weight with the other CM tests. The third component, which produces little or no separation between groups, with the possible exception of Horspath, is identified with the preferences for CF. Thus, much of the variation that is associated with individual cats, but not groups as defined, stems from the acceptance of CF.
3.2. Comparison of groups
Ž .
Out of the 10 preference tests carried out in all the cats, one CB vs. CM was
Ž .
non-significant, and nine showed significant differences One-way ANOVA, P-0.05
Ž .
Ž .
Fig. 2. Distribution of cats from all three farms, and the house group, symbols as Fig. 1 on the first and third principal components extracted from the 10 preference tests performed on all cats. Each component is labelled with the food type with which it is most closely identified in the weightings of the individual preference tests
Žsee caption to Fig. 1 . Since the preference tests including Hard Dry HD are weighted on both components,. Ž .
Ž . Ž .
its scale of palatability is indicated diagonally, from relatively high top left to relatively low bottom right .
group, which was significantly different from the other farms, with the house group intermediate.
3.3. Differences between farms
In the additional test of SD vs. HD, all the farm cats preferred HD, but this preference was weaker among the Wytham cats than for the other farms. PCA of the farm cats’ preferences on all 11 tests failed to produce any better separation of the farms
Ž .
than had been achieved by PCA of the house and farm cats combined Figs. 1 and 2 , Ž . but CDA using the farms as the predefined groups produced a clear separation Fig. 3 .
Ž .
The first axis was most heavily weighted by the SD vs. HD test Table 2 . Of the other four tests involving HD, two were weighted positively and two negatively, indicating that the acceptance of SD was the major contributor to this axis, despite its being included in only one test. Also strongly weighted on the first axis were two preferences
Ž .
for CB. On the second axis Table 2 , all four preferences for CM were weighted positively, and three out of four preferences for RB were strongly weighted negatively. The distribution of the cats indicates that SD has its lowest acceptance, and CB its
Ž .
Ž .
Fig. 3. Cats from the three farms symbols as Fig. 1 on the two canonical axes extracted by CDA on their scores in all 11 preference tests. Axes are labelled with their associated food types as in Fig. 1.
3.4. Background diets — differences between farms and within house cats
In all the three farms, the cats appeared to obtain much of their food by hunting and scavenging. The scale and type of deliberate provisioning varied from one farm to another. At Ducklington, the SD food and unprocessed milk were provided daily by the farmer. The farmer at Wytham provided bread and milk, and the cats were also regularly fed with canned meat-based foods by a local resident. No commercial foods were available to the Horspath cats, which regularly fed from the pig swill, consisting partly of waste food from restaurants.
The diet of the majority of the house cats was dominated by nutritionally complete
Ž .
canned meat-based, and hard dry products Table 3 . While the house cats displayed a
Table 3
Number of house cats offered foods in five categories, arranged according to the frequency at which each was provided. Data from a questionnaire completed by each cat’s owner
Frequency per week Food type
Ž .
Canned meat Raw meat Cooked meat Dry hard Fish
Every day 23 0 0 12 0
5 or 6 days 4 0 0 0 2
3 or 4 days 0 3 6 6 3
2 days 0 2 6 2 11
1 day 0 7 10 3 4
wide range of preferences, as illustrated in Figs. 1 and 2, no significant correlations could be found between these and the proportion of food types in their normal diet. This may reflect the rather uniform distribution of food types in the diet of the great majority
Ž .
of the cats Table 3 ; such variations as were present might not have been sufficient to induce measurable differences in preference. Raw meat in the background diet appeared to have little effect on preference for RB, although many of these cats may have been fed other kinds of raw meat, e.g. poultry.
4. Discussion
We have demonstrated that four populations of cats have different spectra of food preferences, when these foods are made equally available. These differences appeared to be stable over the 12 weeks of testing. The three groups of farm cats, taken as a whole, were very distinct from the house cats in their food preferences, more so than the farm groups were from each other; we can be sure, beyond reasonable doubt, that there had been no interchange of individuals between the three farms within the past 10 years or more, so there is no reason to suppose that they would be less genetically diverse than
Ž .
all the cats house and farm taken together. Thus, a predominantly genetic explanation for the differences in food preference between the populations seems unlikely.
Current diet and previous feeding experiences are a more plausible cause of the preference profiles of the groups. The main difference between farm and house cats lay in their preferences for RB and HD. The low preference for RB among the house cats is likely to be due to neophobia, since it belonged to the food type that they were fed least often. The RB cannot have simply been unpalatable, since the farm cats, which were used to eating uncooked flesh, preferred it to CB. House cats may be less opportunistic than farm cats in their acceptance of unusual foods because they have had long experience of a regular, nutritionally balanced, food supply. Variations in strength of neophobia depending upon experience have been reported for rats and some other small
Ž .
mammals Cowan, 1983 .
The farm cats ate relatively little HD food, and there was no trend for them to eat more in the later tests than in the first. This suggests that neophobia, or simple lack of recognition that HD is edible, is unlikely to be the underlying mechanism for the low intake of HD at all the farms, since repeated exposures to unfamiliar foods usually result
Ž .
in increasing intakes Bradshaw, 1986 . Furthermore, their acceptance of CM and CF, also unfamiliar foods, was immediate, which indicates that unfamiliarity per se does not depress their intake. They were also more likely than the house cats to sample both of
Ž .
the foods in a test. Given that feline calicivirus FCV is widespread among farm cats,
Ž .
including the Ducklington colony Yamaguchi et al., 1996 , and causes ulceration of the mouth, it is possible that many of the farm cats found the HD food painful to eat.
the reduced preference which kittens display towards a single food fed for 16 weeks ŽMugford, 1977 , and similar shifts in preference observed in adult cats Thorne, 1982 .. Ž . The farm cats therefore appear to have adopted the strategy of preferentially eating foods which were rare or absent from their day-to-day diet, with the exception of the HD food, which they may have found mechanically difficult to eat. However, none of the differences between the house cats and the farm cats as a whole could be ascribed to a preference for rare food types, nor could the differences between individual house cats. A population of cattery cats, whose food supply was even more regular and balanced than that of typical house cats, was found to be have much weaker preferences for rare
Ž
foods presented simultaneously than cats with experience of foraging Church et al., .
1996 . Cats, which have been fed from birth on nutritionally complete foods, therefore appear to adopt a different strategy towards rare foods, largely based upon neophobia.
Acknowledgements
We are grateful to Richard White for advice on statistics, and to John Allen, Stuart Church and Rory Putman for advice and critical review of the manuscript.
References
Bradshaw, J.W.S., 1986. Mere exposure reduces cats’ neophobia to unfamiliar food. Anim. Behav. 34, 613–614.
Bradshaw, J.W.S., Goodwin, D., Legrand-Defretin, V., Nott, H.M.R., 1996. Food selection by the domestic´ cat, an obligate carnivore. Comp. Biochem. Physiol. 114A, 205–209.
Bradshaw, J.W.S., Horsfield, G.F., Allen, J.A., Robinson, I.H., 1999. Feral cats: their role in the population dynamics of Felis catus. Appl. Anim. Behav. Sci. 65, 273–283.
Church, S.C., Allen, J.A., Bradshaw, J.W.S., 1994. Anti-apostatic food selection by the domestic cat. Anim. Behav. 48, 747–749.
Church, S.C., Allen, J.A., Bradshaw, J.W.S., 1996. Frequency-dependent food selection by domestic cats. Ethology 102, 495–509.
Ž .
Cowan, P.E., 1983. Exploration in small mammals: ethology and ecology. In: Archer, J., Birke, L.A. Eds. , Exploration in Animals and Humans. Van Nostrand-Reinhold, London, pp. 147–175.
Everett, G.M., 1944. Observations on the behaviour and neurophysiology of acute thiamine deficient cats. Am. J. Physiol. 141, 439–448.
Greenwood, J.J.D., 1984. The functional basis of frequency-dependent food selection. Biol. J. Linn. Soc. 23, 177–199.
Legrand-Defretin, V., 1994. Differences between cats and dogs: a nutritional view. Proc. Nutr. Soc. 53, 15–24.´ MacDonald, M.L., Rogers, Q.R., Morris, J.G., 1984. Nutrition of the domestic cat, a mammalian carnivore.
Annu. Rev. Nutr. 4, 521–562.
McKnight, T., 1964. In: Feral Livestock in Anglo-America Vol. 16 Univ. of California Publications in Geography, Berkeley, pp. 1–87.
Morris, J.G., Rogers, Q.R., 1978. Arginine: an essential amino acid for the cat. J. Nutr. 108, 1944–1953.
Ž .
Mugford, R.A., 1977. External influences on the feeding of carnivores. In: Kare, M., Maller, O. Eds. , The Chemical Senses and Nutrition, II Academic Press, New York, pp. 25–50.
Rees, P., 1981. The ecological distribution of feral cats and the effects of neutering a hospital colony. In:
Ž .
Rozin, P., 1976. The selection of foods by rats, humans, and other animals. Adv. Study Behav. 6, 21–76. SAS Institute, 1982. SAS User’s Guide. SAS Institute, Cary.
Sturman, J.A., Garano, A.D., Messing, J.M., Imaki, H., 1986. Feline maternal taurine deficiency: effect on mother and offspring. J. Nutr. 116, 655–667.
Thorne, C.J., 1982. Feeding behaviour in the cat — recent advances. J. Small Anim. Pract. 23, 555–562. Yamaguchi, N., Macdonald, D.W., Passanisi, W.C., Harbour, D.A., Hopper, C.D., 1996. Parasite prevalence