ESTIMATING THE SPATIAL DISTRIBUTION OF PM
2.5CONCENTRATION BY INTEGRATING GEOGRAPHIC DATA AND FIELD
MEASUREMENTS
Liang Zhai a, Huiyong Sang a, Jixian Zhang a, Fang An a
Chinese Academy of Surveying and Mapping, Lianhuachi West Road 28, Haidian District, Beijing, 100830, [email protected]; [email protected]; [email protected]; [email protected]
KEY WORDS: air pollution, remote sensing, dust surface, industrial polluting source, correlation analysis,
multivariate regression analysis
ABSTRACT:
Air quality directly affects the health and living of human beings, and it receives wide concern of public and attaches great important of governments at all levels. The estimation of the concentration distribution of PM2.5 and the analysis of its impacting factors is significant for understanding the spatial distribution regularity and further for decision supporting of governments. In this study, multiple sources of remote sensing and GIS data are utilized to estimate the spatial distribution of PM2.5 concentration in Shijiazhuang, China, by utilizing multivariate linear regression modelling, and integrating year average values of PM2.5 collected from local environment observing stations. Two major sources of PM2.5 are collected, including dust surfaces and industrial polluting sources. The area attribute of dust surfaces and point attribute of industrial polluting enterprises are extracted from high resolution remote sensing images and GIS data in 2013. 30m land cover products, annual average PM2.5 concentration values from the 8 environment monitoring stations, annual mean MODIS AOD data, traffic and DEM data are utilized in the study for regression modeling analysis. The multivariate regression analysis model is applied to estimate the spatial distribution of PM2.5 concentration. There is an upward trend of the spatial distribution of PM2.5 concentration gradually from west to east, of which the highest concentration appears in the municipal district and its surrounding areas. The spatial distribution pattern relatively fit the reality.
1. INTRODUCTION
Air quality directly affects the health and living of human beings (Pope III C A, et al., 2002), and it receives wide concern of public and attaches great important of governments at all levels. Air quality monitoring is significant for environmental governance and ecological construction. The estimation of the concentration distribution of atmospheric particulates and the analysis of its impacting factors is fundamental for deeply understanding the spatial distribution regularity and further decision making of governments. Physical modeling and statistical analysis are two major approaches to estimate the atmospheric particulates concentration. The former methodology is mostly applied to simulate the process of particulate matters diffusion; and the latter is for spatial distribution using statistical methods. Among the statistical analysis studies, much research work focused on regression modeling analysis of Particulate Matter (PM) with MODIS Aerosol Optical Depth(AOD) and meteorological data, including temperature, precipitation, and wetness (A Van Donkelaar, 2010; Lee H J, 2011; Cordero L, 2013; Hui C, 2014), and many other researches established improved regression models taking land use data into consideration as well (Mao L, 2012; Hu X, 2013; Olvera H A, 2012; Beckerman B S, 2013; Moore D K, 2007; Ross Z, 2007; Hoek G, 2010; Eeftens M, 2012). These research studies provide important preliminary experience and knowledge. However, limited data from sparsely distributed environment monitoring stations and weather station reduce the accuracy of modeling estimation. In this study, multiple sources of
remote sensing and GIS data are integrated with air quality monitoring data and climate data to estimate the spatial distribution of PM2.5 concentration in Shijiazhuang, China, to make up the deficiency of limited air and weather data by utilizing multivariate linear and nonlinear regression modeling (Johnson R A, 1992).
2. STUDY AREA
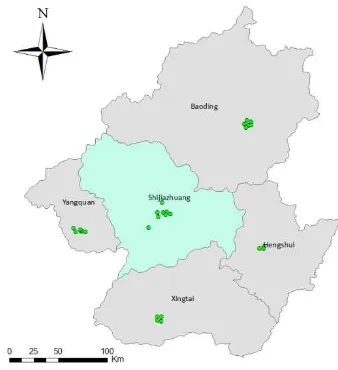
Figure 1. Location of Shijiazhuang City
3. EXPERIMENT
3.1 Framework of estimating the spatial
distribution of PM2.5 concentration
The simulation of spatially distributed PM2.5 concentration is achieved through four steps: data collection and preprocessing, extracting geographic variables, correlation analysis, and multivariate regression modeling and mapping.
Firstly, geographical factors including dust surfaces, land covers, industrial factories, national/provincial road and DEM data were collected and preprocessed. Secondly, ground geographic characteristics were extracted through GIS spatial analysis techniques, such as buffer analysis, proximity analysis. The third part was correlation analysis between observed PM2.5 concentration data and characteristic variables. Those characteristic variables with a significant correlation with observed PM2.5 data are selected for multivariate regression modeling. Multivariate linear regression modelling is compared with nonlinear regression modelling in order to find an optimal modeling method with a higher coefficient of determination (R2). Finally, PM2.5 concentration values at the virtual supplementary monitoring sites were achieved using the multivariate regression model. Based on the observed PM2.5 data from environment monitoring stations and virtual monitoring sites, the spatial distribution of PM2.5 concentration were mapped by using spatial interpolation method.
3.2 Data collection and preprocessing
In order to estimate the spatial distribution of atmospheric PM2.5 concentration, a few potentially influencing factors are considered, including ground dust surfaces, polluting industries, traffic emission, terrain, weather conditions, land covers. However, weather data are available from only one weather station, and has no obvious contribution in spatial statistical analysis.
Two major sources of PM2.5 are collected using remote sensing and GIS techniques, including dust surfaces and industrial polluting sources which are direct factors to produce fine particulate matters. Dust
surface polluters include open mining fields, construction fields, natural bare surfaces, and tread surfaces. Iron and steel producing industries, thermal power industries, heat production and others are all in the industrial polluting sources. The area and extent attributes of dust surfaces are extracted from color aerial photos, ZY-3 satellite imagery and GIS data collected or updated in 2013. The point attribute of industrial polluting factories are spatially located in the map according to the address of each industry based on the basic geographic information data or navigation map data.
Land cover map is produced by using 30m resolution LANDSAT-8 OLI multispectral images acquired in May of 2013. The land cover is classified into 6 main types including cultivated land (CD), grassland (GL), woodland (WL), artificial (AF), water body (WB) and bare land (BL). Considering the rapid dynamic daily change of PM2.5 in atmosphere, the available PM2.5 concentration values from the 8 environmental monitoring stations in Shijiazhuang are annually averaged. Similarly the MODIS AOD product is also annual mean data. Road network and DEM data are also utilized in the study as one reference data for regression modeling analysis.
3.3 Extraction of characteristic variables
As the existing 8 environment monitoring stations are all located at central region of Shijiazhuang city, 32 more virtual sites in remote areas without environment observing stations are randomly added. MODIS AOD data is an effective compensation for the limited observed PM2.5, due to their strong correlation (Chengcai L, 2005; Zhang H, 2009). The 32 virtual PM2.5 concentration values are extracted by utilizing cokriging spatial interpolation approach between MODIS AOD data and observed PM2.5 concentration data in Shijiazhuang and other 19 in the surrounding cities including Hengshui, Baoding, Yangquan and Xingtai city (Goovaerts P., 2000). The location of these environment monitoring stations are shown in Figure 2.
The 65 geographic attributes of the 40 environment observed/supplementary sites are calculated using GIS analysis methods according to their impacting extent and distance to PM2.5 observing sites, including shortest distance to the national-level road (D_NR), provincial level road (D_PR) and to the industrial factories (D_IF), and the number of different industrial factories (1km/2km/3km_IF), percentage of different dust surfaces (1km/2km/3km_DS), and percentage of different land covers (1km/2km/3km_ CD/GL/WL/AF/WB/BL) within the range of certain buffer radius(Sangrador J L T, 2008; Giannadaki D, 2014; Chen L, 2012).
3.4 Correlation analysis
Correlation analysis was carried out to analyze the relationship between the observed PM2.5 concentration data and the 65 geographic impacting attributes (Draper N R, 1996; Kleinbaum D, 2003).
Correlation
Tab.1 Correlation analysis results between PM2.5 and its significantly related variables
* * indicates a significant correlation at the 0.01 level (bilateral), and * indicates significant correlation at the 0.05 level (bilateral).
In table 1, significant correlation variables and their Pearson coefficients are listed, when Pearson coefficient is positive, the two variable is positively correlated with PM2.5, whereas a negative correlation (Johnson R A, 1992). The 22 geographic attributes with strong correlation above are utilized in regression modeling.
3.5 Multivariate regression modelling and
mapping
The coefficient of determination (R2) of the multivariate nonlinear regression analysis model is distinctly higher, when compared with that using the multivariate linear model (Draper N R, 1966). The multivariate nonlinear regression model (R2=0.783) is defined as:
PM2.5=-1.449×3km_BL+0.032×3km_BL2
-1.969×10-4×3km_BL3+5.541×10-6×2km_DS
+0.688×2km_DS2-2.734×2km_DS3+0.2314 (1)
×3km_AF-0.0029× 3km_AF2+2.0215×10-5
×3km_AF3+118.906
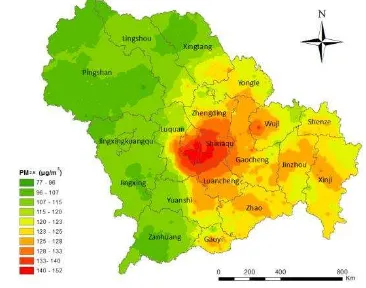
Among all geographic attributes that potentially impact the spatial distribution of PM2.5, concentration, the contribution of dust surfaces and construction fields is significant. The multivariate regression analysis model is applied to increase 500 more values of PM2.5 with randomly spatial distribution. An inverse distance weighted interpolation approach is adopted to estimate the spatial distribution of PM2.5 concentration in the whole Shijiazhuang city (Lu G Y, 2008). The spatial distribution of PM2.5 concentration was showed in Figure 3.
Figure 3. Spatial distribution of PM2.5 concentration The N-1 cross validation method is utilized to evaluate the estimation accuracy of the nonlinear regression model (Kohavi R., 1995.). The result showed a low average error of 1.3ug/m3 between the observed and predicted data.
3.6 Results
The spatial distribution of PM2.5 concentration shows an upward trend gradually from west to east, of which the highest concentration appears in the municipal district and its surrounding areas. The spatial distribution pattern relatively fit the reality. The eastern region is under a serious polluted condition, where polluting industries, construction sites and manual stacked wastes are widely distributed. Meantime, these areas are located in the low-lying plain with high population density and low vegetation coverage. The western and northern mountainous areas with higher elevation are sparsely populated with relatively lush vegetation, coupled with the multiple factors such as climate and wind direction. Therefore, the air quality in these regions is relatively better.
CONCLUSION
reference to the public. Due to the limitation of environment observing stations located in municipal district, it is difficult to precisely estimate the spatial distribution of PM2.5 concentration using multiple geographic data sources. Only geographic data are analyzed in this study, and other data including pollution emission of industrial factories and climate data, would be considered in further study.
ACKNOWLEDGEMENTS
This work was funded by: National Natural Science Fundation of China (41371406), China Geographical Conditions Monitoring Project (B1512), Open research fund of Key Laboratory of Geo-Informatics of National Administration of Surveying, Mapping and Geoinformation (7771514), Basic Research Fund of Chinese Academy of Surveying and Mapping (7771507, 7771509).
REFERENCES
A Van Donkelaar, Martin R V, Brauer M, et al., 2010. Global Estimates of Ambient Fine Particulate Matter Concentrations from Satellite-Based Aerosol Optical Depth: Development and Application. Environmental Health Perspectives, 118(6), pp. 847-855.
Beckerman B S, Jerrett M, Serre M, et al., 2013. A hybrid approach to estimating national scale spatiotemporal variability of PM2.5 in the contiguous United States. Environmental science & technology, 47(13), pp. 7233-7241.
Chen L, Wang Y, Li P, et al., 2012. A land use regression model incorporating data on industrial point source pollution. Journal of Environmental Sciences, 24(7), pp. 1251-1258.
Chengcai L, Jietai M, Lau A K H, et al., 2005. Application of MODIS satellite products to the air pollution research in Beijing. Science in China, 48(5), pp.209-219.
Cordero L, Malakar N, Wu Y H, et al., 2013. Assessing Surface PM2.5 Estimates Using Data Fusion of Active and Passive Remote Sensing Methods. British Journal of Environment and Climate Change, 3(4), pp. 547-565.
Draper N R, Smith H, Pownell E. 1966. Applied regression analysis. Wiley, New York, pp. 18-44&217-235.
Eeftens M, Beelen R, de Hoogh K, et al., 2012. Development of land use regression models for PM2.5, PM2.5 absorbance, PM10 and PM coarse in 20 European study areas; results of the ESCAPE project. Environmental science & technology, 46(20), pp. 11195-11205.
Giannadaki D, Pozzer A, Lelieveld J., 2014. Modeled global effects of airborne desert dust on air quality and premature mortality. Atmospheric Chemistry & Physics, 13(9), pp. 24023-24050.
Goovaerts P., 2000. Geostatistical approaches for incorporating elevation into the spatial interpolation of rainfall. Journal of hydrology, 228(1), pp. 113-129. Hoek G, Beelen R, Kos G, et al., 2010. Land use regression model for ultrafine particles in Amsterdam. Environmental science & technology, 45(2), pp. 622-628.
Hu X, Waller L A, Al-Hamdan M Z, et al, 2013. Estimating ground-level PM2.5 concentrations in the southeastern U.S. using geographically weighted regression. Environmental Research, 121(2), pp.1-10. Hui C, Qing L, Zhong-ting W, et al., 2014. Study on monitoring surface PM2.5 concentration in Jing-Jin-Ji regions using MODIS data. Journal of Meteorology & Environment, 2014.
Johnson R A, Wichern D W. 1992. Applied multivariate statistical ana lysis: Categorical and multivariate methods (Volume II). Prentice hall, Englewood Cliffs, NJ, pp. 73-97& 229-252.
Kleinbaum D, Kupper L, Nizam A, et al., 2003. Applied regression analysis and other multivariable methods. China machine press, Beijing, pp. 39-108. Kohavi R., 1995. A study of cross-validation and bootstrap for accuracy estimation and model selection. International Joint Conference on Artificial Intelligence, 14(2), pp. 1137-1145.
Lee H J, Liu Y, Coull B A, et al., 2011. A novel calibration approach of MODIS AOD data to predict PM2.5 concentrations. Atmospheric Chemistry & Physics, 11(15), pp.7991-8002.
Lu G Y, Wong D W., 2008. An adaptive inverse-distance weighting spatial interpolation technique. Computers & Geosciences, 34(9), pp.1044-1055.
Mao L, Qiu Y, Kusano C, et al., 2012. Predicting regional space–time variation of PM2.5 with land-use regression model and MODIS data. Environmental Science and Pollution Research, 19(1), pp. 128-138. Moore D K, Jerrett M, Mack W J, et al., 2007. A land use regression model for predicting ambient fine particulate matter across Los Angeles, CA. Journal of Environmental Monitoring, 9(3), pp. 246-252. Olvera H A, Garcia M, Li W W, et al., 2012. Principal component analysis optimization of a PM2.5 land use regression model with small monitoring network. Science of the Total Environment, 425(3), pp. 27-34. Pope III C A, Burnett R T, Thun M J, et al., 2002. Lung cancer, cardiopulmonary mortality, and long-term exposure to fine particulate air pollution. Journal of American Medicine Association, 287(9), pp. 1132-1141.