Long-term snow depth simulations using a modified
atmosphere–land exchange model
C.E. Kongoli, W.L. Bland
∗Department of Soil Science, 1525 Observatory Drive, University of Wisconsin-Madison, Madison, WI 53706, USA
Received 20 October 1999; received in revised form 15 March 2000; accepted 16 June 2000
Abstract
Significant areas of agricultural lands are subject to seasonal, relatively thin snow covers. This cover affects temperature and moisture in the soil beneath, watershed hydrology, and energy budgets. The depth of snow impacts soil freezing with implications for soil hydraulic properties and over-winter survival of certain crops. The objective of this study was to incor-porate a sophisticated snow cover routine into the atmosphere–land exchange (ALEX) model to simulate snow depths and dynamics of the relatively thin snowpacks of the US Upper Midwest. The ALEX model is used in several agricultural modeling projects, and as the land-surface parameterization in a mesoscale forecast model, but with only crude snow cover treatment. We combined parameterizations and empiricisms from the literature with the ALEX structure. Only three parameters were adjusted to find a set that worked well for 48 station years from three sites in Wisconsin. These were a correction for gauge catch deficiency, the air temperature that differentiates rain from snow, and a parameter related to drainage of liquid water from a melting snowpack. A further independent test included 13 years from one site in Minnesota. The air temperature differentiating rain from snow was also determined by analysis of weather observations, independently of the snow model. Both this analysis and the model revealed 0◦C to be the best choice for this temperature in our region. Results showed that
with a minimum of calibration the model gives good predictions of continuous snow depth, capturing critical processes of accumulation, ablation and melt in a wide variety of situations. Discrepancies between model and measurements generally originated from a single event and were mainly attributed to processes of blowing snow, misclassification of precipitation type, and anomalous new snow densities. Our results demonstrated the robustness of existing parameterizations and empiricisms for translating environmental observations into snow depth in dynamic simulation models. © 2000 Elsevier Science B.V. All rights reserved.
Keywords:Snow cover; Snow depth; New snow density; Rain–snow transition temperature; Precipitation; Blowing snow
1. Introduction
Significant areas of agricultural lands are subject to seasonal snow covers. This cover affects temperature and moisture in the soil beneath, watershed hydrology,
∗Corresponding author. Tel.:+1-608-262-0221;
fax:+1-608-265-2595.
E-mail address:[email protected] (W.L. Bland).
and energy budgets. Snow is an appreciable fraction of soil water recharge in some areas, representing an im-portant source of moisture for agricultural crops (e.g. western Canadian prairies; Granger and Male, 1978). The depth of snow regulates soil freezing (Flerchinger, 1991) and influences soil hydraulic properties and the over-winter survival of certain crops. Decreased hy-draulic conductivity of frozen soils increases the po-tential for high snowmelt runoff losses, while freezing
injury can cause yield loss to over-wintering crops, e.g. alfalfa (Kanneganti et al., 1998).
Motivated by water supply and safety concerns, the snow literature is dominated by studies of relatively deep snowpacks of mountainous or forested regions. Agricultural environments in the US Midwest more commonly have relatively thin snowpack, and issues of practical importance can be significantly different from those surrounding deeper snow. Compared to deep snowpacks, greater attention may be given to dates of complete disappearance in agricultural set-tings. Early ablation, for instance, can have important implications for alfalfa survival. Responses of envi-ronmental factors to thinner snow cover are more rapid than in deep snow, e.g. to the diurnal cycles of surface energy fluxes (Granger and Male, 1978).
Snow cover models vary in complexity. An early, essentially complete physically based model of snow cover was that of Anderson (1976). This numerical model included physical descriptions of snowpack accumulation, change of albedo, settling and com-paction, snowmelt, and meltwater retention and per-colation as well as the snowpack energy balance. The major advantage of models of this type is that they allow mechanistic understanding of snow cover processes and so should be transportable. However, their use is limited by data needs and computational burden. Extensions to Anderson (1976) model ex-panded the physical system to include the soil be-neath (SNTHERM; Jordan, 1991), and vegetation and residue (SHAW; Flerchinger and Saxton, 1989).
The objective of this study is to test the validity of Anderson’s parameterizations for the snow depths and dynamics of the relatively thin snowpacks of Wisconsin. Additionally, we needed to incorporate a sophisticated snow routine into the atmosphere–land exchange (ALEX) model, which we use in several agricultural modeling products (Anderson et al., 1998; Bland et al., 1998; Diak et al., 1998). The speed and simplicity of ALEX is suitable for landscape-to-global scale applications where calculations must be made at thousands of locations. One such application is our project to assess the impact of landscape position and time of year on optimizing wintertime disposal of an-imal manure. Additionally, ALEX is the land-surface parameterization in the CRASS mesoscale forecast model (personal communication; Diak, 1999), but with only crude snow cover treatment. Finally,
restruc-turing of the US National Weather Service during the past decade eliminated many sites where professional observers recorded snow cover changes. The future prospect is for fewer observations, so simulation will play an increasing role in real-time management problems.
This study is unique in the extent of record used to demonstrate the validity of the model: four stations totaling 61 site years of continuous hourly and daily weather observations. Detailed snow cover models such as SNTHERM and SHAW have so far been ap-plied to only shorter records for verification purposes typically extending 1–3 years. In contrast, snow cover routines subjected to longer-term verifications are generally less sophisticated (Motoyama, 1990; Yang et al., 1997). Additionally, the model created here is both complete in process as defined by Anderson (1976) and numerically efficient enough to integrate into a model suitable for mesoscale modeling projects. Because of computational limitations, snow submod-els used in regional or climate studies so far exhibit low to intermediate complexity (Slater et al., 1998), typically lacking internal processes (e.g. melt water retention and percolation) (Yang et al., 1997). In our work, the snow cover parameters were successfully applied to the entire data set, covering a wide variety of snow cover conditions. Results demonstrate that available parameterizations as implemented in ALEX are robust.
2. The ALEX model and modifications for snow
2.1. The soil–vegetation system
height. Upper boundary conditions are specified at some measurement height above the top layer, whereas lower boundary conditions are defined at some depth within the soil profile. Although the multi-layer struc-ture so defined comprises different materials (soil and vegetation as top layer), commonality of transport processes among materials allows ‘binding’ of these layers into one single computational block. This block is ‘routed’ into the numerical solution engine at the beginning of the time step with the new state variables determined at the end of the time step. For instance, the soil–vegetation system is treated as one block with respect to the transport of heat. Similarly, the soil is treated as another block with respect to infiltration of water. The solution at the end of each time step is ob-tained after all the mass and energy balance closures have been simultaneously satisfied. This structural simplicity allows addition of a manure layer, which, as mentioned earlier, is a future improvement needed for simulations of wintertime disposal of animal waste.
2.2. The modified atmosphere–snow–soil system
Building on the structure of ALEX, we introduced a snow cover overlaying the soil profile. Similar to the soil profile, the snow cover consists of an arbitrary number of layers bounded by pairs of nodes. The vegetation layer was removed and the series–parallel resistance network associated with this layer was replaced with the aerodynamic resistanceRa.
Two major modifications were made to accommo-date snow cover processes. One involved represen-tation of processes unique to snow layers (e.g. snow melt) and the other involved mimicking of a contin-uously changing snow cover while maintaining the structural consistency and conceptual simplicity of ALEX. For the snow layers, soil heat transport equa-tions were modified to include melt energy (Qm) as a source, computed as the energy excess above 0◦C.
The second major modification involved simulation of an unstable material as part of a multi-layer structure; unlike soil, snow undergoes significant accumulation, metamorphosis, compaction and ablation. As a result, layers of snow are added, expanded, contracted or disappear continuously. Similarly, nodes associated with snow layers are added, left out, and reordered continuously. When no snowpack is present, the sys-tem consists of the soil profile and the overlying air.
The model updates changes in layers overlying the soil profile at the end of each time step (hourly).
2.3. Main snow cover routines
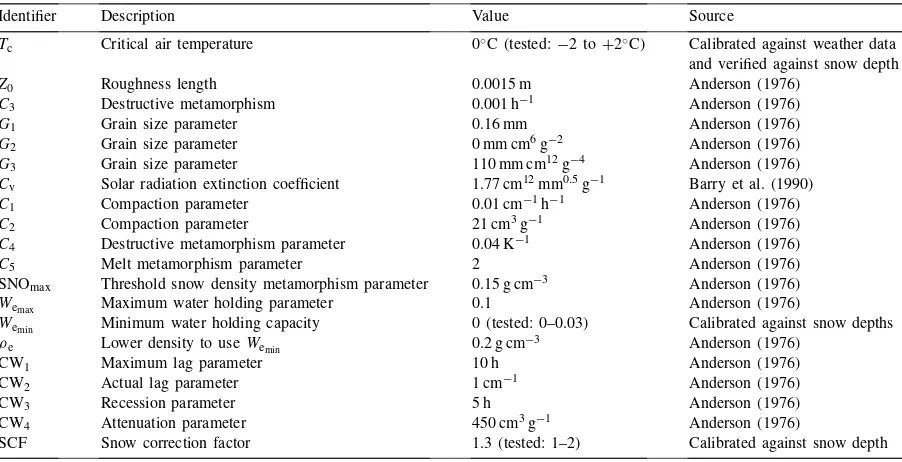
Important snow-related equations are discussed in this section. Values of most of the various empirical parameters were taken from the literature, as indicated in Table 3. Parameters that we found necessary to adjust are discussed later.
The density of new snow is computed according to a formula given by LaChapelle (1969):
ρns=
50+1.7(Tw+15)1.5, Tw>−15◦C
50, Tw<−15◦C (1)
whereρns is new snow density in kg m−3 andTw is
the wet bulb temperature in◦C. Compaction of each
layer of snowpack is based on a relationship reported by Kojima (1967) and Mellor (1964):
1
ρsp
∂ρsp
∂t =C1exp[−0.08(T0−T )]Wsexp(−C2ρsp)]
(2)
whereWsis the weight of the overlying snow,ρspthe
density of the solid phase of snow,Tthe snow temp-erature in ◦C, C
1 and C2 are the constants, and
T0=0◦C.
Destructive metamorphism is computed by the ex-pressions (Anderson, 1976)
whereC3andC4are the empirical parameters andρd
is a threshold density. If melting is under way, Eqs. (3) and (4) is multiplied by a parameter (C5) to account for the effect on metamorphism of liquid water contained in the snow layer.
Albedo of the snow is assumed to be independent of sun angle, and is computed from Anderson (1976):
whereCvis an empirical extinction coefficient andds
is the grain size diameter of ice crystals (mm). Grain size is calculated from Anderson (1976):
ds =G1+G2
whereG1,G2 andG3 are the empirical coefficients,
ρs the density of snow at the surface and ρl is the
density of liquid water. The albedo of snowpacks less than 4 cm thick is adjusted based on the albedo of the underlying material.
Melt water percolation in the snow is estimated us-ing the ‘lag and route’ approach originally adopted by Anderson (1976) and incorporated into the SHAW model by Flerchinger (1995, 1997). Melt water pro-duced in a snow layer begins to percolate after its wa-ter liquid holding capacity, often called the irreducible water saturation, is satisfied. The irreducible water sat-uration is analogous to the so-called field capacity of soil physics. The value of We is assumed to be at a
minimum (Wemin) if snow density exceeds a threshold value (ρe). If snow density is less than this threshold
value,Weis computed using the expression
We=Wemin+(Wemax−Wemin)
where Wemax is the maximum liquid water holding capacity (Anderson, 1976).
3. Data collection and weather inputs
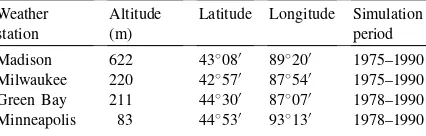
We investigated the ability of the model to predict snow depths at Madison, Milwaukee and Green Bay, WI and Minneapolis, MN during the January–April winter season for a 16-year period for Madison and Milwaukee, and a 13-year period for Green Bay and Minneapolis (Table 1). The stations represent
differ-Table 1
ent combinations of latitude and proximity to Lake Michigan. The official station at Madison was located at Dane County Regional Airport near southwest shore of Lake Mendota (approximately 39 km2in area). The station at Milwaukee was located about 6 km inland from Lake Michigan at Mitchell Field Airport. The Green Bay site was the Austin Straubel Field Airport, about 17 km from the bay. The Minneapolis site was the St. Paul Minneapolis International Airport.
During the period simulated, the sites were ‘first order’ stations within the US National Weather Ser-vice System. Data were obtained from CD-ROMs produced by EarthInfo Inc. (1998a,b), which contain hourly values of air temperature, dew point tempera-ture, wet bulb temperatempera-ture, humidity, wind speed and wind direction, precipitation amount, cloud cover, and present weather conditions. Modeled estimates of daily solar radiation and daily measurements of snow depth were obtained from Midwestern Climate Center, Champlain-Urbana, IL. Hourly solar radia-tion was estimated by partiradia-tioning the daily values according to hourly potential radiation. Snow depth readings were taken every day at 06.00 LST, nomi-nally following standard National Weather Service procedures. Doesken and Judson (1996) described these procedures as follows.
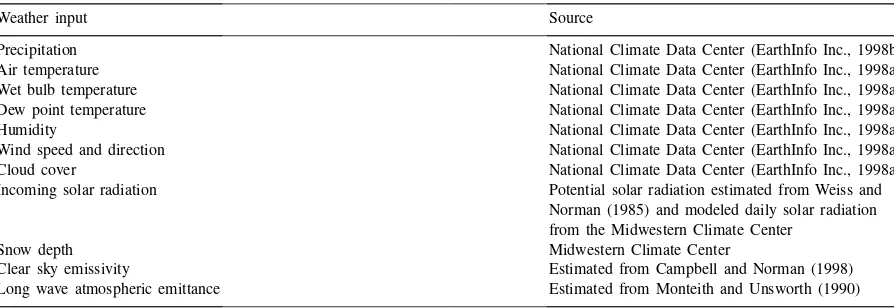
Table 2
The weather inputs to ALEX
Weather input Source
Precipitation National Climate Data Center (EarthInfo Inc., 1998b)
Air temperature National Climate Data Center (EarthInfo Inc., 1998a)
Wet bulb temperature National Climate Data Center (EarthInfo Inc., 1998a) Dew point temperature National Climate Data Center (EarthInfo Inc., 1998a)
Humidity National Climate Data Center (EarthInfo Inc., 1998a)
Wind speed and direction National Climate Data Center (EarthInfo Inc., 1998a)
Cloud cover National Climate Data Center (EarthInfo Inc., 1998a)
Incoming solar radiation Potential solar radiation estimated from Weiss and Norman (1985) and modeled daily solar radiation from the Midwestern Climate Center
Snow depth Midwestern Climate Center
Clear sky emissivity Estimated from Campbell and Norman (1998)
Long wave atmospheric emittance Estimated from Monteith and Unsworth (1990)
(Doesken and Judson, 1996). Table 2 gives the weather inputs to ALEX and the sources from which they were obtained and/or estimated. Precipitation type observations were used in ancillary analysis but are not used as input in model simulations.
4. Model development
Initial model development was conducted with the 1975–1985 Madison data. This work identified the need to adjust three parameters: critical air temper-ature at which rain and snow can be differentiated (Tc), a snow correction factor (SCF) for efficacy of
gauge catch, and the minimum water holding capac-ity (Wemin) of the melting snowpack. The first two pa-rameters are in a sense external to the snow ablation model, while the third is integral to the snow liquid retention empiricism (Eq. (7)). For all three parame-ters, nominal values were obtained from literature, and adjustments were based on the 1975–1985 Madison dataset. Next, the adjusted values were applied to the remainder of the Madison records and to the Green Bay and Milwaukee datasets. Finally, sensitivity anal-ysis guided selection of a single set of values that pro-vided good model behavior over the complete records of the Wisconsin sites. This set was then applied to the Minneapolis site as a final test of the robustness of the parameter values. Simulations were conducted using the adjusted parameters and those from the lit-erature as described in Table 3. Each of the adjusted parameters is discussed in greater detail in the
follow-ing sections. All model runs were initialized at the end of November of the previous year. Criteria for model performance were overall statistics (e.g. correlation, bias, absolute departure, and root mean square error (RMSE)), graphical analysis and dates of complete melting of snow cover.
4.1. Parameterization of the form of precipitation
The first parameter we investigated in detail was the critical air temperature at which precipitation can be differentiated as rain or snow (Tc). Accurate
deter-mination of the form of precipitation is widely rec-ognized as critical to snowmelt-runoff modeling (US Army Corps of Engineers, 1956; World Meteorologi-cal Organization, 1986; Leavesley, 1989; Braun, 1991; Rohrer et al., 1994). Regardless of whether it is con-sidered a model parameter, critical air temperature is also a climatological parameter that can be established (outside the model) through analysis of local obser-vations. The ‘present weather’ observations allowed us to initially derive this relationship independently of the complete model and then evaluate its impact on the model through sensitivity analysis.
Table 3
Parameter values for the calibrated snow energy model
Identifier Description Value Source
Tc Critical air temperature 0◦C (tested:−2 to+2◦C) Calibrated against weather data
and verified against snow depth
Z0 Roughness length 0.0015 m Anderson (1976)
C3 Destructive metamorphism 0.001 h−1 Anderson (1976)
G1 Grain size parameter 0.16 mm Anderson (1976)
G2 Grain size parameter 0 mm cm6g−2 Anderson (1976)
G3 Grain size parameter 110 mm cm12g−4 Anderson (1976)
Cv Solar radiation extinction coefficient 1.77 cm12mm0.5g−1 Barry et al. (1990)
C1 Compaction parameter 0.01 cm−1h−1 Anderson (1976)
C2 Compaction parameter 21 cm3g−1 Anderson (1976)
C4 Destructive metamorphism parameter 0.04 K−1 Anderson (1976)
C5 Melt metamorphism parameter 2 Anderson (1976)
SNOmax Threshold snow density metamorphism parameter 0.15 g cm−3 Anderson (1976)
Wemax Maximum water holding parameter 0.1 Anderson (1976)
Wemin Minimum water holding capacity 0 (tested: 0–0.03) Calibrated against snow depths ρe Lower density to useWemin 0.2 g cm
−3 Anderson (1976)
CW1 Maximum lag parameter 10 h Anderson (1976)
CW2 Actual lag parameter 1 cm−1 Anderson (1976)
CW3 Recession parameter 5 h Anderson (1976)
CW4 Attenuation parameter 450 cm3g−1 Anderson (1976)
SCF Snow correction factor 1.3 (tested: 1–2) Calibrated against snow depth
if precipitation form is required as an input, relative amounts during mixed or short-term interval transi-tional events cannot be readily detected by visual ob-servations or by the most sophisticated precipitation sensors in use today.
Most parameterization studies evaluate air tem-perature as predictor of precipitation form calibrated against direct observations (e.g. Rohrer et al., 1994). These studies suggest that Tc is generally higher
than 0◦C, but can vary widely depending on climate,
location and season. US Army Corps of Engineers (1956) suggested air temperatures in the range of 0.5–1◦C, whereas Martinec and Rango (1986) and
Braun (1991) referred to maximum values as high as 5.5 and 7◦C, respectively. Rohrer et al. (1994)
de-terminedTcvalues for individual weather stations in Switzerland and found that they are between 0 and 1.5◦C. Based on about 1000 weather observations of
surface air temperature and precipitation form, Auer (1974) determined that atTc=2.5◦C probabilities of
rain and snow were equal.
Snow cover simulations using rain–snow transition temperature as a model parameter suggest that its value can have significant impact. Based on the study of Auer (1974), Yang et al. (1997) used a critical air
tem-perature of 2.5◦C as model parameter for long-term
snow cover simulations at six stations located in the former Soviet Union. However, they found significant improvement in RMSE of simulated versus measured snow water equivalents when this parameter was set at 0◦
C. Yang et al. (1997) attributed the difference between their results and those of Auer to the effects of different climates.
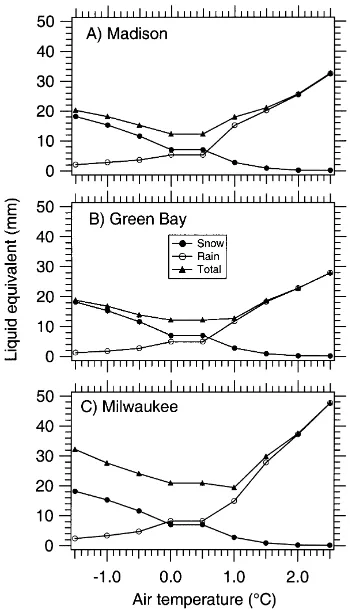
We investigated the role and best value of Tc in
our region by two means. In the first, we used hourly records of precipitation and air temperature along with the present weather observations (period for Wiscon-sin stations in Table 1, limited to days of year 1–100). From these records, we computed the amounts of liq-uid precipitation in the form of snow, mixed rain and snow, and rain that would be misclassified at pre-scribed air temperature values. The best value ofTc
minimized total liquid equivalent of misclassified pre-cipitation. In the second, we compared evaluations of model performance at various values ofTc.
4.2. Discussion of SCF
precipitation that falls (Doesken and Judson, 1996), so a factor greater than one should be applied to snow equivalents of recorded precipitation. Because of the wide variability of SCF from storm to storm and the uncertainty associated with its determination, a mean snow correction factor is applied to all recorded snow equivalents at a site, and determined by calibra-tion (Anderson, 1973). Wind speed at gauge height and gauge type are widely recognized as the two key factors that have a major impact on SCF values (Goodison, 1978). SCF values can be as high as 2.2 if high wind speeds occur or gauges are unshielded (Doesken and Judson, 1996; Yang et al., 1997). For shielded rain gauges, Anderson (1976) determined snow correction factors for a number of snow sea-sons, and for wind speeds between 2.2 and 4.6 m/s at gauge height he found SCF values between 1 and 1.25.
4.3. Discussion ofWemin
Minimum irreducible water saturation (Wemin) im-pacts the amount of liquid water retained by the snowpack Eq. (7), which, in turn, affects meltwa-ter percolation. This paramemeltwa-ter generally has little effect on snowmelt, except during major melt or rain-on-snow events (Anderson, 1973). It is generally a calibrated parameter ranging from 0 to 3% (Ander-son, 1973, 1976; Barry et al., 1990; Flerchinger, 1995, 1997). The SNTHERM model (Jordan, 1991) has incorporated a somewhat different parameterization, in the form of the empirically derived Darcy’s equa-tion. In this treatment, water transport is governed by capillary pressure and gravity forces. For the snow layers, however, capillary pressure is neglected. The final equation contains a number of empirical param-eters related to gravity drainage including minimum irreducible water saturation. As a result, the physical basis for Jordan’s equation is similar to Eq. (7). We chose the expression given by Eq. (7) because it has fewer empirical parameters.
5. Results and discussion
Results are presented below for the climatological analysis of Tc, followed by the statistical
measure-ments of model accuracy and sensitivity analysis. We
then review measured and modeled time series of snow cover and dates of complete snow disappearance.
5.1. Climatological analysis of critical air temperature
Results of our climatological analysis show that the minimum amount of misclassified total liquid precipi-tation occurred over the 0–0.5◦C interval for Madison
and Green Bay, and at 1◦C for Milwaukee (Fig. 1).
At these values of Tc, average annual misclassified
amounts were 12 mm liquid depth for Madison and Green Bay, and 19 mm for Milwaukee, split roughly in half between each category (snow and rain). In relative terms, only 9% of total liquid precipitation that falls over the first 100 days of year was misclassified for
Table 4
Snow depth statistics for ALEX output with respect to SCF
SCF Madison
aThe calibrated parameter value.
Madison, and only 10% for Green Bay and Milwau-kee. Misclassified precipitation was the same at 0 and 0.5◦C because temperatures were reported with a
res-olution of 1◦F, or 0.56◦C. A single threshold of 0◦C is
appropriate for the three stations, as the difference be-tween the amount of misclassified precipitation at this value and the amount at 1◦C for Milwaukee was small.
5.2. Statistical and sensitivity analysis
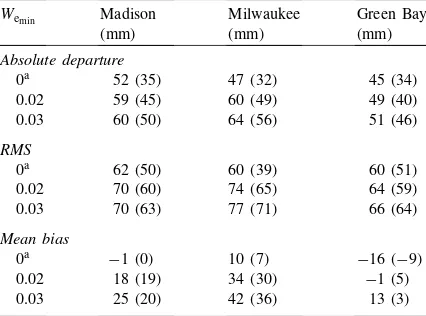
We calculated several statistics to compare simu-lated and measured snow depths (Tables 4–6). These
Table 5
Snow depth statistics for ALEX output with respect toWemin Wemin Madison
(mm)
aThe calibrated parameter value.
Table 6
Snow depth statistics for ALEX output with respect to critical temperature (Tc)
Air temperature
aThe calibrated parameter value.
statistics include all years as shown in Table 1. Reported are average RMSE, absolute departure and bias for several model runs. Each table reports statis-tics when one parameter is changed with others set at the calibrated values. Statistical results summarized in these tables refer to computations done for days with measured and predicted snow on the ground, and for the entire 100-day period of simulation (values in parenthesis). Correlation between measured and mod-eled snow depth was calculated, but proved insensitive to parameter selection, ranging only 0.78–0.9 over the parameter ranges in Tables 4–6. This insensitivity is expected when comparing simulated and measured cumulative time series.
stations (Table 4), although 1.3 is acceptable also for Madison. For the estimated mean wind speed around 13 km h−1 at gauge height at each site, a SCF value of 1.3 is reasonable (e.g. Doesken and Judson, 1996). Minimum liquid water holding capacity (Wemin) sig-nificantly impacted simulated snow depths, especially during major melt events, and the date of complete snow disappearance. When this parameter was set at the value of 0.03 (Anderson, 1976), delays of melt occurred irrespective of the value of SCF. Changing other parameters in Eq. (7) did not significantly affect model predictions of dates of snow cover disappear-ance and overall model performdisappear-ance. We also found that at Wemin=0.03, snow densities generated by the model during snowmelt were unreasonably high. Set-ting this parameter at zero eliminated this problem, as well as improved both predictions of dates of snow disappearance (Fig. 2) and overall model performance (Table 5).
For the critical air temperature (Tc), lowest
depar-tures and RMSEs are obtained at 0◦C for the three
stations (Table 6). This confirms our climatological analysis on this parameter. At 0◦C, the model captures
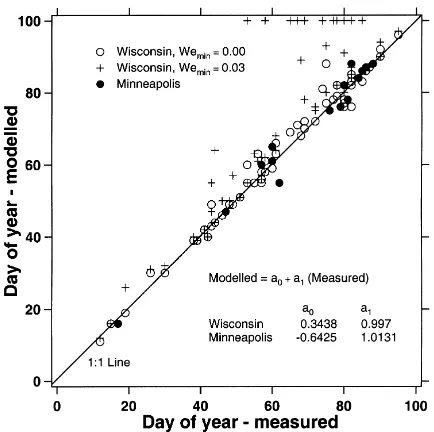
Fig. 2. Measured vs. simulated day of year of snow cover dis-appearance for accumulations over 0.1 m at the three Wisconsin stations and Minneapolis, MN. Regression coefficients refer to simulations done with the calibrated parameter set, for which Wemin=0.
all major events, and errors resulting from misclassi-fications are relatively minor, as previously discussed. Improved classification of precipitation type will likely require a parameterization involving more than Tc,
perhaps synoptic and upper air weather conditions.
5.3. Reproduction of snow depth patterns and dynamics
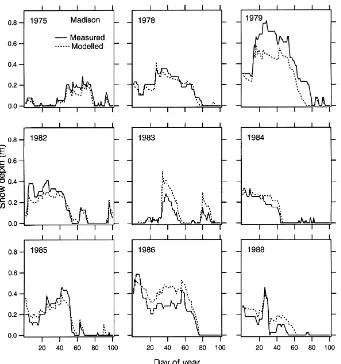
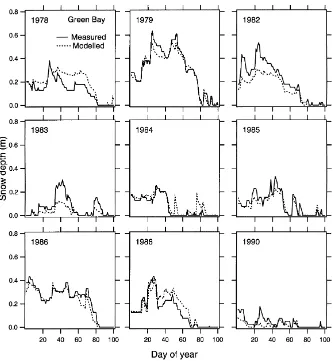
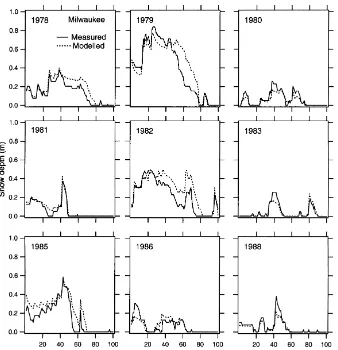
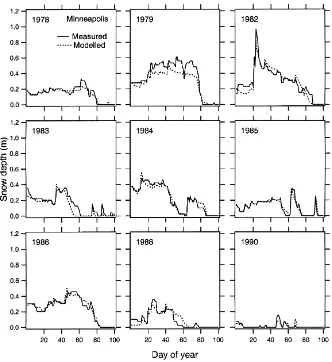
Subjective study of time series of snow depth both measured and modeled is a powerful demonstration of the ability of the model. Graphs of simulated versus measured daily snow depths revealed that the model captured snow dynamics well, reproducing snow ac-cumulation and ablation in a wide variety of situations (Figs. 3–6). Figures show the 9 years with the great-est snow depths observed during the period of simu-lation. At each location years of lower snow depth did not reveal any model weakness, but did little to prove its ability. While we do not have water equivalents to check the model, the date of snow cover disappear-ance does provide one unambiguous check on model estimates of total liquid equivalent of the snowpack (Fig. 2).
Major departures apparently resulted from misclas-sification of precipitation, blowing snow, and varia-tions of new snow density not captured by current empiricisms (Table 7 and Figs. 3–5). Departures gen-erally originated from a single event and then caused poor agreement for many days afterward, e.g. in 1978, 1979 and 1982 at Milwaukee departures originated on days 27, 45 and 20, respectively (Fig. 5).
Misclassified precipitation by the model results from snow occurring at air temperatures above the se-lectedTc, or from rain occurring below this value. For
example, in 1979 at Milwaukee (Fig. 5) departures resulted from a misclassification on day 45, when records revealed that this event was accompanied by freezing rain occurring well below 0◦C. Similarly, in
1986 at Madison (Fig. 3), the observed freezing rain on days 32 and 35 was misclassified by the model as snow.
Fig. 3. Measured vs. simulated snow depths for the 9 years of greatest snow accumulation during the simulated period at Madison.
of snow by wind predominates (Pomeroy et al., 1998). Redistribution by wind forms snow covers of highly variable depth and density (Pomeroy et al., 1997).
Blowing snow may have contributed to overestima-tion of simulated snow depths in 1979 and 1982 for Milwaukee. In 1982, for instance, a significant snow event occurred on day 20, producing a recorded daily liquid precipitation of 9 mm (as corrected by SCF) and converted into a daily snow depth increase of about 13 cm by the model. However, recorded snow depth never reflected that event, suggesting that all of the new snow may have been transported away from the site of measurement. This is supported by weather
records, which indicate that blowing snow accompa-nied the event. At Green Bay in 1978, discrepancy be-tween modeled and measured snow depths began on day 25. According to the weather records, weather on day 25 and thereafter included blowing snow. No ex-planation other than blowing snow is available for the rapid ablation following day 25. We note that blowing snow was a frequent event for the three stations in-vestigated, especially for Milwaukee and Green Bay. However, these events did not prove to cause major problems other than the few reported above.
Fig. 4. Measured vs. simulated snow depths for the 9 years of greatest snow accumulation during the simulated period at Green Bay.
appreciably underestimated, e.g. 1983 at Green Bay. Weather records indicated that during the first two events observed new snowfall per unit of recorded liquid precipitation was significantly larger than pre-dicted by the model, i.e. the snow was of exceptionally low density. The presence of snow lighter than pre-dicted by Eq. (1) in the Green Bay vicinity, however, was not substantiated by weather records at Brillion, a weather station about 40 km away from Green Bay. Perhaps discrepancies in observation procedures led to systematic errors at Green Bay in 1983. Similarly, in 1979 at Madison, the model significantly underes-timated snow accumulation, yielding a maximum de-parture of about 30 cm. In this year, comparison of
weather records of the three sites revealed similar snow patterns, but larger snowfall per unit of recorded liq-uid precipitation for Madison than for Milwaukee or Green Bay. In this case, however, a near-by observa-tion also recorded anomalously low snow density.
Fig. 5. Measured vs. simulated snow depths for the 9 years of greatest snow accumulation during the simulated period at Milwaukee.
departure 35 mm, and average RMSE 45 mm. While there is some ambiguity in the degree of independence of our assessments of model performance in Wiscon-sin, this is not the case with the Minneapolis records. This test and the sensitivity analysis for the other sites
Table 7
Summary of major departures of simulated vs. measured snow depths resulting from events not (correctly) captured by the model Station Year Description of departure
Madison 1979 Underestimation of simulated snow depths; lighter snow during major events Green Bay 1978 Overestimation of simulated snow depths; blowing snow during one major event Green Bay 1983 Underestimation of simulated snow depths
Madison 1986 Freezing rain misclassified as snow on several events
Milwaukee 1979 Overestimation of simulated snow depths; freezing drizzle misclassified as snow for one major event Milwaukee 1982 Overestimation of simulated snow depths; blowing snow during one major event
represen-Fig. 6. Measured vs. simulated snow depths for the 9 years of greatest snow accumulation during the simulated period at Minneapolis.
tative of many of the region’s agricultural fields. The physically based nature of the energy balance portions of the model in principle accommodates differences among land management, such as presence or absence of crop stubble.
6. Conclusions
This work extends the ALEX model (Anderson et al., 2000) for additional applications requiring in-clusion of snow cover. We incorporated the basic compilation of snow processes as defined by An-derson (1976) into the numerically efficient ALEX
model and evaluated the model against 61 site years of observations from four sites in the Upper Midwest. With a minimum of calibration, the modified ALEX model gives good predictions of continuous snow depth. The model reproduced snow depth patterns reasonably well for a wide variety of situations. Crit-ical snow cover processes of accumulation, ablation and melt were well captured. A separate analysis of the available data set established the best threshold value of the critical air temperature parameter (Tc)
differentiating rain from snow was 0◦C for the three
snow not represented in the model, misclassification of form of precipitation, and apparently anomalous new snow densities. Perhaps improved empiricisms forTc and new snow density must involve mesoscale
atmospheric column considerations. These results demonstrated the robustness of current parameteriza-tions for translating environmental observaparameteriza-tions into snow depth.
Acknowledgements
This research was supported by USDA-Hatch funds through project WIS03954.
References
Anderson, E.A., 1973. National Weather Service River Forecast System — Snow and Accumulation Model, NOAA Technical Memorandum NWS Hydro-17. US Department of Commerce, Silver Spring, MD, 217 pp.
Anderson, E.A., 1976. A Point Energy and Mass Balance Model of Snow Cover, NOAA Technical Report NWS 19. US Department of Commerce, Silver Spring, MD, 150 pp.
Anderson, M.C., Norman, J.M., Diak, G.R., Kustas, W.P., Mecikalski, J.R., 1997. A two-source time-integrated model for estimating surface fluxes using thermal infrared remote sensing. Remote Sens. Environ. 60, 195–216.
Anderson, M.C., Bland, W.L., Diak, G.R., Norman, J.M., 1998. An automated cranberry frost forecasting system with real-time ingestion of surface and satellite observations. In: Proceedings of the 23rd Conference on Agriculture and Forest Meteorology. AMS, Albuquerque, pp. 5–6.
Anderson, M.C., Norman, J.M., Diak, G.R., 2000. ALEX — a reversible model of atmosphere–land exchange. Agric. For. Meteorol. 101, 265–286.
Auer, A.H., 1974. The rain versus snow threshold temperatures. Weatherwise 27, 67.
Barry, R., Marcel, P., Stein, J., Plamondon, P., 1990. Application of a snow cover energy and mass balance model in a balsam fir forest. Water Resource Res. 26 (5), 1079–1092.
Bland, W.L., Anderson, M.C., Diak, G.R., 1998. A potato canopy humidity model driven by GOES and ASOS/AWOS data. In: Proceedings of the 23rd Conference on Agriculture and Forest Meteorology. AMS, Albuquerque, pp. 7–8.
Braun, L.N., 1991. Modeling the snow–water equivalent in the mountain environment. IAHS Publ. No. 205, pp. 3–17. Campbell, G.S., Norman, J.M., 1998. An Introduction to
Environmental Biophysics. Springer, New York, 286 pp. Diak, G.R., Anderson, M.C., Bland, W.L., Norman, J.M.,
Mecikalski, J.M., Aune, R.M., 1998. Agricultural management decision aids driven by real-time satellite data. Bull. Am. Meteorol. Soc. 106, 803–819.
Doesken, J.D., Judson, A., 1996. The Snow Booklet — A Guide to the Science, Climatology, and Measurement of Snow in the United States. Department of Atmospheric Sciences, Colorado Climate Center, Colorado State University, 85 pp.
EarthInfo Inc., 1998a. National Climatic Data Center Surface Airways, Boulder, CO.
EarthInfo Inc., 1998b. National Climatic Data Center Precipitation, Boulder, CO.
Flerchinger, G.N., 1991. Sensitivity of soil freezing simulated by the SHAW model. Trans. ASAE 34 (6), 2381–2389. Flerchinger, G.N., 1995. SHAW — Simultaneous Heat and Water
Model, Technical Documentation for SHAW, Version 2.1. Northwest Watershed Research Center, Agricultural Research Service, Boise, ID.
Flerchinger, G.N., 1997. SHAW — Simultaneous Heat and Water Model, Technical Documentation for SHAW, Version 3.2. Northwest Watershed Research Center, Agricultural Research Service, Boise, ID.
Flerchinger, G.N., Saxton, K.E., 1989. Simultaneous heat and water model of a freezing snow-residue–soil system. I. Theory and development. Trans. ASAE 32 (2), 565–571.
Goodison, B.E., 1978. Accuracy of Canadian snow gauge measurements. J. Appl. Meteorol. 17, 1542–1548.
Granger, R.J., Male, D.H., 1978. Melting of a prairie snowpack. J. Appl. Meteorol. 17, 1833–1842.
Jordan, R., 1991. A One-dimensional Temperature Model for a Snow Cover, Technical Documentation for SNTHERM 89. US Army Cold Regions Research and Engineering Laboratory, Hanover, NH.
Kanneganti, V.R., Bland, W.L., Undersander, D.J., 1998. Modeling freezing injury to calculate forage yield. II. Model validation and example simulations. Agron. J. 90, 698–704.
Kojima, K., 1967. Densification of seasonal snowcover. In: Physics of Snow and Ice Proceedings of International Conference on Snow Temperature Science, Vol. 1/2. The Institute of Low Tem-perature Science, Hokkaido University, Sapporo, Japan, pp. 67–75.
LaChapelle, E.R., 1969. Properties of snow. In: Hydrologic Systems. College of Forest Resources, University of Washing-ton, Seattle, p. 21.
Leavesley, G.H., 1989. Problems of snowmelt runoff modeling for a variety of physiographic and climatic conditions. Hydrol. Sci. J. 34 (6), 617–634.
Martinec, J., Rango, A., 1986. Parameter values for snowmelt runoff modeling. J. Hydrol. 84 (3/4), 197–219.
Mellor, M., 1964. Properties of Snow. US Army Cold Regions Research and Engineering Laboratory Monogram III-AI, Hanover, NH, 105 pp.
Monteith, J.L., Unsworth, M.H., 1990. Principles of Environmental Physics, 2nd Edition. Edward Arnold, London, 291 pp. Motoyama, H., 1990. Simulation of seasonal snow cover based on
air temperature and precipitation. J. Appl. Meteorol. 29 (11), 1104–1110.
Pomeroy, J.W., Marsh, P., Gray, D.M., 1997. Application of a distributed blowing snow model to the Artic. Hydrol. Process. 11, 1451–1464.
Rohrer, M.B., Braun, L.N., Lang, H., 1994. Long-term records of the snow water equivalent in the Swiss Alps. 1. Analysis. Nordic Hydrol. 25, 53–64.
Slater, A.G., Pitman, A.J., Desborough, C.E., 1998. The validation of a snow parameterization designed for use in general circulation models. Int. J. Climatol. 18, 595–617.
US Army Corps of Engineers, 1956. Snow Hydrology. US Army Corps of Engineers, Portland, OR.
Weiss, A., Norman, J.M., 1985. Partitioning solar radiation into direct and diffuse visible and near-infrared components. Agric. For. Meteorol. 34, 205–213.
World Meteorological Organization, 1986. Results of an intercomparison of models of snowmelt runoff. In: Morris, E.M. (Ed.), Modeling Snowmelt-induced Processes. IAHS Publ. No. 155, Oxfordshire, UK, pp. 103–112.