CURB-BASED STREET FLOOR EXTRACTION
FROM MOBILE TERRESTRIAL LIDAR POINT CLOUD
Sherif Ibrahim *, Derek Lichti
Department of Geomatics Engineering, University of Calgary, 2500 University Dr NW, Calgary, Alberta, T2N1N4
Canada - (smmibrah, ddlichti)@ucalgary.ca
Commission V, WG V/3
KEY WORDS: MTLS, point cloud, K-D tree, edge detection, curb, street floor
ABSTRACT:
Mobile terrestrial laser scanners (MTLS) produce huge 3D point clouds describing the terrestrial surface, from which objects like different street furniture can be generated. Extraction and modelling of the street curb and the street floor from MTLS point clouds is important for many applications such as right-of-way asset inventory, road maintenance and city planning. The proposed pipeline for the curb and street floor extraction consists of a sequence of five steps: organizing the 3D point cloud and nearest neighbour search; 3D density-based segmentation to segment the ground; morphological analysis to refine out the ground segment; derivative of Gaussian filtering to detect the curb; solving the travelling salesman problem to form a closed polygon of the curb and point-in-polygon test to extract the street floor. Two mobile laser scanning datasets of different scenes are tested with the proposed pipeline. The results of the extracted curb and street floor are evaluated based on a truth data. The obtained detection rates for the extracted street floor for the datasets are 95% and 96.53%. This study presents a novel approach to the detection and extraction of the road curb and the street floor from unorganized 3D point clouds captured by MTLS. It utilizes only the 3D coordinates of the point cloud.
* Corresponding author.
1. INTRODUCTION
The market is seeing a rapid growth in the utilization of mobile laser scanning systems in many road corridor applications. These systems capture huge point clouds that describe a very high detailed road scene. These systems are fast and accurate; but their use is still limited due to their cost and the huge amount of data they capture. It is important to automate the detection of different road furniture such as the curb and the street floor from the point cloud captured by these systems. The curb separates the street floor and side walk and is used to direct rainwater into the drainage system. Automatically extracting a highly detailed street floor helps in maintaining the pavement by estimating the road surface conditions. The location of bumps and dips can be detected to estimate the roughness of the road surface. The aim of this research is to automatically extract both the road curb and the street floor from an unorganized 3D point cloud of a road scene captured by a vehicle-based laser scanning system named TITAN.
2. LITRATURE REVEIW
Several researchers have proposed different techniques to extract the curb and the street floor from different data types, like satellite images, aerial imagery, airborne and terrestrial LiDAR point cloud. Eloïse et al. (2010) proposed a pipeline for extracting and modelling roads as 3D surfaces. They utilized both the laser point cloud acquired from a terrestrial mapping system and 3D road axes derived from aerial imagery. They detected the ground points by utilizing a clustering technique in which the seed points are obtained from analysing the elevation histogram of each vertical scan line.
Rao et al. (2006) have presented a method to segment ground and non-ground points. It is based on projecting the points onto a horizontal plane and then producing an accumulation image of cells. A cell is considered a part of the ground segment if it contains a few points with a small difference in elevation. The problem of this method is that it classifies points belonging to bottom of poles and tree trunks as a ground points. Goulette et al. (2007) analyzed the histogram of each scan line to detect ground points where the ground is a horizontal plane with a high point density. They refined the segmented ground by utilizing a fuzzy logic algorithm. This method is not applicable if the available terrestrial LiDAR data is in an unorganized format.
Eloïse et al. (2010) detected the curb stone by analyzing the gradient computed over the ground segment. They registered the road axes to the point cloud, by which the curb and road segments are ordered and connected. Identifying ground points by the lowest peak of the elevation histogram is not always practical as it includes points belonging to the bottom of objects lying on the floor level like, poles, tree trunks and pedestrian feet. El-Halawany et al. (2011) utilized an elevation gradient-based segmentation in 3D and 2D edge detection technique to extract the curb. Belton and Bae (2010) proposed a method to extract the 2D cross section of the curb by analyzing the curb profile. First, they stored the point cloud in a 2D grid, and extracted the road surface by selecting the lowest points in height in each grid cell. The curb line is extracted by fitting a curb profile and joining adjacent profiles to form a line representation of the curb. There are two main limitations for the proposed method by Belton and Bae. First, they assumed that the ground points are located on the lowest, smooth, horizontal surface. This assumption is not always true especially for roads which have underpasses. Second, identifying the road
surface based on the lowest points in height in each grid cell and fitting a curb profile will not always work with MLS data, which have a different nature compared to data captured by stationary scanning. MLS point clouds suffer many problems such as data artefacts, a combination of multiple sensors, and mis-registrations of multiples drivelines. A different approach analyzes the cross section profile by the laser range points (Chen et al., 2007). They detected the road boundary by analyzing the cross sections profiled by laser range points. Because the road surface appears as a straight line in the scan, the longest straight line in one scan line can be chosen in order to extract the road boundary. Jaakkola et al. (2008) developed a method for identifying the road curb from MTLS point clouds. This method applies 2D image processing techniques on intensity and height images. These images are used to detect the curb stones. They applied this method on a short road sample with a straight curb in one extension, where the street direction is known.
For the extraction of the street floor from aerial LiDAR many techniques have been utilized. Alharthy and Bethel (2003) used an intensity-based filtering to get road points, then a connected components techniques has been used to extract the road network. Hatger and Brenner (2003) utilized a GIS map to extract the road points. Oude Elberink and Vosselman (2006) utilized a 2D topographic database to recognize and model height discontinuities between different objects. Choi et al. (2007) extracted the road by a series of circle buffering clustering points. Jaakola et al. (2008) modelled the road surface as a triangulated irregular network by using a Delaunay Triangulation, where the input point clouds were in a scan lines format, the proposed technique can’t be used with unorganized point cloud format. Boyko and Funkhuser (2011) described a method for extracting the road from a large scale unstructured 3D point cloud, the proposed method separates the road from the other objects by the aid of a 2D road map. New methods are needed to deal with the unorganized 3D point clouds that do not have profile information. These methods should be generalized in order to deal with different point cloud densities on the street floor, different curb shapes and different road side objects.
3. STUDY AREA AND DATA
The utilized data in this study was captured by TITAN. TITAN is a mobile laser scanning system for highway corridor surveys; it can be deployed on a passenger vehicle or small watercraft, (Figure 1). Light detection and ranging (LiDAR), digital imagery and video data are collected from the survey platform while it is moving at traffic speeds, (Glennie, 2009). The system is georeferenced with a high accuracy Global Positioning System (GPS) – Inertial Measurement Unit (IMU).
Figure 1. TITAN mobile laser scanning system. Left: Close view. Right: Mounted on a truck.
www.ambercore.com
The tested datasets represent parts of Auriga Drive and Dalhousie Street in Ottawa (Figures 2 and 3). For the Auriga Drive dataset, the number of points is ~ 1.4 million and the point cloud density is ~ 400 pt/m2 on the street floor. The size
of the point cloud ( x, y, z) is approximately (106.4m, 16.7m, 12.0m). For the Dalhousie Street dataset, the number of points is ~ 2.4 million and the point cloud density is ~ 1000 pt/m2 on the street floor. The size of the point cloud ( x, y,
z) is (93.2m, 56.7m, 13.5m).
Figure 2. Auriga Dr dataset. Left: Input point cloud. Right: www.bing.com.
Figure 3. Dalhousie St dataset. Left: Input point cloud. Right: www.bing.com.
These two datasets have been chosen because they have different point cloud densities on the street floor, different road side objects (bushes in Auriga, building facades in Dalhousie), straight and curved curbs. These varieties allow testing the performance of the curb and the street floor extraction methodology.
4. PROPOSED METHODOLOGY
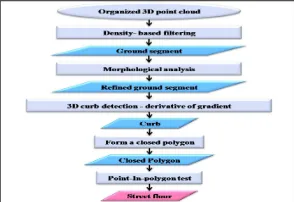
The proposed pipeline consists of a sequence of five steps (Figure 4): organizing the input irregular 3D point cloud and nearest neighbour search; density based segmentation to extract the ground segment; morphological analysis to refine the ground segment; derivative of Gaussian to detect the curb; solving the travelling salesman problem to form a closed polygon of the curb and point-in-polygon test to extract the street floor. The following sub sections describe in details the pipeline’s steps.
Figure 4. Street floor extraction pipeline.
4.1 First Step
The utilized data in this study comprise multiple drive lines already registered together. This results in an unorganized 3D point cloud, which means that there is no neighbourhood structure in the point cloud. For organizing the point cloud, K-D tree data structure technique is applied. This is important in order to accelerate the nearest neighbour search. The K-D Library for the Approximate Nearest Neighbour searching (ANN; Mount and Arya, 2006) has been used. After applying the K-D, all points are chosen as query points for the neighbourhood search.
4.2 Second Step
The second step aims at segmenting the point cloud into two main segments: ground and non-ground. This utilizes a density-based filtering. The point density is higher along the trajectory of the system and decreases with distance from it. The number of points inside a sphere of defined radius is simply counted. The density threshold can be set automatically based on the mean density of the point cloud on the street floor, which is provided by the scanning system and the number of the drive lines. By doing so, the street floor, the curb and the sidewalk are extracted as the ground segment. On the other hand, most road side objects are extracted as non-ground points. These objects have a lower point density because they are located away from the trajectory of the scanning system.
4.3 Third Step
The ground segment is refined in the third step in order to remove non-ground objects such as parts of trees, poles and buildings. This is done by analyzing the morphological characteristics of the neighbourhood of every point in the ground segment. The morphological characteristics can be tested by analyzing the planarity, the surface normal direction and the elevation gradient within the neighbourhood. The ground segment is refined by removing points that do not have a horizontal planar neighbourhood. The result of this step is a refined ground segment, which consists of just the street floor, the curb and the sidewalk. This segment is utilized as an input for the edge detection step.
4.4 Fourth Step
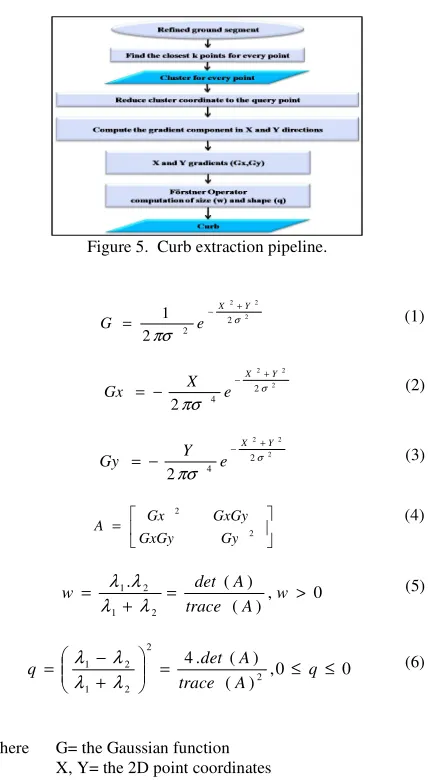
The fourth step applies a 3D edge detection algorithm to extract edges like the curb from the refined ground segment. This is performed by utilizing the derivative of the Gaussian function (Figure 5). The idea is to apply the 2D image processing edge detection techniques like the derivative of the Gaussian function in 3D (Equation 1). Equations 2 and 3 define the derivatives of the Gaussian in the X and the Y directions. The derivatives are computed for the K neighbour points of every query point. Then, for every point in the neighborhood the derivatives are multiplied by the Z coordinate of the point and summed up over the neighborhood. After that, the FÖrstner operator is formed by constructing the autocorrelation matrix of derivatives (Equation 4), (FÖrstner and Gülch, 1987). The autocorrelation matrix describes the structure of the neighbourhood, from which the neighbourhood can be classified into isolated point, planar surface or linear edge. The classification is done based on the size (w) and shape (q), (Equations 5 and 6) of the error ellipse of the autocorrelation matrix, w and q are computed from the eigenvalues ( 1, 2). These eigenvalues define the axes of the error ellipse. They are computed in a closed form based on the
trace and determinant of the autocorrelation matrix. An interest point is present if the given thresholds values wmin and qmin are exceeded.
Figure 5. Curb extraction pipeline.
2
where G= the Gaussian function X, Y= the 2D point coordinates
= the standard deviation (width of Gaussian curve)
4.5 Fifth Step
Finally, a closed polygon is constructed from the detected curb and a point-in-polygon test is then applied to extract the street floor. The travelling salesman problem is solved to construct the closed polygon of the curb points and to sort them. This means that every two successive points of the curb will form an edge. This way of representing the curb as a closed polygon will help in extracting the street floor in case of an incomplete curb. The point-in-polygon test is simply classifies every point in the refined ground segment as either street floor or non-street floor. This is based on the crossing number, where the point is classified as street floor if the crossing number is odd.
5. RESULTS AND DISCUSSION
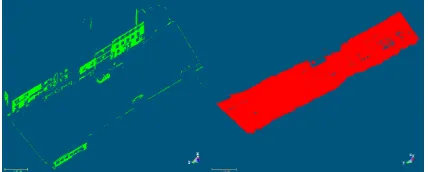
Figures 6 and 7 illustrate the distribution of the 3D density for both datasets. It is clear that the street floor has higher density compared to the other side objects. Figures 8 and 9 show the results of the 3D density-based segmentation for the Auriga Dr. and Dalhousie St. Datasets, respectively. Figures 8 and 9 (left)
show the non-ground segments while the right figures show the ground segment. The parameter that has been utilized to separate the ground and the non-ground is the number of points inside a sphere of radius 20 cm for both datasets.
Figure 6. 3D density of Auriga Dr data.
Figure 7. 3D density of Dalhousie St data.
As seen in Figures 8 and 9 (right), the extracted ground segments include some non-ground objects such as building facades, trees and side bushes. These objects are detected and removed from the ground segment based on analysing the shape and orientation. The thresholds of the refining parameters have been defined based on the properties of the objects of interest; for example, detecting points which have a horizontal planar neighbourhood like the street floor. The orientation of the surface normal direction should be close to 90o, the first and the second normalized eigenvalues should set close to 0.5 and the third one close to zero. The neighbourhood size and the search radius are defined based on the density of the point cloud.
Figure 8. Auriga Dr. Left: Non-ground segment. Right: Ground segment.
Figure 9. Dalhousie St. Left: Non-ground segment. Right: Ground segment.
Figures 10 and 11 show the histograms of the 3D density for both datasets. The mean density is used to estimate an initial
value for the density threshold. The used density thresholds are 5 and 28 points in a sphere of radius 20 cm for the Auriga and Dalhousie datasets, respectively. The Dalhousie dataset has a higher threshold because it has a higher density.
Figure 10. Histogram of the 3D density of the point cloud- Auriga Dr data.
Figure 11. Histogram of the 3D density of the point cloud- Dalhousie St data.
Figures 12 and 13 (right) show the results of refining the ground segments from the non-ground objects. The left figures show the non-ground objects that were removed by refining the ground segment. The results show that the non-ground segment obtained at the second and third steps can be used to detect other street furniture such as, poles, signs and trees. Extracting these objects becomes easier after removing the ground points. For example, the poles will be fully extracted without missing their bases as reported by (El-Halawany and Lichti, 2011). This is due to removing the ground points surrounding the base of the poles.
Figure 12. Auriga Dr. Left: Non-ground. Right: Refined ground segment.
Figure 13. Dalhousie St. Left: Non-ground. Right: Refined ground segment.
By differentiating the Gaussian function, a more robust edge-finder is formed. All curb points (Figures 14 and 15, right) have q values between 0.5 and 1. Non-curb edges are successfully filtered out based on the scaled value of w; the wmin threshold is set based on the number of points within the neighbourhood and the kernel width of the Gaussian function. The width of the Gaussian curve ( ) is set based on the average horizontal extension of the cross section of the curb. Some parts of the curb (Figures 14 and 15 rights) are missing in the final detected curb, especially at the places of road intersections, due to the noise in the input point cloud and the utilized thresholds.
Figure 14. The road curb of Auriga Dr. Left: truth data. Right: the extracted curb.
Figure 15. The road curb of Dalhousie St. Left: truth data. Right: the extracted.
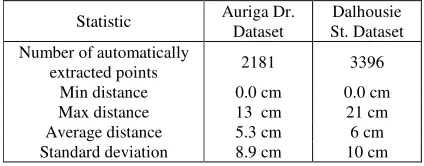
A manually extracted curb was used to evaluate the extracted curb. Table 1 shows how much the extracted curb fits the boundary of the street floor (the reference curb in Figure 14 and 15, left). The evaluation was performed based on measuring the distance between the extracted and the reference curb at each point. The K-D tree is utilized to get the closest point in the reference curb dataset to every point in the extracted curb dataset. The measured distance is close to the normal distance between the two curbs due to the highly point cloud density. The results show that the maximum distance between the point pairs for both datasets is 13 cm and 21 cm for Auriga and Dalhousie, respectively. Theses distances are large because some of the detected curb points do not represent the curb; they represent other edges like parts of parked vehicles and side bushes. The standard deviation of 9 cm and 10 cm are acceptable compared to the actual point spacing of 7 and 4 cm for Auriga Dr. and Dalhousie St. Datasets, respectively.
Statistic Auriga Dr. Dataset
Dalhousie St. Dataset Number of automatically
extracted points 2181 3396
Min distance 0.0 cm 0.0 cm
Max distance 13 cm 21 cm
Average distance 5.3 cm 6 cm Standard deviation 8.9 cm 10 cm
Table 1. Statistical evaluation of the extracted curb.
Solving the travelling salesman problem for the detect curb (Figure 16) allows the construction of a closed polygon and sorts the curb points. The sorting is done in order to connect every two successive curb points to form an edge. As can be seen from the results, the point-in-polygon test has performed qualitatively well.
Figure 16. The closed curb polygon. Left: Auriga Dr. Right: Dalhousie St.
Although the curb is not completely detected, the street floor is successfully extracted, (Figures 17 and 18, right). Some parts of the street floor are missing due to many reasons such as incomplete curb especially at the locations of curved curbs (road intersections), the presence of parked vehicles and the segmentation and refinement of the ground segment in the second and third steps.
Figure 17. The street floor of Auriga Dr. Left: truth data. Right: the extracted street floor.
Figure 18. The street floor of Dalhousie St. Left: truth data. Right: the extracted street floor.
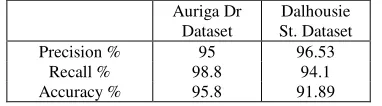
The extracted street floor is evaluated based on a manually extracted street floor (truth data). Table 2 lists the precision, recall and accuracy of the extracted street floor for both datasets. It is clear that the detection rate in both cases is almost the same, the recall and the accuracy of Auriga dataset is higher than Dalhousie St. dataset. There are two reasons behind this. First, the detected curb is incomplete due to the presence of parked vehicles, a pedestrian crosswalk and parking lot entrance. Second, the truth street floor data include some parked vehicles which are removed from the extracted street floor during the refinement process in the third step.
Auriga Dr Dataset
Dalhousie St. Dataset
Precision % 95 96.53
Recall % 98.8 94.1
Accuracy % 95.8 91.89
Table 2. Evaluation of the extracted street floor for Auriga Dr. and Dalhousie St datasets.
6. CONCLUSION AND OUTLOOK
In this research a pipeline for the curb and the street floor extraction from unorganized 3-D point clouds has been proposed. The pipeline is split down into 5 main steps. The proposed pipeline has been tested with two different datasets and the results are evaluated with a truth data. The results showed the efficiency of the proposed methodology and its applicability with different road scenes that have varieties of side objects and different point cloud densities. The results show that the non-ground segment obtained at the second and third steps can be used to detect other street furniture such as, poles, signs and trees. The curb and the street floor extraction results are quite promising in term of the utilization of only the 3D coordinates of the point cloud without utilizing any additional information. This study presents a novel approach to the detection and extraction of the road curb and the street floor from an unorganized 3D point clouds captured by an MTLS.
Future work will be focused on testing the proposed methodology on different road scenes. It will also focus on reducing the number of the processing steps and the extraction parameters. It is also planned for further research to tune and automatically determining the thresholds for the extraction parameters.
7. ACKNOWLEDGEMENTS
Thanks to the GEOmatics for Informed DEcisions (GEOIDE) network, GeoDigital International and Neptec Design Group Canada for their support, sponsoring this research and for providing the TITAN data.
8. REFERENCES
Alharthy, A., Bethel, J., 2003. Automated road extraction from LIDAR data. In: The American Society for Photogrammetry and Remote Sensing, Anchorage, Alaska, Unpaginated CDROM.
Belton D. and Bae K.-H., 2010. Automating post-processing of Terrestrial Laser Scanning point clouds for road feature surveys. In: The International Archives of the Photogrammetry, Remote Sensing and Spatial Information Science, Newcastle upon Tyne, UK, Volume XXXVIII - Part 5, 2010.
Boyko, T. Funkhouser, 2011. Extracting roads from dense point clouds in large scale urban environment. ISPRS Journal of Photogrammetry and Remote Sensing, 66 (2011) S2–S12.
Chen, Y.-Z., Zhao, H.-J., Shibasaki, R., 2007. A mobile system combining laser scanners and cameras for urban spatial objects extraction. In: The Sixth International Conference on Machine
Learning and Cybernetics Hong Kong, vol. 3, pp. 1729 –1733, 19-22.
Choi, Y.W., Jang, Y.W., Lee, H.J., Cho, G.S., 2007. Heuristic road extraction. In: International Symposium on Information Technology Convergence, IEEE Computer Society, Los Alamitos, CA, USA, 23-24 Nov. 2007. 338-342.
El-Halawany S. and Lichti D.D., 2011. Detection of road poles from mobile terrestrial laser scanner point cloud. In: The
International Workshop on Multi-Platform/Multi-Sensor
Remote Sensing and Mapping, Xiamen, China, 10-12 January
2011, 1-6.
El-Halawany S., Moussa A., Lichti D.D., El-Sheimy N., 2011. Detection of road curb from mobile terrestrial laser scanner point cloud. In: The International Archives of the Photogrammetry, Remote Sensing and Spatial Information Science, Calgary, Canada, Volume XXXVIII.
Eloïse D., Renaud B., Caroline B., 2010. Towards road modelling from terrestrial laser points. In: The ISPRS
Technical Commission III Symposium PCV 2010 -
Photogrammetric Computer Vision and Image Analysis, 1–3 September 2010 Saint-Mandé, France. Volume XXXVIII - Part 3A, 2010 Page(s) 293-298.
Förstner, W. and Gülch, E., 1987. A fast operator for detection and precise location of distinct points, corners and centres of circular features. In: The International Archives of the Photogrammetry, Remote Sensing and Spatial Information Science. Switzerland, pp. 281-305.
Glennie, C. 2009. Kinematic terrestrial Light-Detection and Ranging system for Scanning. Transportation Research Board of the National Academies, USA. 2105, 2009, 149p.
Goulette, F., Nashashibi, F., Abuhadrous, I., Ammoun, S. and Laurgeau, C., 2007. An integrated on-board laser range sensing system for on-the-way city and road modelling. Revue française de photogrammétrie et de télédétection 185, pp. 78–83.
Hatger, C., Brenner, C., 2003. Extraction of road geometry parameters from laser scanning and existing databases. In: The International Archives of the Photogrammetry, Remote Sensing and Spatial Information Sciences 34 (Part 3/W13), 225–230.
Jaakkola, A., Hyyppa, J., Hyyppa, H., Kukko, A., 2008. Retrieval algorithms for road surface modelling using laser-based mobile mapping. Sensors 8, 5238–5249.
Mount, D.M. and Arya, S, 2006. “ANN A library for approximate nearest neighbor search”.
http://www.cs.umd.edu/~mount/ANN.html (4 Aug. 2006).
Oude Elberink, S., Vosselman, G., 2006. Adding the third dimension to a topographic database using airborne laser scanner data. The International Archives of Photogrammetry,
Remote Sensing and Spatial Information Sciences, Bonn,
Germany, 36 (Part3), 92–97.
Rao, R., Konda, A., Opitz, D. and Blundell, S., 2006. Ground surface extraction from side-scan (vehicular) lidar. In: Proceedings of the MAPPS/ASPRS Fall Conference, San Antonio, Texas, USA.