A SEGMENT-BASED APPROACH FOR DTM DERIVATION OF AIRBORNE LIDAR
DATA
Dejin Tang a, *, Xiaoming Zhou b, Jie Jiang a, Caiping Li b a
National Geomatics Center of China - [email protected] b Beijing Institute of remote sensing information - [email protected]
Commission I, WG I/2
KEY WORDS: LIDAR, DTM, Segment-based Topological
ABSTRACT:
With the characteristics of LIDAR system, raw point clouds represent both terrain and non-terrain surface. In order to generate DTM, the paper introduces one improved filtering method based on the segment-based algorithms. The method generates segments by clustering points based on surface fitting and uses topological and geometric properties for classification. In the process, three major steps are involved. First, the whole datasets is split into several small overlapping tiles. For each tile, by removing wall and vegetation points, accurate segments are found. The segments from all tiles are assigned unique segment number. In the following step, topological descriptions for the segment distribution pattern and height jump between adjacent segments are identified in each tile. Based on the topology and geometry, segment-based filtering algorithm is performed for classification in each tile. Then, based on the spatial location of the segment in one tile, two confidence levels are assigned to the classified segments. The segments with low confidence level are because of losing geometric or topological information in one tile. Thus, a combination algorithm is generated to detect corresponding parts of incomplete segment from multiple tiles. Then another classification algorithm is performed for these segments. The result of these segments will have high confidence level. After that, all the segments in one tile have high confidence level of classification result. The final DTM will add all the terrain segments and avoid duplicate points. At the last of the paper, the experiment show the filtering result and be compared with the other classical filtering methods, the analysis proves the method has advantage in the precision of DTM. But because of the complicated algorithms, the processing speed is little slower, that is the future improvement which should been researched.
* Corresponding author. Address: 28# Lianhuachi road, Beijing, China. E-mail address: [email protected] (Dejin Tang). 1. MANUSCRIPT
The airborne lidar data filtering based on segmentation is a new method DTM derivation, its Basic theory is to study the relationship between region and region points which first be clustered before the classification.
Segment-based filtering, on the other hand, generates segments by clustering points based on surface fitting and uses topological and geometric properties for classification. Segment-based algorithms, by global looking of surroundings, can give more reliable results unlike the traditional filtering method based on the relationship between points.
In this paper, the segmentation step is clustered based on the Octree data structure, in the filtering algorithm to consider a regional block in the geometric and topological information as the classification criterion. Experiments show that the proposed filtering algorithm has a good effect.
2. MAIN FILTERING METHOD FOR LIDAR DATA
The basic principle of point cloud filtering algorithm is to consider the difference of elevation information in point cloud. ISPRS2008 Beijing conference published in Photogrammetry Remote, Sensing and Spatial Information Nobert Sciences Advances Pfeifer will do a more scientific and accurate classification algorithm.
Here, the approaches are grouped into morphological filters, densification approaches, surface based filters and segmentation
based filters. The first group looks “only” in a limited
neighborhood for determining the fate of a point. The densification algorithms have a concept of the terrain surface and start from a coarse representation to a finer and finer one. The surface based filters work in a different direction. First, many (or all) points are considered to belong to the surface, and iteratively points not belonging to the ground are excluded. Finally, the segmentation based approaches do not operate on the point directly, but first form larger compounds, i.e. segments. As segment can only entirely belong to the ground or not. Then, a rule system is applied to classify the segments on the basis of some segment feature.
3. SEGMENT-BASED FILTERING PRINCIPLE
3.1 The advantage of the Segment-based filtering
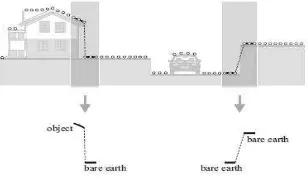
Traditional filtering methods to the relationship between a single point as a criterion, the general set height threshold, higher than the threshold point as the non-ground point. According to this thinking, then the graph on the left(Figure. 1), the elevation difference between building point and terrain point is higher than the threshold and it is correct classification, but for the right graph is also to meet the threshold condition, in fact these two points are the terrain points. A similar The International Archives of the Photogrammetry, Remote Sensing and Spatial Information Sciences, Volume XLI-B1, 2016
miscarriage of justice at the point and point filtering algorithms are insurmountable, the filter based on Segmentation methods consider the whole surface features, thereby reducing this case a miscarriage of justice.
Figure 1. Miscarriage of justice cases of the traditional filtering
3.2 The principle of the Segment-based filtering
Segmentation can be defined as aggregating and clustering points with similar feature (Filin and Pfeifer, 2006). Segmentation method is obtained to get a higher level of information from the points in a point cloud. In regard of this conception, the processing of LIDAR point clouds can be strengthened to analyze segments rather than individual laser points. Every point in the same segment should belong to the same class. Then the rationale behind of such algorithms is to use contextual and geometric information to classify points. Figure 2 shows the segmented points appear red color and non-segmented points show black. With assumption that all points in a segment have the same class type, filtering of point clouds can be deemed as filtering segments. The accuracy of segmentation is one of the most important elements for the quality.
Figure 2. The points of segment
4. THE SEGMENTATION OF OCTREE-BASED ALGORITHM
An octree structure recursively subdivides the 3D space of data extension into eight subspaces, namely octants or nodes (Samet, 1990). Connection of point sets are represented by node relationship of the octree. In this study, LIDAR point cloud is segmented into coplanar point clusters using an octree based split-and-merge algorithm. In the split process, the input point clouds are continuously divided into octree subspaces until each subspace contains only coplanar points. Going up the octree built in the split process, the merge process recursively links all neighboring subspaces containing coplanar points.
The coplanar property of a point set can be tested using a plane fitting algorithm.To evaluate the result of plane fitting, the
normal distance (
v
i) from the the point
P x y zi( ,i i i, )
of a point set to a plane, is determined as the following:Vi|axi byi czi d| (1)
The standard deviation of plane fitting (
ˆ
0), or the pointdiffuseness of m points can be estimated as follows equation (2) The estimation of the point diffuseness will be used to test the coplanar property of a point set.
0
2
1 3
ˆ
m Vi i
m
(2)
4.1 Octree-based split process
The split process starts from the root node which represents a cubic space whose dimension is the maximum extent of the given data. The root node will branch to eight leaf nodes, representing the divided eight equal-size subspaces, if the dataset does not pass the coplanar test, and the dataset is divided into eight subsets. Each leaf node recursively develops the branches until the point set in every subspace contains only coplanar points. The principle of the coplanar test is to check whether the points distribute closely on a plane. In other words, if there is a point that deviates from the best-fit plane by more than a set distance, the point subset fails the coplanar test.
Figure3 demonstrates an example of split process. Figure3 (a) shows that the space containing all points is recorded as the root node of the octree. The contained points in the root node did not pass the coplanar test, so that the space was split into eight sub-spaces (only four nodes were shown) and four best-fit planes were determined with respect to node 0, 1, 2, and 3, as shown in Figure3 (b). The data set in node 0, 2, and 3 passed the coplanar test and were not split further. However, the data set in node 1 should be split further until all of the sub datasets pass the coplanar test, as shown in Figure3 (c). The final result and the tree representation of the split process are shown in Figure 3(d) and (e)respectively.
Figure 3.The Octree-based split process
4.2 Octree-based merge process
The merge process combines planes of neighboring nodes in the octree formed through the split process if the points within the combined subspace pass the coplanar test. The process recursively finds two neighboring nodes in the octree, and merges corresponding subspaces to generate a combined plane.
At the merging step, nodes containing enough points to form a plane will have priority to merge over those containing only isolated points (one or two points). Two testing conditions: The first filter can be a check on the angle between the normal The International Archives of the Photogrammetry, Remote Sensing and Spatial Information Sciences, Volume XLI-B1, 2016
vectors of the planes. If the angle is larger than a preset angle
threshold (
ma), the two neighboring nodes are not proper for merging. The second threshold (
md) of the distance between two planes. If distance is larger than
md, not merging.Figure 4 demonstrates the merge process following up the example of split process shown in Figure 3. The octree formed by split has seven nodes including four nodes (0, 2, 3, and 10) containing coplanar points, two nodes (12, and 13) containing isolated points, and one empty node (11). The nodes containing coplanar points will be processed first, so that nodes 0 and 10 as well as nodes 2 and 3 will be merged to form a plane PL1and PL2, respectively. After the process of the nodes containing isolated points, node 13 will be merged to PL2, and nodes 1 2 remains isolated. Finally, it results in two merged planes and two isolate points.
Figure 4. The Octree-based merge process
5. THE FILTER CRITERION
The filter works to classify segment is based on the assumption of different attribute between terrain and object. These assumptions can be sorted into three categories: geometric assumption, topological assumption and Discontinuities assumption, which are all based on segment.
Geometric assumption
1) All points in a segment belong to same class
2) The space area of Bare Earth segment is larger than the biggest object segment
Topological assumption
3) Topological information of segment can be obtained by investigating neighbor points
4) Object segments are separated by significant height jump
Discontinuou s assumption
5) Object segment has higher altitude than its surrounding
6) Gradients in the Bare Earth have the maximum slope threshold which is less than the gradients of discontinuities
Table 1.The filter criterion base on the segments
5.1 Topological description
The topology is used to describe spatial distribution of segments. Figure 5 (a) shows a result of the segmentation topology. For example, a candidate segment S1 located in the center of a research area. By projecting all points into a planar surface and investigating the 2D neighborhood segments, segment S1 is adjacent to S2, S3 and S4, and spatial arrangement can be described in Figure 5(b), where the line between two segments stands for direct connectedness.
(a) (b)
Figure 5. (a) Spatial arrangement of segments
(b) Topological description of this region
5.2 Measurement of discontinuities
In order to measure height difference between segments, the first thing is to decide which part of segment is used to measure discontinuities. Due to discontinuities appears at the boundary of adjacent segments, it is preferred to measuring the height of boundary zone instead of the height of whole segment.
In order to measure height difference between segments, the first thing is to decide which part of segment is used to measure discontinuities. Due to discontinuities appears at the boundary of adjacent segments, it is preferred to measuring the height of boundary zone instead of the height of whole segment.
S1
S2 S3
S4
S
12
S
21
Figure 6. Boundary zone between segment S1 and S2
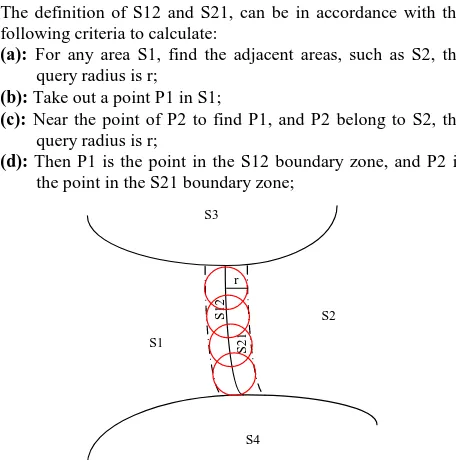
The definition of S12 and S21, can be in accordance with the following criteria to calculate:
(a): For any area S1, find the adjacent areas, such as S2, the query radius is r;
(b): Take out a point P1 in S1;
(c): Near the point of P2 to find P1, and P2 belong to S2, the query radius is r;
(d): Then P1 is the point in the S12 boundary zone, and P2 is the point in the S21 boundary zone;
S1
S2 S3
S4
S
12
S
21
r
Figure 7. Range of boundary zone in connected segments The International Archives of the Photogrammetry, Remote Sensing and Spatial Information Sciences, Volume XLI-B1, 2016
As generated boundary zone of two adjacent segments, all the points inside of two boundary zoneare used to measure discontinuities. Due to systematic and stochastic errors, the average height of boundary zone is used for calculating height Figure 8. Measuring height difference in profile view
If the difference of the mean height between two corresponding boundary regions is larger than a defined threshold, the two segments can be considered as discontinuities. The following Equation 3 illustrates decision of discontinuities of two segments:
|Mean Z( )S12Mean Z( )S21|threshold (3)
If the difference between these two boundary zones is smaller than the threshold value, the two adjacent segments appear with similar altitude. Then these two adjacent segments will be measuring the area of the segment.
According to assumption 5 in Table 1, all the segments surrounding S1 and S4 have arrows pointing to them (i.e. S1 and S4 are higher than their contextual segments). Thus, S1 and S4 can be classified as object segment. However, S2 have higher altitude than S4 but have lower height than object S1.The segment S5 has lower height than its context. For the case of S2 and S5, it is difficult to identify and classify them. The following list shows all possible relation cases between the candidate segment and its neighbor segments:
Case Description Representative
Candidate segment is above all its context
Total _above=Total_neighbors
Above all neighbors
3 Some of neighbors and candidate segment have similar altitude
have its context No context
6 Candidate segment is below its neighbor terrain segments
Below terrain segment
Table 2. different cases in filtering
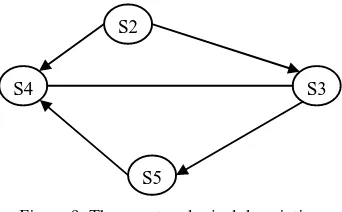
5.4 Rebuilding topological description
However, due to the complex object segment arrangement, filtering need an iterative step to classify all segments. After each iterative process, object segments are removed. Then topological information is rebuilt for all remaining segments.
S2
S4 S3
S5
Figure 9. The new topological description
5.5 Increasing radius for iteration radius of finding neighbor points is changed in each pass. Step 2: Topological description about spatial arrangement of segments is built in this step.
Step 3: For the adjacent segments, a comparison of height difference is done by using their boundary zone.
Step 4: After measuring height jump between segments, all points and merging the adjacent segment with similar altitude. Step 6: If there are still some segments which are not classified, it means that the candidate segment does not have contextual information of neighbor. Then, finding radius in step 1 should be increased for next iteration.
Step 7: After all segments have their class, the result of classification in one tile including terrain points and object points are written to a file.
Figure 10. The filtering frame
6. EXPERIMENTAL RESULTS AND ANALYSIS
Experimental data from the airborne airborne lidar LeicaALS60 ,
the data generated by the standard professional software as “las”
format, the Experimental results as shown in figure 10.
(a)The points cloud (b) The segment result
(c) The grid DEM (d) DEM with contour
(e)The DEM 3D effect chart
Fig. 11 The experimental result 1
Data
ma
md Iteration num Threshold
1438324 30 2m 6 0.5m
Table 3. parameter values
(a)The points cloud (b) The segment result
(c) The grid DEM (d) DEM with contour
(e)The DEM 3D effect chart
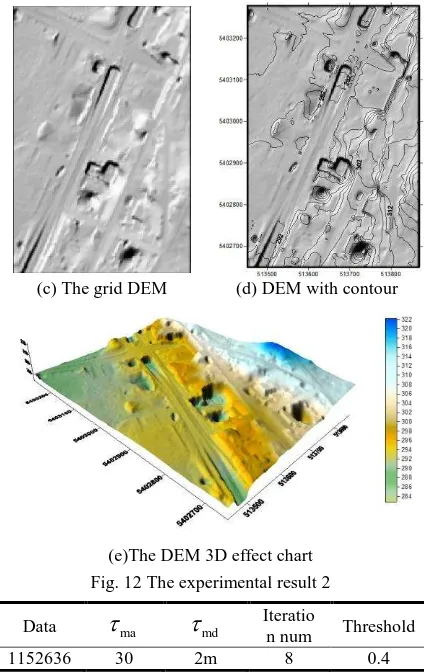
Fig. 12 The experimental result 2
Data
ma
md Iteration num Threshold
1152636 30 2m 8 0.4
Table 4. parameter values
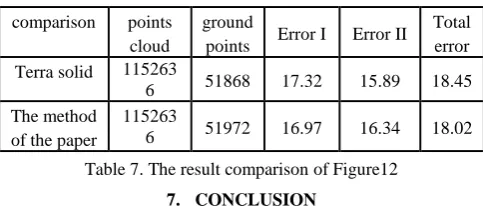
Fig 11-12(a)shows the raw point cloud. (b) shows the segment result based on the octree structure and different segment is labeled by the dissimilar color. (c) is the filter classification result.(d) is the grid DEM result with contour. (e)The DEM 3D effect chart, colored by the z value of the points, To test the accuracy of classification, the reference based on the algorithm of ISPRS 2003 report. Calculating the three types of filtering error and showed in the table 5. To illustrate the advantages of this method, the same data were filtered using professional lidar software (Terra solid) to compare the classification results in table 6, 7.
Filtering result Bare
earth Object Unused Total
Reference
Bare
earth a b c a+b+c
Object d e f d+e+f
Total a+d b+e c+f T
Table 5. The filter error
comparison points cloud
ground points
Error
I Error II Total error Terra solid 143832
4 30204 14.90 11.88 14.7
8 The method
of the paper
143832
4 30634 14.57 12.38 14.4
8
Table 6. The result comparison of Figure11 The International Archives of the Photogrammetry, Remote Sensing and Spatial Information Sciences, Volume XLI-B1, 2016
comparison points cloud
ground
points Error I Error II Total
error Terra solid 115263
6 51868 17.32 15.89 18.45 The method
of the paper
115263
6 51972 16.97 16.34 18.02
Table 7. The result comparison of Figure12
7. CONCLUSION
This article describes in detail the airborne lidar point cloud data in accordance with the octree clustering segmentation approach, using the structural characteristics of octree with common surface properties of the merging region for making the segmentation more accurate results, while improving efficiency. The design of the filter criteria into account regional elevation differences and topology information, proposed a complete cluster filtering method, and tested with the experimental data proved the feasibility and advantages of this method. However, the efficiency of the filter, due to the description of topological relations require constant updates, so the calculation speed has decreased, while the topological description of segments not perfect, still needs further improvement, this is the future of research and reform direction.
REFERENCES
Sithole, Vosselman. "ISPRS Comparison of Filters," ISPRS, 2003.
Sithole, Vosselman. "Experimental comparison of filter algorithms for bare-Earth extraction from airborne laser scanning point clouds," ISPRS Journal of Photogrammetry & Remote sensing, 2004.
Wack R, Wimmer A. "Digital terrain models reconstruction from point clouds and ground plans," IAPRS, vol.34, part 3/W4, pp: 37-44,2001. C. Jones (private communication).
Axelsson P E. "DEM Generation from Laser Scanner Data Using Adaptive TIN Models," IAPRS, 2000,33
(B4/1):110-117.
Vosselman. "Slope based filtering of laser altimetry data". IAPRS, vol. XXXIII, 2000.
Briese. "Airborne laser scanning and derivation of digital terrain models," ISPRS Journal of Photogrammetry & Remote sensing, 1999.
Roggero. "Airborne laser scanning clustering in raw data, "ISPRS Journal of Photogrammetry & Remote sensing, 2001.
Kilian J, Haalan, Englich M. "Capture and Evaluation of Airborne Laser Scanner Data, "IAPRS,1996,31(B3):383-388.
Brovelli M A, Cannata M. "Digital Terrain Model Reconstruction in Urvan Areas from Airborne Laser Scanning Data: the Method and the Example of the Town of Pavia(Northern Italy), "IAPRS,2002.34(2):43-48.
Eimqvist M. "Terrain Modeling & Analysis Using Laser Scanner Data," IAPRS,2001,34(3/W4):219 224.
Zhang K Q. "A Progressive Morphological Filter for Removing Non-ground Measurements from Airborne LiDAR Data, "IEEE Transactions on Geosciences and Remote Sensing, 2003,41(4):872-882.
Masaharu H, Ohtsubo K. "A filtering method of airborne laser scanner data for complex terrain, "IAPRS, Vol.34, part 3A/B,5 pages,Graz,2002.
Miao Wang, Yi-Hsing Tseng. "Automatic Segmentation of Lidar Data into Coplanar Point Clusters Using an Octree-Based Split-and-Merge Algorithm, "Photogrammetric Engineering & Remote Sensing Vol. 76, No. 4, April 2010, pp. 407–420.
Yuxiang He.A "segment-based approach for digital terrain model derivation in airborne laser scanning data, "International institute for geo-information science and earth observation.2010.
Meng, X, Currit, N, Zhao, K. Ground Filtering Algorithms for Airborne LiDAR Data: A Review of Critical Issues. Remote Sens. 2010, 2, 833-860.
Have also completely missed the significant body of work that already exists for planar LiDAR segmentation:
Lari, Z, Habib, A, & K wak, E. (2011, May). An adaptive approach for segmentation of 3D laser point cloud. In ISPRS Workshop Laser Scanning (pp.29-31).
Lari, Zahra, and Ayman Habib. "An adaptive approach for the segmentation and extraction of planar and linear/cylindrical features from laser scanning data." ISPRS Journal of Photogrammetry and Remote Sensing 93 (2014): 192-212.
Revised April 2016