ICESAT VALIDATION OF TANDEM-X I-DEMS OVER THE UK
L. Feng*, J.-P. Muller
Mullard Space Science Laboratory (MSSL), University College London, Department of Space & Climate Physics, Holmbury St Mary, Surrey, RH5 6NT, UK - (lang.feng.14, j.muller) @ucl.ac.uk
Commission IV, WG IV/3
KEY WORDS: Global DEM, validation, TanDEM-X intermediate DEM, ICESat elevations
ABSTRACT:
From the latest TanDEM-X mission (bistatic X-Band interferometric SAR), globally consistent Digital Elevation Model (DEM) will be available from 2017, but their accuracy has not yet been fully characterised. This paper presents the methods and implementation of statistical procedures for the validation of the vertical accuracy of TanDEM-X iDEMs at grid-spacing of approximately 12.5m, 30m and 90m based on processed ICESat data over the UK in order to assess their potential extrapolation across the globe. The accuracy of the TanDEMX iDEM in UK was obtained as follows: against ICESat GLA14 elevation data, TanDEMX iDEM has -0.028±3.654m over England and Wales and 0.316±5.286m over Scotland for 12m, -0.073±6.575m for 30m, and 0.0225±9.251m at 90m. Moreover, 90% of all results at the three resolutions of TanDEM-X iDEM data (with a linear error at 90% confidence level) are below 16.2m. These validation results also indicate that derivative topographic parameters (slope, aspect and relief) have a strong effect on the vertical accuracy of the TanDEM-X iDEMs. In high-relief and large slope terrain, large errors and data voids are frequent, and their location is strongly influenced by topography, whilst in the low- to medium-relief and low slope sites, errors are smaller. ICESat derived elevations are heavily influenced by surface slope within the 70m footprint as well as there being slope dependent errors in the TanDEM-X iDEMs.
*
Corresponding author
1. INTRODUCTION
For some 30% of the Earth’s land surface, downstream processing of EO data over land (and some continental shelves) for applications in land and atmospheric retrieval require corrections for topographic relief and/or slope and aspect. For traditional mapping applications, this requires a Digital Elevation Model (DEM) of the “bare earth” land surface. As spatial resolution of the VIS/IR/SAR images increases, so does the need to improve DEM spatial resolution and accuracy. Fortunately, such global DEMs are now being produced from spaceborne EO sensors, such as from SAR (SRTM, TerraSAR-X and TanDEM-TerraSAR-X), stereophotogrammetry (ASTER, SPOT, PRISM and IRS-3P) and lidar (ICESat) (Farr, Rosen et al. 2007, Wang, Cheng et al. 2011, Fujisada, Urai et al. 2012). EO-DEMs usually measure the observable canopy elevation which can vary from top-of-canopy through to the bare earth depending on the technique and wavelength employed. Each EO DEM comes with limited validation and in some cases use different datums, spheroids and co-ordinate systems from each other. DEM data, like other spatial data sets, have errors. Spatial data error sources have been summarized as data errors, processing errors and measurement errors (Pike 2002, Wechsler 2007). More specifically, DEM data contain three types of errors: blunders, systematic errors and random errors. Although all three types may be reduced in magnitude by refinements in technique and precision, they cannot be completely eliminated (Caruso 1987, Brown and Bara 1994). Moreover, these DEM errors are elusive and constitute uncertainty (Wechsler 2007). Now, the effect, DEM has errors, is often not noticed by DEM users. Currently, techniques to quantify DEM uncertainty are not readily available nor are they systematically applied to DEM data applications. Therefore it is critical to validate DEM
products for public users over large geographic areas (Gesch 1994, Danielson and Gesch 2011).
Until now, many studies have been done by scientists from all over the world. GPS is the usual method to validate the absolute accuracy of DEM products, which has been utilized in SRTM and ASTER G-DEM accuracy validation studies (Goncalves and Oliveira 2004, Eckert, Kellenberger et al. 2005, Rodriguez, Morris et al. 2005, Rodriguez, Morris et al. 2006, Reuter, Nelson et al. 2009, Team 2009, Tachikawa, Kaku et al. 2011, Fujisada, Urai et al. 2012, Li, Shi et al. 2013). However, such kinematic GPS transects only show planimetric features as they tend to be along existing roads. Meanwhile, external DEMs from sources such as lidar, radar altimetry and stereophotogrammetric data are also introduced to assess the quality of the DEMs. For example, terrain elevation derived from airborne lidar or ICESat/GLAS and satellite radar altimetry data from ERS-1/2 have frequently been used in many DEM quality accuracy assessments (Carabajal and Harding 2005, Berry, Garlick et al. 2007, Enßle, Heinzel et al. 2014). However, in reality, the primary challenge in validating a digital elevation model is obtaining a useful reference data set that is accurate enough and has suitable coverage to encompass the entire area of interest. NASA's Ice, Cloud and land Elevation Satellite (ICESat) employing the Geoscience Laser Altimeter System (GLAS) has collected a unique set of full-waveform Light Detection And Ranging (LiDAR) data with global coverage during campaigns that began in 2003 and ended late 2009, which provide globally-distributed elevation data of high accuracy (≤1m) that is well-suited for evaluating large area DEMs. Moreover, this ICESat/GLAS system provides a consistently referenced elevation data set with unprecedented accuracy and quantified measurement errors that can be used to The International Archives of the Photogrammetry, Remote Sensing and Spatial Information Sciences, Volume XLI-B4, 2016
generate Ground Control Points (GCPs) with a vertical accuracy high enough for validating DEMs all over the world.
Many papers have employed methods such as GIS visualization, GIS analysis and derived topographic statistical parameters (Bias, Relative Bias, Average Relative Absolute Difference, Root Mean Square Error (RMSE), Relative Root Mean Square Error (R-RMSE), Log Root Mean Square Error (L-RMSE), Average and Standard Deviation of N Simulations, Average and Standard Deviation of N Simulations, Maximum and Minimum of N Residuals), R-Squared statistics, t-test and P-value methods to evaluate the effect of errors and uncertainty in DEMs (Wechsler 1999, Hofton, Dubayah et al. 2006, Gutiérrez and Schnabel 2011, Zhao, Cheng et al. 2011, Austin, Muller et al. 2013, Li, Li et al. 2015). Through a data grant (iDEM_CALVAL0207) from DLR, an intermediate first-pass only TanDEM-X DEM (called i-DEM) was made available at 1/3rd arc-second (≈12.5m), 1 arc-second (≈30m) over the UK along with 3 arc-seconds for limited areas around the world. The objective of this study is to present the methods and implementation of statistical procedures for the validation of the TanDEM-X I-DEM vertical accuracy based on ICESat data over the UK in order to extrapolate these results, particularly with 3 arc-seconds across the globe.
2. TEST AREA AND METADATA INFORMATION
2.1 Test area
The study area is the UK (Figure 2-1 from Google), which lies on the European continental shelf, part of the Eurasian Plate. It is located off the north-west coast of continental Europe and it stretches over about ten degrees of latitude on its longer, north-south axis and occupies an area of 209,331 km2 excluding the smaller surrounding islands. The metadata information for this study is shown in Table 2-1 below. The reader can observe that the coordinate systems of the different DEMs are different. The data maps (based on OSGB36 ODN) of the test data and
ICESat data footprint are shown in Figure 2-1, Figure 2-2,
Figure 2-3, Figure 2-4, Figure 2-5 and Figure 2-6 below. The Elevation profile along an ICESat track (red rectangle in
Figure 3-1) is also shown in Figure 3-4, the difference between TanDEM-X I- DEM and ICESat data in this track
is variable, being shown in Figure 3-5.
Data Set: TanDEM-X I- DEM
Blue Sky DEM
ICESat GlAS 14
Coverage: UK & worldwide
(3”)
UK, Ireland
UK
Source:
DLR- TerraSAR-X
Blue Sky Ltd.
National Snow and Ice Data Centre, NASA
Resolution: 0.4” (≈12m) 1” (≈30m) 3” (≈90m)
10m or 5m
Horizontal accuracy <5m, Vertical accuracy < 1m (sub-meter)
with 172m spacing. ellipsoid:
WGS84-G1150
OSGB36 TOPEX Poseidon-Jason Ellipsoid
Vertical Datum:
WGS84-G1150
ODN TOPEX Poseidon-Jason Ellipsoid Projection: Geographic TM
projection
Geographic
Acquisition Date:
2011-13 - 10/2004-10/2008
Table 2-1 Experiment DEM Input datasets
2.2 TanDEM-X iDEM and Bluesky DEM
TanDEM-X (bistatic X-Band interferometric SAR) opens up a new era in space borne radar remote sensing. The first bistatic SAR mission is formed by adding a second, almost identical
Figure 2-1 Study area
(© Google 2015) Figure 2-2 TanDEM-X iDEM 12m
Figure 2-3 TanDEM-X
iDEM 30 m
Figure 2-4 TanDEM-X iDEM 90 m
Figure 2-5 Blue Sky DEM
30m Figure 2-6 ICESat GlA14
data in UK. Red line is footprint of ICESat data
spacecraft, to TerraSAR-X and flying the two satellites in a closely controlled formation flight with typical inter-spacecraft distances between 250 and 500 m (Moreira, Krieger et al. 2004, The International Archives of the Photogrammetry, Remote Sensing and Spatial Information Sciences, Volume XLI-B4, 2016
Zink, Krieger et al. 2008). From this mission (bistatic X-Band interferometric SAR), 12.5m, 30m and 90m TanDEM-X I-DEM data based on WGS84-G1150 Geographic coordinate system are obtained. Besides, Bluesky DEM, based on OSGB36 and ODN projection coordinate system, is a commercial 5m DTM from Bluesky Limited made available through the UK academic community from the LANDMAP project.
2.3 ICESat GLA14 data
The main objective of the Geoscience Laser Altimeter System (GLAS) instrument on-board the NASA ICESat satellite was to measure ice sheet elevations and changes in elevation through time. Secondary objectives included measurements of cloud and aerosol height profiles, land elevation and vegetation cover, and sea ice thickness. GLAS includes a laser system to measure distance, a Global Positioning System (GPS) receiver, and a star-tracker attitude determination system. The laser transmits short pulses (4 Nano seconds) of infrared light (1064 nanometres wavelength) and visible green light (532 nanometres). Photons reflected back to the spacecraft from the surface of the Earth and from the atmosphere, including the inside of clouds, are collected in a 1 metre diameter telescope. Laser pulses at 40 times per second will illuminate spots (footprints) 70 metres in diameter, spaced at 170-metre intervals along the Earth's surface (Schutz, Zwally et al. 2005).
The distance from the spacecraft to clouds and to the Earth's surface is determined from measurements of the time taken for the laser pulses to travel to the reflecting objects and return. The height of the spacecraft above the centre of Earth are determined from information collected by the GPS receiver in GLAS and a GPS network operated around the world for other purposes. The pointing of the laser beam, relative to the Earth's centre is determined by the star-tracker system. The knowledge of the laser pointing and the spacecraft position are combined to calculate the precise location of the footprint on the surface to a few metres' accuracy (Zwally, Schutz et al. 2002, Schutz, Zwally et al. 2005) .
The elevation of the surface at each laser footprint is the height of the spacecraft minus the measured distance to the surface. A standard parameterisation is used to calculate surface elevation for ice sheets, oceans, and sea ice, using the elevation of the maximum peak and no more than two Gaussian functions with a minimum spacing of 30 ns (4.5 m) between Gaussian centres. For land elevations, the centroid of the received pulse between signal start and end is used, shown in Figure 2-7; a maximum of six Gaussians is allowed with 5 ns (75 cm) minimum spacing. For land surfaces, the algorithm characterizes the return pulse by fitting Gaussian distributions to each mode (peak) in the waveform. Surface elevations over land are derived from the centroid of the return. Over most of the ice sheets, the accuracy of each elevation measurement is at the sub-decimetre level. Over land, however, the vertical accuracy of the elevation measurements is less due to the effect of surface roughness i.e. the combined effect of slope, vegetation and cultural features. Still, according to (Carabajal 2011), rigorous analysis has shown that for low relief locations in open terrain, the ICESat data returns elevation values with sub-metre accuracy (DHI 2014).
Data was collected from February 2003 to October 2009 during approximately month long observation periods, three times per year through 2006 and twice per year thereafter. These altimetry profiles provide a highly accurate and consistently referenced
elevation data set with quantified errors. Three lasers were used sequentially during the mission. Still, only data (GLAH14 product) acquired by Laser 3 was used for TanDEM-X iDEM validation, from October 2004 to October 2008.
Ellipsoid
Figure 2-7 ICESat coordinate system and ICESat waveform (Bhang, Schwartz et al. 2007, DHI 2014) over forest canopy relative to wavelengths signal from TanDEM-X and Bluesky DEM; the elevation measurements used in this study have been
calculated from the centroid of the received pulse between signal start and end, defined for alternate parameterization
3. METHODS
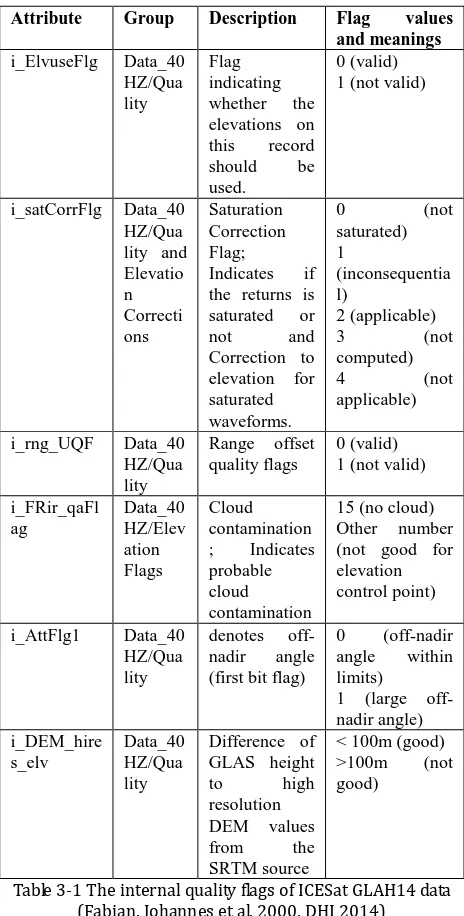
The first step is a thorough pre-processing of the ICESat data. ICESat GLA14 data contain land elevations with respect to the TOPEX/Poseidon-Jason ellipsoid which is about 70 cm smaller than the WGS 84 ellipsoid. As a consequence, comparison of ICESat elevations to those obtained from other sources must take into account the potential effect of ellipsoid differences. The comparison of TanDEM-X i-DEM with ICESat elevations was done using WGS84 as the reference ellipsoid. First, the ICESat footprint elevation was converted to the WGS84 ellipsoid using the empirically derived formula provided by NSIDC. In contrast to many previously reported methods (Bhang, Schwartz et al. 2007), we did not use a fixed height offset between TOPEX/Poseidon and WGS ellipsoids of 0.7m, but calculated the offset by the empirically derived formula provided by NSIDC (Fabian, Johannes et al. 2000). Meanwhile, the coordinate system of TanDEM-X I- DEM is already WGS84-G1150, which assumes that the new WGS84-G1150 ellipsoid and WGS84 ellipsoid are equal. The national Grid Transformation OSTN02 and the national Geoid Model OSGM02 (OSGM02&OSTN02) was utilized to convert the Bluesky DEM from OSGB36 ODN to the WGS84 coordinate indexes where each record index contains 40 laser shots. Some data attributes are stored for the complete record index and others are recorded for each laser shot according to the ICESat data dictionary from National Snow and Ice Data Center (NSIDC) (Fabian, Johannes et al. 2000). Variable names are indicated by unique flags of which the NSIDC provides an altimetry data dictionary with a detailed description (Fabian, Johannes et al. 2000). First, filtering of invalid or critical values was performed using the internal quality flags, shown in Table 3-1 below, as criteria in the ICESat GLAH14 data files. The International Archives of the Photogrammetry, Remote Sensing and Spatial Information Sciences, Volume XLI-B4, 2016
Attribute Group Description Flag values
Table 3-1 The internal quality flags of ICESat GLAH14 data (Fabian, Johannes et al. 2000, DHI 2014)
According to Table 3-1, data with less than ideal characteristics detected during processing resulting in data records (invalid elevations, invalid saturation correction value, invalid Range offset, Cloud contamination, high Difference of GLAS height to high resolution SRTM, laser beams with large off-nadir pointing) was therefore excluded for further interpretation. From Figure 3-1, Figure 3-2 and Figure 3-3, filtered results were obtained, and it is obvious that a single year of ICESat data is insufficient for TanDEM-X i-DEM validation; therefore, we utilised ICESat data from 2004 to 2008. In addition, to obtain refined ICESat elevation without extreme outliers, ICESat locations with elevations deviating more than 60 metres from the Bluesky DEM were excluded using an ICESat and Bluesky DEM difference.
In the third step, the i-DEM values were subtracted from the corresponding ICESat elevations and the ICESat footprint centre coordinates were used to extract TanDEM-X i-DEM and Bluesky elevations. For every ICESat footprint, the corresponding TanDEM-X i-DEM elevation values was computed by using the nearest neighbour sampling method.
Moreover, the Bluesky DEM was introduced to calculate surface slope and aspect within a 3x3 pixel neighbourhood. Slope values have been grouped into 4 classes (0° to 5°, 5° to 10°, 10° to 20°, more than 20º) and aspect has 8 directions and no direction (flat, slope is 0°).
Figure 3-1 All ICESat data footprint in 2006 WGS84 vertical datum, red rectangle
will be used in Figure 3-5
Figure 3-2 ICESat data footprints after filtering large
off-nadir angle data in 2006, based on WGS84 vertical along an ICESat track (red
rectangle in Figure 3-1)
Figure 3-5 Difference of TanDEM-X I- DEM and ICESat data of Figure 3-4
Finally, data comparison and statistical validation of the i-DEM vertical accuracies were calculated according to some standards and statistical methods (Maune 2007). The statistical validation measures are based on the assumption of a normal error distribution with no outliers. Still, outliers and non-normal distributed data occur especially over topographically complex and/or non-open terrain. The approach to deal with outliers is to remove them by applying a threshold. Here, the threshold for eliminating outliers in the TanDEM-X I-DEM validation is
selected as three times the Standard deviation ( ). In cases where outlier removal is not sufficient to achieve normally distributed errors, a nonparametric testing method (LE90: 90% confidence level) can be used. Table 3-2 below summarises the accuracy measures and associated statistics that are used for the reporting of TanDEM-X i-DEM vertical accuracy. Eventually, GIS visualization, GIS spatial statistical analysis and derived topographic statistical parameters and data analysis reports are obtained. The use of ICESat data requires working with The International Archives of the Photogrammetry, Remote Sensing and Spatial Information Sciences, Volume XLI-B4, 2016
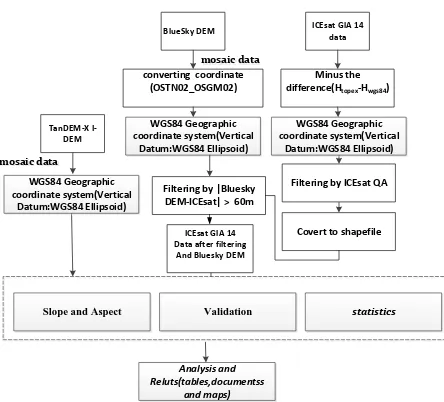
millions of potential reference points (10/2004 – 10/2008) across the whole UK and the TanDEM-X I-DEM statistical validation has therefore been processed automatically following the processing workflow, shown in Figure 3-6 below.
Number of
Threshold for outliers |
Table 3-2 Accuracy parameters for TanDEM-X i-DEM
validation, where is iDEM elevation, is ICESat elevation
Slope and Aspect Validation statistics
WGS84 Geographic coordinate system(Vertical
Datum:WGS84 Ellipsoid)
Figure 3-6 the TanDEM-X i-DEM statistical validation processing workflow using ICESat data
4. RESULTS
4.1 TanDEM-X iDEM accuracy results
The accuracy results (aspect relationship, slope relationship and accuracy) are shown in the Tables below. These Tables summarize the discrepancies between DEMs and ICESat GLAS14 data. In the UK, against ICESat GLAS14 elevation data, TanDEM-X i-DEM has -0.0283±3.654m over England and Wales and 0.3173±5.286m over Scotland for 12m, -0.073±6.574m for 30m, and 0.023±9.25m for 90m. Moreover, 90% of all TanDEM-X i-DEM data (Linear error at 90% confidence level) are below 16.2m.
Statistics Point
Table 4-1 Height Difference statistics over the UK (30m i-DEM-ICESat)
4.2 The accuracy of TanDEM-X i-DEM products
The accuracy of DEM products over the UK is shown in Table 4-2 below. The reference data of absolute vertical accuracy validation is ICESAT GLA14.
DEM
Table 4-2 The accuracy of TanDEM-X iDEM products of
UK (Control point data: ICESAT GLA14)
4.3 Error characterisation using topographic attributes
The effect of topography on the spatial distribution of vertical errors was investigated by analysing elevation residuals to several terrain attributes (Slope, Aspect and elevation). The results of tests confirm lack of significant differences between DEMs and GPS data in UK. Linear regression analysis reveals strong correlation between TanDEM-X i-DEM and ICESAT GLA14 data for 12m, 30m and 90m resolution DEMs data in UK, shown in the plots below. Analysis of variance (ANOVA) tests, performed on the linear regression data, showed this correlation to be highly significant in UK (p<0.0001 in all tests); and the systematic error is very small (according to the constant item in the line equation). It is of interest to note that in both cases the value of the slope of the regression line was very close to 1.
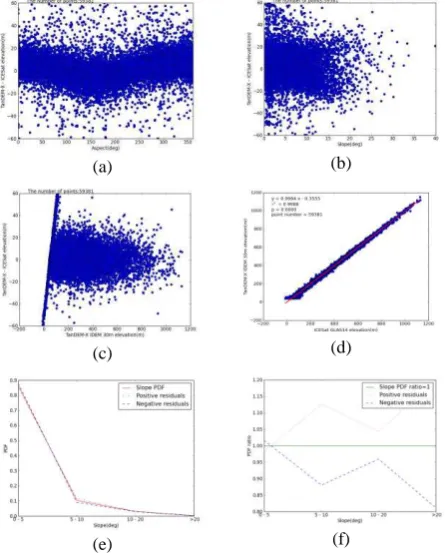
Over the UK, comparisons of the residuals (30m iDEM data) with slope and aspect do not reveal noticeable trends (Figure 4-1 a and b), Big differences occur below elevations of 150m (Figure 4-1 c). Linear regression analysis reveals strong correlation between TanDEM-X iDEM 30m and ICESAT GLA14 in UK (Figure 4-1 d), and the systematic error is very small. The residuals progressively become more positive with increasing slope (Figure 4-1 e and f) and higher slopes positive residuals are much more frequent than negative ones, about double between 12 to 20 degree in UK (Figure 4-1 f). The total probability density is bigger in the East (Figure 4-1 g) and the positive residuals in UK are more frequent on slopes facing north than negative residuals while the trend is inverted on slopes facing south (Figure 4-1 h). In UK, TanDEM-X iDEM 12m and 90m has the same trend as TanDEM-X iDEM 30m.
(a) (b)
(c) (d)
(e) (f)
(g) (h)
Figure 4-1 Elevation residuals between TanDEM-X iDEM and ICESAT GLA14 elevation data in UK(30m iDEM) (a) Aspect; (b) slope; (c) elevation derived from the TanDEM-X iDEM data; (d) Correlation between ICESAT GLA14 and iDEM data;
(e) Probability density functions (PDFs) of slope for positive and negative residuals and of overall Slope; (f) Ratio of the positive and negative residuals PDFs to the slope PDF, note that
slope is in degree; (g) PDFs of aspect measured at locations with positive and negative residuals ; (h) Ratio of the positive
and negative residuals PDFs to overall slope bearing PDF.
5. ANALYSIS AND DISCUSSION
In this experiment, both Standard Deviations and RMSE of DEM Height Difference reflect the accuracy of DEM products. Using ICESat GLA14 data to validate TanDEM-X i-DEM needs to filter the data errors, outliers, cloud contamination and so on first; moreover, the co-ordinate system of these two data should be translated onto the same reference ellipsoid.
Over the UK, the residuals progressively become more positive with increasing slope and higher slopes with positive residuals are much more frequent than negative ones between 5 and 20 degrees. The total probability density is larger in the East and the positive residuals are more frequent on slopes facing north than negative residuals while the trend is inverted on slopes facing south. Higher slopes seem to cause positive errors while big difference occurs below elevations of 150m. This maybe because the penetration ability of i-DEM X band is weaker than ICESat over forested areas (according to canopy density) in mountainous area but stronger in flatter land areas according to soil moisture and land roughness.
From Table 4-2 above, the accuracy of all DEM products decreases typically when the resolution increases. This is because the sampling method, grid resolution or pixel size and interpolation algorithm would influence the DEM accuracy. From Table 4-1 and other resolution results, the accuracy of all DEM products varies a little with different aspects, but it decreases when slope increases, which indicates that slope has a strong effect on the vertical accuracy of the TanDEM-X I-DEMs. In the large slope terrain, large errors and data voids are frequent, and their location is strongly influenced by topography, while in the small slope site, errors are smaller.
From Table 4-2 above, the vertical accuracy of the i-DEM is better in England than Scotland. It is noted that the terrain of Scotland is more complex and higher than the terrain of England and Wales, because the terrain complexity index of Scotland is larger (Zhou, Liu et al. 2006, Lu, Liu et al. 2007). Thus it reflects the fact that the elevation precision is influenced by terrain factors. The elevation precision is smaller in complex terrain areas than plain areas and it decreases when the elevation and slope increases. What’s worse, this might imply that i-DEM processing in complex terrain area may not have a good performance now, which needs to be enhanced.
6. CONCLUSIONS
Through this study, the accuracy of TanDEM-X iDEM in UK is summarized as below: against ICESat GLAS14 elevation data, TanDEM-X iDEM has -0.0283±3.654m in England and Wales and 0.317±5.286m over Scotland for 12m, -0.073±6.575m for 30m in UK, and 0.023±9.25m at 90m in UK. Moreover, 90% of all TanDEM-X iDEM data (Linear error at 90% confidence level) are below 16.2m. This indicates that the Digital Elevation Model (DEM) from TanDEM-X mission (bistatic X-Band interferometric SAR) is better than many other products available now. The results also indicate topographic parameters (slope, aspect and relief) have a strong impact on the vertical accuracy of the TanDEM-X I-DEMs. In the high-relief and large slope terrain, large errors and data voids are frequent, and their location is strongly influenced by topography, while in the low- to medium-relief and low slope site, errors are smaller.
ACKNOWLEDGEMENTS
China Scholarship Council (CSC) and University College London (UCL) jointly sponsored the work. The authors are grateful to the NASA National Snow and Ice Data Centre Distributed Active Archive Centre (NSIDC DAAC) for providing the ICESat data and source code.
REFERENCES
Austin, N., J.-P. Muller, L. Gong and J. Zhang (2013). "A regional investigation of urban land-use change for potential landslide hazard assessment in the Three Gorges Reservoir Area, People's Republic of China: Zigui to Wanzhou." International journal of remote sensing 34(8): 2983-3011.
Berry, P., J. D. Garlick and R. G. Smith (2007). "Near-global validation of the SRTM DEM using satellite radar altimetry." Remote Sensing of Environment.
Bhang, K. J., F. W. Schwartz and A. Braun (2007). "Verification of the vertical error in C-band SRTM DEM using ICESat and Landsat-7, Otter Tail County, MN." Geoscience and Remote Sensing, IEEE Transactions on 45(1): 36-44.
Brown, D. G. and T. J. Bara (1994). RECOGNITION AND REDUCTION OF SYSTEMATIC-ERROR IN ELEVATION AND DERIVATIVE SURFACES FROM 7-1/2-MINUTE DEMS.
Carabajal, C. (2011). "ASTER global DEM version 2.0 evaluation using ICESat geodetic ground control." Report to the ASTER GDEM Version 2.
Carabajal, C. C. and D. J. Harding (2005). "ICESat validation of SRTM C‐ band digital elevation models." Geophysical research letters 32(22).
Caruso, V. (1987). Standards for digital elevation models.
Danielson, J. J. and D. B. Gesch (2011). Global multi-resolution terrain elevation data 2010.
DHI, G. (2014). EU-DEM statistical validation. EEA, DHI, DHI GRAS • c/o Geocenter Denmark: 27.
Eckert, S., T. Kellenberger and K. Itten (2005). "Accuracy assessment of automatically derived digital elevation models from ASTER data in mountainous terrain." International Journal of Remote Sensing 26(9): 1943-1957.
Enßle, F., J. Heinzel and B. Koch (2014). "Accuracy of vegetation height and terrain elevation derived from ICESat/GLAS in forested areas." Journal of Applied Earth Observation.
Fabian, E., H. Johannes and K. Barbara (2000). "EVALUATING HEIGHT DIFFERENCES BETWEEN GLOBAL DIGITAL SURFACE MODELS AND ICESAT HEIGHTS AT FOOTPRINT GEOLOCATION."
Farr, T. G., P. A. Rosen, E. Caro, R. Crippen, R. Duren, S. Hensley, M. Kobrick, M. Paller, E. Rodriguez, L. Roth, D. Seal, S. Shaffer, J. Shimada, J. Umland, M. Werner, M. Oskin, D. Burbank and D. Alsdorf (2007). "The Shuttle Radar Topography Mission." Reviews of Geophysics 45(2): RG2004.
Fujisada, H., M. Urai and A. Iwasaki (2012). "Technical methodology for ASTER global DEM." Geoscience and Remote Sensing.
Gesch, D. B. (1994). "Topographic data requirements for EOS global change research." Work.
Goncalves, J. A. and A. M. Oliveira (2004). "Accuracy analysis of DEMs derived from ASTER imagery." International Archives of Photogrammetry.
Gutiérrez, A. G. and S. Schnabel (2011). "Testing the quality of open-access DEMs and their derived attributes in Spain: SRTM, GDEM and PNOA DEM."
Hofton, M., R. Dubayah, J. B. Blair and D. Rabine (2006). "Validation of SRTM elevations over vegetated and non-vegetated terrain using medium footprint lidar." Photogrammetric Engineering & Remote Sensing 72(3): 279-285.
Li, P., Z. Li, J.-P. Muller, C. Shi and J. Liu (2015). "A new quality validation of global digital elevation models freely available in China." Survey Review: 1752270615Y. 0000000039.
Li, P., C. Shi, Z. Li, J.-P. Muller, J. Drummond, X. Li, T. Li, Y. Li and J. Liu (2013). "Evaluation of ASTER GDEM using GPS benchmarks and SRTM in China." International Journal of Remote Sensing 34(5): 1744-1771.
Lu, H., X. Liu and L. Bian (2007). Terrain complexity: definition, index, and DEM resolution. Geoinformatics 2007, International Society for Optics and Photonics.
Maune, D. F. (2007). Digital elevation model technologies and applications: the DEM users manual.
Moreira, A., G. Krieger, I. Hajnsek, D. Hounam, M. Werner, S. Riegger and E. Settelmeyer (2004). TanDEM-X: a TerraSAR-X add-on satellite for single-pass SAR interferometry. Geoscience and Remote Sensing Symposium, 2004. IGARSS'04. Proceedings. 2004 IEEE International, IEEE.
Pike, R. J. (2002). "A bibliography of terrain modeling (geomorphometry), the quantitative representation of topography." USGS Open file report.
Reuter, H., A. Nelson, P. Strobl and W. Mehl (2009). "A first assessment of Aster GDEM tiles for absolute accuracy, relative accuracy and terrain parameters." Geoscience and Remote Sensing.
Rodriguez, E., C. S. Morris and J. E. Belz (2006). "A global assessment of the SRTM performance." Photogrammetric Engineering & Remote Sensing 72(3): 249-260.
Rodriguez, E., C. S. Morris, J. E. Belz and E. C. Chapin (2005). An assessment of the SRTM topographic products.
Schutz, B., H. Zwally, C. Shuman, D. Hancock and J. DiMarzio (2005). "Overview of the ICESat mission." Geophysical Research Letters 32(21).
Tachikawa, T., M. Kaku, A. Iwasaki, D. Gesch and M. Oimoen (2011). ASTER Global Digital Elevation Model Version 2– Summary of Validation Results.
Team, A. V. (2009). ASTER global DEM validation summary report.
Wang, X., X. Cheng, P. Gong, H. Huang, Z. Li and X. Li (2011). "Earth science applications of ICESat/GLAS: a review." International Journal of Remote Sensing 32(23): 8837-8864.
Wechsler, S. P. (1999). "Digital Elevation Model (DEM) uncertainty: evaluation and effect on topographic parameters." ESRI User Conference.
Wechsler, S. P. (2007). "Uncertainties associated with digital elevation models for hydrologic applications: a review." Hydrology and Earth System Sciences 11(4): 1481-1500.
Zhao, S., W. Cheng, C. Zhou, X. Chen, S. Zhang, Z. Zhou, H. Liu and H. Chai (2011). "Accuracy assessment of the ASTER GDEM and SRTM3 DEM: an example in the Loess Plateau and North China Plain of China." International Journal of Remote Sensing 32(23): 8081-8093.
Zhou, Q., X. Liu and Y. Sun (2006). "Terrain complexity and uncertainties in grid‐ based digital terrain analysis." International Journal of Geographical Information Science 20(10): 1137-1147.
Zink, M., G. Krieger, H. Fiedler, I. Hajnsek and A. Moreira (2008). The TanDEM-X mission concept. Synthetic Aperture Radar (EUSAR), 2008 7th European Conference on, VDE.
Zwally, H., B. Schutz, W. Abdalati, J. Abshire, C. Bentley, A. Brenner, J. Bufton, J. Dezio, D. Hancock and D. Harding (2002). "ICESat's laser measurements of polar ice, atmosphere, ocean, and land." Journal of Geodynamics 34(3): 405-445.