Antipsychotic Treatment Induces Alterations in
Dendrite- and Spine-Associated Proteins in
Dopamine-Rich Areas of the Primate Cerebral Cortex
Michael S. Lidow, Zan-Min Song, Stacy A. Castner, Patrick B. Allen,
Paul Greengard, and Patricia S. Goldman-Rakic
Background:
Mounting evidence indicates that long-term
treatment with antipsychotic medications can alter the
morphology and connectivity of cellular processes in the
cerebral cortex. The cytoskeleton plays an essential role in
the maintenance of cellular morphology and is subject to
regulation by intracellular pathways associated with
neu-rotransmitter receptors targeted by antipsychotic drugs.
Methods:
We have examined whether chronic treatment
with the antipsychotic drug haloperidol interferes with
phosphorylation state and tissue levels of a major
den-dritic cytoskeleton–stabilizing agent,
microtubule-associ-ated protein 2 (MAP2), as well as levels of the dendritic
spine–associated protein spinophilin and the synaptic
vesicle–associated protein synaptophysin in various
re-gions of the cerebral cortex of rhesus monkeys.
Results:
Among the cortical areas examined, the
prefron-tal, orbiprefron-tal, cingulate, motor, and entorhinal cortices
displayed significant decreases in levels of spinophilin,
and with the exception of the motor cortex, each of these
regions also exhibited increases in the phosphorylation of
MAP2. No changes were observed in either spinophilin
levels or MAP2 phosphorylation in the primary visual
cortex. Also, no statistically significant changes were
found in tissue levels of MAP2 or synaptophysin in any of
the cortical regions examined.
Conclusions:
Our findings demonstrate that long-term
haloperidol exposure alters neuronal cytoskeleton– and
spine–associated proteins, particularly in dopamine-rich
regions of the primate cerebral cortex, many of which
have been implicated in the psychopathology of
schizo-phrenia. The ability of haloperidol to regulate cytoskeletal
proteins should be considered in evaluating the
mecha-nisms of both its palliative actions and its side effects.
Biol Psychiatry 2001;49:1–12 ©
2001 Society of
Biolog-ical Psychiatry
Key Words:
Antipsychotic drugs, dendrite, spine,
syn-apse, microtubule-associated protein 2, spinophilin,
synaptophysin
Introduction
S
ince the introduction of antipsychotic medications
nearly 40 years ago, the main emphasis of studies on
the effects of these drugs in brain tissue has been on
alterations in neurotransmitters and their receptors (for a
review, see Csernansky 1996). There is, however,
mount-ing evidence that antipsychotics may produce
morpholog-ical changes in cellular elements in several regions of the
brain, particularly in the association areas of the cerebral
cortex (Benes et al 1985; Klinzova et al 1989, 1990;
Meshul et al 1992; Uranova et al 1991; Vincent et al 1991,
1994). It has even been suggested that these
slow-devel-oping morphological changes might explain why the
pharmacologic treatment of psychosis typically requires
several weeks to attain its full effect and why it may take
months to reverse this effect after cessation of treatment
(Benes et al 1985). It has also been proposed that the
antipsychotic-induced morphological alterations may
un-derlie the side effects produced by these drugs (Kelley et
al 1997; Seeman 1988). Interest in the effects of
antipsy-chotic medications on the morphology of cortical cells is
further reinforced by the discovery of alterations in the
volume and organization of the neuropil in postmortem
cortical tissue from schizophrenic patients (Anders 1978;
Garey et al 1998; Glantz and Lewis 1997; Selemon et al
1996; Uranova et al 1996), raising the question as to
whether these changes are associated with the disease
itself or its treatment.
The ability of antipsychotic drugs to affect cell
mor-phology can be predicted from their binding to
dopami-nergic and other neurotransmitter receptors (Seeman
1990), which are coupled to second messengers that
regulate the activity of kinases and phosphatases
(Keba-bian and Greengard 1971; Roth et al 1998; Walsh et al
1972; Yurko-Mauro and Friedman 1995). These enzymes
control the phosphorylation states of such proteins as
From the Department of Oral and Craniofacial Biological Sciences, University ofMaryland, Baltimore (MSL, Z-MS), Section of Neurobiology, Yale University School of Medicine, New Haven, Connecticut (SAC, PSG-R), and Laboratory of Molecular and Cellular Neuroscience, The Rockefeller University, New York, New York (PBA, PG).
Address reprint requests to Michael S. Lidow, Ph.D., University of Maryland, Baltimore, OCBS Department, Room 5-A-12, HHH, 666 W. Baltimore Street, Baltimore MD 21201.
Received June 15, 2000; revised August 25, 2000; accepted August 28, 2000.
© 2001 Society of Biological Psychiatry 0006-3223/01/$20.00
microtubule-associated protein 2 (MAP2; Goldenring et al
1985; Sloboda et al 1975; Tsuyama et al 1986; Walaas and
Nairn 1989). MAP2 contains multiple phosphorylatable
residues, and the levels of phosphorylation of this protein
are inversely proportional to its ability to stabilize
den-dritic microtubules (Cleveland and Hoffman 1991;
Mac-cioni and Cambiazo 1995; Tsuyama et al 1986, 1987;
Wiche et al 1991). As microtubules are among the major
cytoskeletal constituents involved in the maintenance of
dendritic processes (Cleveland and Hoffman 1991; Keith
1990; Shea and Beermann 1994; Yamada et al 1970), any
changes in their stability could affect major cellular
compartments of neurons—their dendrites, spines, and
synapses. Despite the obvious importance of
understand-ing the effects of antipsychotic drugs on the cytoskeleton
of cortical cells, their effects on the phosphorylation of
MAP2 and other cytoskeletal proteins in the cortex are not
known.
During the past several years our laboratories have been
involved in an analysis of the effects of chronic
antipsy-chotic treatment on the integrity of the primate cortex. We
have previously reported a significant upregulation of D
2receptors and downregulation of D
1receptors in the
prefrontal and temporal cortical regions of the rhesus
monkey brain following chronic treatment with several
typical and atypical antipsychotic drugs (Lidow et al 1997;
Lidow and Goldman-Rakic 1994). The cortex of these
monkeys also exhibits increased glial density (Selemon et
al 1999), although this increase was not induced by all of
the antipsychotic drugs examined. In particular,
haloperi-dol was not among the drugs that induced significant
gliosis.
This study extends our investigations to the influence of
chronic treatment with antipsychotic drugs—in this
in-stance, haloperidol— on tissue levels and degree of
phos-phorylation of the dendritic cytoskeleton–stabilizing
pro-tein MAP2 in multiple regions of the monkey cerebral
cortex. In addition, we examined the impact of this
treatment on cortical levels of spinophilin, the dendritic
spine–affiliated protein that has been implicated in linking
plasma membrane–associated synaptic components, such
as dopamine D
1and D
2receptors, to the actin cytoskeleton
(Allen et al 1997; Smith et al 1999; Yan et al 1999). We
also evaluated cortical levels of synaptophysin, a synaptic
marker commonly associated with synaptic vesicles
(East-wood et al 1995; Masliah et al 1990) presumed to act as an
exocytotic fusion pore (Bajjalieh and Scheller 1995;
Edel-mann et al 1995). Effects of haloperidol treatment on
spinophilin and synaptophysin were examined because
alterations in the density of spines and synapses containing
these proteins have previously been noted in the cortex of
haloperidol-exposed animals (Benes et al 1985; Klinzova
et al 1989, 1990; Meshul et al 1992; Vincent et al 1991).
In this investigation we studied monkeys that were 15
years of age or older to model the effects of drug treatment
on brain cells in a population of older patients. A parallel
study is currently in progress on a younger cohort of
monkeys. We report the findings on the older animals now
because of the insight they provide for neural
vulnerabil-ities in aged individuals as well as for possible
implica-tions for chronic medication in clinical practice.
Methods and Materials
Animals
This study included four haloperidol-treated and four drug-naive control female rhesus monkeys (Macaca mulatta). The monkeys in the drug-exposed group were 15, 19, 19, and 20 years of age, whereas the animals in the control group were 15, 16, 19, and 25 years of age. The animals were kept in individual cages in accordance with Yale Animal Use and Care Committee guide-lines for nonhuman primates. All monkeys were fed High Protein Monkey Chow (Ralston Purina, Saint Louis), were given fruit twice a day, and had fresh water available ad libitum. The animals were also provided with standard enrichment devices: logs, dog toys, plastic chains, and mirrors.
Drug Treatment and Tissue Collection
Haloperidol (in powder form) was obtained from RBI (Natick, MA). For administration, a stock solution of haloperidol:sucrose (1:50) was prepared, from which daily doses were portioned out and given to animals within fruit treats such as pieces of banana, prune, apple, or marshmallow. The animals received the drug twice a day for a period of 1 year. During the first month of treatment the daily dose was 0.07 mg/kg. During the second month it was increased to 0.14 mg/kg. After that, the daily dose was increased to 0.20 and 0.27 and finally to 0.35 mg/kg at 2-week intervals. The latter dose was maintained throughout the rest of the treatment period. For one monkey, the final daily dose was 0.42 mg/kg, which was dictated by requirements of testing for cognitive impairments, also conducted in these animals. The final doses of haloperidol employed in this study fall within the therapeutic range given to psychiatric patients during mainte-nance treatment (Physicians’ Desk Reference 1999). The control animals received fruit treats only. During the entire period of treatment the animals displayed no signs of extrapyramidal side effects.
Between 12 and 18 hours after the last treatment, the animals were anesthetized with sodium pentobarbital. Their brains were rapidly removed, dissected, and immersed in liquid nitrogen for storage.
animals at the time of perfusion. Also, since the estrous cycles in rhesus monkeys display seasonal variations (Hutz et al 1985; Walker et al 1983), all the animals were perfused in the period from November through February, which is within the breeding season for these species.
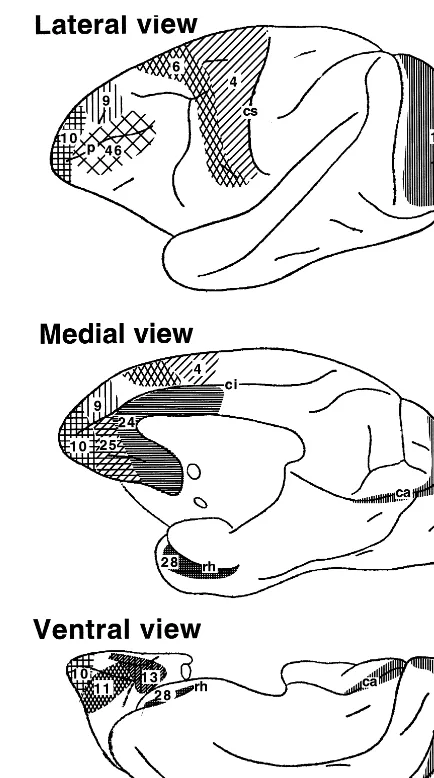
Samples from the following cortical areas were analyzed: frontal pole (cortical area 10; Walker 1940), dorsolateral pre-frontal cortex (area 46; Walker 1940), dorsomedial prepre-frontal cortex (area 9; Walker 1940), anterior orbital cortex (area 11; Walker 1940), posterior orbital cortex (area 13; Walker 1940), anterior cingulate cortex (area 24; Walker 1940), prelimbic cortex (area 25; Walker 1940), premotor cortex (lateral portion of area 6; Brodmann 1994), primary motor cortex (area 4; Brod-mann 1994), primary visual cortex (area 17; BrodBrod-mann 1994), and entorhinal cortex (area 28; Brodmann 1994). The cortical regions examined are shown in Figure 1. Samples of all brain regions were collected from both hemispheres, but those from each hemisphere were processed separately.
Tissue Levels of MAP2, Spinophilin, and
Synaptophysin
TISSUE HOMOGENATES. Tissue samples were
homoge-nized for 3 min on a TriR Homogenizer (Cole-Palmer, Vernon Hill, IL) in 100 volumes of ice-cold TBS buffer (0.5 mol/L Tris base [pH 8.0] containing 0.1 mol/L NaCl and 0.8 mmol/L phenymethylsulfonyl fluoride).
SLOT BLOTS FOR PROTEIN ANALYSIS. Comparative lev-els of specific proteins in the sample homogenates were exam-ined using slot blots on NitroPure membranes (Osmonics, Westbrough, MA) prepared with Bio-Dot SF Microfiltration Apparatus (Bio-Rad, Hercules, CA). Before the blotting, each tissue homogenate was diluted 1:100 with the TBS buffer, and 200mL of the resultant solution were used per blot.
For immunolabeling, membranes were preincubated for 1 hour at room temperature in blocking solution containing 5% dry milk and 0.2% Tween, in PBS buffer (137 mmol/L NaCl, 2.7 mmol/L KCl, 4.3 mmol/L Na2HPO4, and 1.4 mmol/L KH2PO4; pH 7.3).
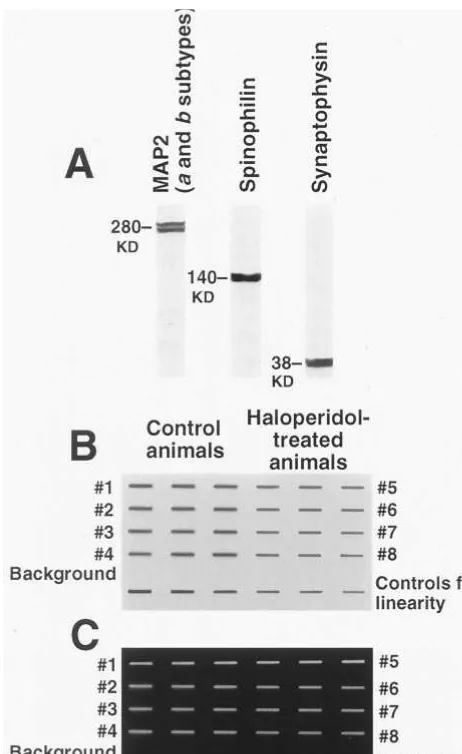
Incubation with protein-specific antibodies diluted in the same buffer was conducted overnight at 4°C. The dilution of MAP2 and spinophilin antibodies was 1:2500; for synaptophysin anti-bodies, the dilution was 1:1000. After incubation, the membranes were washed 235 min in PBS buffer and exposed for 1.5 hours to the secondary peroxidase-conjugated antibodies diluted 1:62500 in the blocking solution described above. Visualization of labeling was conducted with the Super Signal Chemilumines-cence Substrate (Pierce, Rockford, IL). The images were pro-duced by opposing transparent plastic-wrapped chemilumines-cence-soaked membranes to an X-Omat AR Film (Kodak, Rochester, NY) for a period of 2–25 min. For analysis with Universal Software (Advanced American Biotechnology, Fuller-ton, CA), the film images of slot blots were digitized on a UC 1260 flat bed scanner (U-Max, Hsinchy, Taiwan). For examina-tion of the levels of each specific protein, the tissue samples from the same brain region of the same hemisphere of all eight animals used in this study were always processed simultaneously on a single membrane and blots for every sample were done in
controls for linearity, represented by six blots generated by a serial dilution of monkey brain prepared for this purpose (Figure 2B). The film images of the sample blots from a membrane were accepted for analysis only if all of them had gray value within the range of those produced by the controls for linearity and if the relationship between the gray values of the images of the
linearity control blots and the tissue dilution in these blots was in the linear range. In addition, every membrane included a line of six blots produced by bovine serum albumin (BSA), prepared as the tissue samples, to check the level of background immunola-beling. The BSA blots produced no detectable images on any of the films examined in this study (Figure 2B).
ANTIBODIES. Specific proteins were labeled with the
fol-lowing antibodies: monoclonal antibodies to the high–molecular weight a and b isoforms of MAP2 (Sigma, Saint Louis), the rabbit polyclonal antibodies RU 144 to spinophilin (Allen et al 1997), and the mouse monoclonal antibodies EP10 to synapto-physin (StressGen Biotechnology, Victoria, Canada). The sec-ondary goat antimouse and goat–antirabbit peroxidase– conju-gated antibodies were purchased from Jackson Immunoresearch (West Grove, PA). The specificity of the primary antibodies was tested on Western blots of monkey cortical and striatal tissues. The homogenates were mixed 5:1, with the loading buffer containing1.0 mol/L Tris-HCl (pH 6.8), 20% sodium dodecyl sulfate (SDS), 50% glycerol, 0.2% Bromophenol blue, and 4.9% DTT. Thirty microliters of this mixture were loaded per well in Ready-made 4 –15% Gradient SDS Gels (Bio-Rad). The gels were run for 1.5 hours at 100 V using a Bio-Rad Ready Gel Cell with Bio-Rad Tris/Glycine/SDS Running Buffer. The transfer on a PVDF-Plus membrane (Osmonics) was performed at 100 A, overnight at 4°C also using a Bio-Rad Ready Gel Cell with Bio-Rad Tris/Glycine Buffer. Immunolabeling of the membranes was performed as described above for the slot blots. The specificity of all the antibodies used in this test was demonstrated by the observation that they produced labeling only in bands with molecular weight in the appropriate range (Figure 2A): MAP2; 280 kd (two bands of close molecular weight that representeda
andbisoforms of this protein were visualized; Johnson and Jope 1992), spinophilin;140kD (Allen et al 1997), and synaptophy-sin;38 kD (Honer et al 1992).
SLOT BLOTS FOR ANALYSIS OF THE DNA LEVELS. The
slot blots were used for measurement of the comparative levels of DNA in the sample homogenates. Similar to the blots for the protein analysis, the blots for analysis of DNA were prepared using a Bio-Dot SF Microfiltration Apparatus (Bio-Rad, Her-cules, CA). However, here it was loaded with the Hybond-N Nylon membrane (Amersham, Piscataway, NJ). Also, before blotting, the tissue homogenates were diluted 1:20 in 90 mmol/L citrate buffer (pH 7.0) containing 0.9 mol/L NaCl, 3.0 mmol/L EDTA, and 40mg/mL RNase A. For visualization of the DNA, the dried membranes were soaked for 15 min in SYBR DX DNA-specific Blot Stain (Molecular Probe, Eugene, OR) mixed 1:1000 with 89 mmol/L Tris-H3BO3buffer (pH 8.0) containing
10 mmol/L EDTA. The staining was observed with the UV Photo Viewer Illumination System (Ultra-Lum, Paramount, CA) at the wavelength of 454 nm. The system also digitized the images for densitometric analysis with Universal Software. A typical exam-ple of the digitized image of a membrane stained for DNA is presented in Figure 2C. As in the case of the blots for the protein analysis, samples from the same region of the same hemisphere were processed simultaneously for all eight animals, with blots for every sample done in triplicate. The controls for linearity Figure 2. Representative examples of the images of the Western
consisted of slot blots of six serial dilutions of herring sperm DNA (Figure 2C). The background staining on each membrane was checked with six blots of BSA prepared in a manner identical to that of the experimental samples (Figure 2C). On all membranes used for densitometric analysis, the BSA blots generated no staining.
DETERMINATION OF PROPORTION OF NEURONS IN THE TISSUE. Since the overwhelming majority of cells in the brain
are not in a process mitosis and have a single complement of identical DNA, it is reasonable to expect that the proportion of the neuronal DNA in a blot would be very close to the proportion of the neuronal cells in the tissue sample. Therefore, it was of interest to determine the proportions of the neuronal DNA in the samples collected for this study. For this purpose, three randomly cut slabs from each tissue sample were processed for direct three-dimensional counting of cell nuclei. The counting was performed as outlined in Selemon et al (1996, 1999) using a Macintosh-based computer system described in Williams and Rakic (1988b). For counting, the slabs were sliced into 80-mm sections on an HM 500 OM cryostat (Zeiss, Walldorf, Germany), and the sections were stained with cresyl violet. The counting was conducted on one section per slab. For each section, the counting was performed in two nonoverlapping randomly se-lected counting boxes (55mm wide325mm deep) stretching across the brain structure. Therefore, we examined six counting boxes for every tissue sample (two boxes 3 three separate sections). Neuronal nuclei were identified based on the criteria of Williams and Rakic (1988a). The proportions of neuronal nuclei among all the nuclei were calculated for every counting box. These data were then used for calculation of the mean propor-tions6SEMs of neuronal nuclei for every brain region of each animal.
MEASUREMENT OF TOTAL PROTEIN. The measurement of total protein in the sample tissue homogenates was performed with a Modified Lowry Protein Assay Kit (Pierce) on a Hitachi U110 spectrophotometer (Hitachi USA, San Jose, CA).
EXPRESSION OF THE DATA AND STATISTICAL ANALY-SIS. MAP2 and spinophilin are produced by cortical neurons, and synaptophysin, although situated presynaptically, still repre-sents the synapses on cortical cells. Therefore, we wanted to evaluate the effects of the drug treatment on the levels of MAP2, spinophilin, and synaptophysin per neuron in every brain region examined. Since it is not possible to determine precisely the number of cells in the tissue samples used for blots, the closest representation of the quantity of a specific protein per neuron is to divide the amount of this protein by the DNA amount in the same sample and multiply by the proportion of neuronal cells in the sample tissue. In practice, the mean gray values of the images generated by the protein-specific immunostaining of the blots from each sample were divided by the mean gray value of the images generated by the DNA staining of the blots from this sample and multiplied by the mean proportion of the neurons in the counting boxes in the sections also obtained from the same sample. In addition, we expressed the levels of all specific
proteins examined (gray value of blot labeling) per unit of total protein in the sample.
While 22 cortical areas (11 areas per hemisphere) were examined in this study, the goal of the experiments did not include any comparison of protein levels between these areas. The basic analysis of the data, therefore, was a two-tailedttest comparing the levels of each protein in individual cortical area between control and treated animals. Given that four different proteins were measured in each cortical area, however, we adopted a conservative approach by applying a Bonferroni correction to thepvalues calculated from thettests. Hence, the
pvalue used in determining the statistical significance of each analysis was equal to the p value calculated from the t test divided by 4, which is the number of proteins analyzed in each cortical area.
Analysis of Phosphorylation of MAP2
PROCESSING OF THE TISSUE. The analysis of the effect of
(San Francisco). The antibodies for immunolabeling of MAP2 were the same as those used for immunoprecipitation (dilution 1:2500). In this case, the secondary antibodies visualized both the immunolabeling and immunoprecipitating antibodies. How-ever, the immunolabeling of MAP2 can be easily distinguished because the molecular weights ofaandbisoforms of MAP2 are in the range of 280 kd, whereas the molecular weights of the heavy and light chains of the immunoprecipitating antibodies are 50 kd and 25 kd, respectively (Alberts et al 1995). Rabbit polyclonal antibodies for phosphoserine, phosphothreonine, and phosphotyrosine were purchased from Zymed Laboratories and used at a dilution 1:500. The peroxidase-conjugated secondary antibodies were the same as those used in the immunolabeling of the slot blots. Their dilution was 1:62500. A typical example of the digitized film images of the immunoblots generated in this part of the study is presented in Figure 3. All Western blots were generated in six replicates. Also, each membrane processed for immunolabeling contained controls for linearity that, as de-scribed earlier for the slot blots, were used to ensure that the gray values obtained in the film images were in the linear range. The controls for linearity were made of six serial dilutions of the monkey brain tissue collected and stored for this purpose. The controls for linearity were placed manually, as 2-mL dot blots, on the edge of the membrane immediately upon its removal from the transfer apparatus, before the drying step (Figure 3).
EXPRESSION OF THE DATA AND STATISTICAL ANALY-SIS. The residue-specific phosphorylation in every blot of a
given sample was expressed as the ratio of the gray value of the film images produced by the phosphoaminoacid immunolabeling and the gray value of the images produced by the immunolabel-ing of the immunoprecipitated protein of this blot. For every set of blots on a single membrane, the ratios obtained were then normalized to the ratio generated by the sample from the 15-year-old control animal. Since every assay was performed in six replicates (on six separate membranes), the normalized ratios from the matching samples in all six replicates (membranes) were averaged for statistical analysis. The data obtained in this way were appropriate only for comparison of the levels of residue-specific MAP2 phosphorylation in the same region of the same hemisphere of control and experimental animals. The statistic employed for this purpose was a two-tailed ttest. In assessing statistical significance, we used the Bonferroni correc-tion with pvalue divided by 3, the number of specific assays performed in each brain area.
Results
Proportion of Neuronal Cells in Multiple Cortical
Regions
Our calculations of the proportions of neuronal nuclei
among the cell nuclei in the samples from all the cortical
regions examined in this study showed that neurons
constitute approximately half of the cells in these regions
(Table 1). There were no statistical differences between
the proportions of neuronal nuclei in the
haloperidol-treated and control animals in any of the cortical regions in
either hemisphere (Table 1).
Levels of Spinophilin, MAP2, and Synaptophysin
Comparative analysis of spinophilin levels in the
haloperidol-treated and control animals showed that the drug induced a
statistically significant downregulation of this protein in all of
the frontal and temporal cortical areas examined in both
hemispheres (Figure 4). These areas included the cortex of
the frontal pole, dorsolateral and dorsomedial prefrontal
cortices, anterior and posterior orbital cortices, anterior
cin-gulate and prelimbic cortices, premotor and primary motor
cortices, and entorhinal cortex. Among the cortical areas
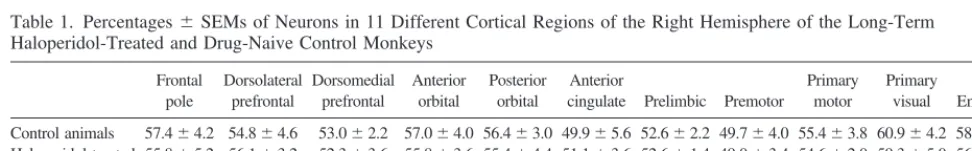
Table 1. Percentages6SEMs of Neurons in 11 Different Cortical Regions of the Right Hemisphere of the Long-Term Haloperidol-Treated and Drug-Naive Control Monkeys
Frontal pole
Dorsolateral prefrontal
Dorsomedial prefrontal
Anterior orbital
Posterior orbital
Anterior
cingulate Prelimbic Premotor
Primary motor
Primary
visual Entorhinal
Control animals 57.464.2 54.864.6 53.062.2 57.064.0 56.463.0 49.965.6 52.662.2 49.764.0 55.463.8 60.964.2 58.364.6 Haloperidol-treated
animals
55.865.2 56.163.2 52.363.6 55.863.6 55.464.4 51.163.6 52.661.4 49.063.4 54.662.0 59.365.0 56.966.0
ttest p..05 p..05 p..05 p..05 p..05 p..05 p..05 p..05 p..05 p..05 p..05 Figure 3. Film images of Western blots of a set of MAP2
analyzed in this study, only the primary visual cortex did not
display a statistically significant decline in this protein
(Fig-ure 4). The same results were obtained whether the levels of
spinophilin were expressed per neuronal DNA or per total
protein (Figure 4).
We also found that the haloperidol-treated monkeys had
elevated levels of MAP2 in all cortical regions examined
in both hemispheres, whether the levels of this protein
were calculated per neuronal DNA or per total protein of
the sample (Figure 4). However, this upregulation did not
reach statistical significance in any region (Figure 4).
We detected no statistically significant differences in
the levels of synaptophysin between the drug-treated and
control animals in any cortical region examined (Figure 4).
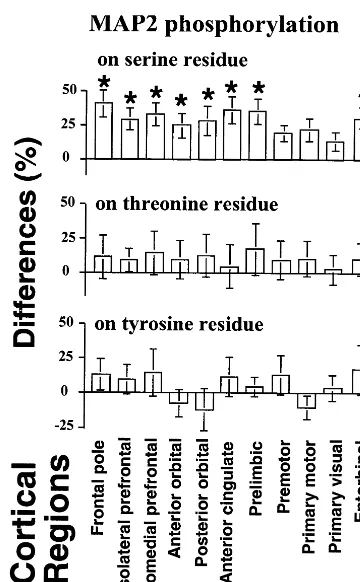
Phosphorylation of MAP2
The analysis of MAP2 phosphorylation in the
haloperidol-treated and control animals revealed a statistically
signif-icant drug-induced increase in the levels of
phosphoryla-tion of this protein on the serine residue in the cortex of the
frontal pole, dorsolateral and dorsomedial prefrontal
cor-tices, anterior and posterior orbital corcor-tices, anterior
cin-gulate and prelimbic cortices, and entorhinal cortex
(Fig-ure 5). Increases in MAP2 serine phosphorylation were
also observed in the premotor, primary motor, and primary
visual cortical areas, but these increases did not reach
statistical significance (Figure 5). Increases in the levels of
MAP2 phosphorylation were also observed on the
threo-nine residue in all brain regions, but these increases were
also not statistically significant (Figure 5). No significant
effects on the tyrosine residue phosphorylation of MAP2
were found in the haloperidol-treated animals (Figure 5).
Discussion
Selective Regional Vulnerability of MAP2 and
Spinophilin to Chronic Haloperidol Treatment
This study demonstrates that chronic haloperidol treatment
significantly increases MAP2 phosphorylation on the
serine residue and significantly downregulates spinophilin
in specific regions of the primate cerebral cortex.
Further-more, the haloperidol-induced downregulation of
spi-nophilin is detectable independent of whether the levels of
this protein are expressed per neuronal DNA or per total
protein in the tissue. This indicates that haloperidol
treat-ment selectively affected spinophilin levels, without
inter-fering with the proportion of neurons in the cortex, as
demonstrated by the cell counts conducted in this study,
and without altering the total protein content of the cortical
cells. The protein specificity of the detected effects is also
emphasized by the absence of statistically significant
changes in the levels of MAP2 and synaptophysin in the
haloperidol-treated animals.
A central observation of this study is that the effects of
haloperidol were detectable in such cortical areas as the
frontal pole; the prefrontal, anterior cingulate, prelimbic,
and entorhinal regions; and the motor and premotor
cortices, all of which are known to contain extensive
dopaminergic innervation (Berger et al 1988;
Nieuwen-huys 1985; Williams and Goldman-Rakic 1993). These
areas, except the motor cortex, also contain the highest
densities of D
2receptors in the monkey cerebral cortex
(Lidow et al 1998). Conversely, we detected no significant
haloperidol-induced alterations in the aforementioned
pro-teins in the visual cortex, which has a barely detectable
dopamine innervation and is D
2receptor poor (Berger et al
1988; Lidow et al 1989). Interestingly, in the motor cortex,
which is richly innervated by dopamine fibers (Berger et al
1988; Williams and Goldman-Rakic 1993) but relatively
poor in D
2receptors (Lidow et al 1998), haloperidol
interfered significantly only with spinophilin levels
with-out affecting MAP2 phosphorylation. This suggests that
the cortical dopaminergic system plays an important role
in haloperidol’s ability to affect both the level of
spinophi-lin and phosphorylation of MAP2 and that D
2receptors
may be particularly involved in regulation of the
phos-phorylation of the latter protein.
Also of interest is that the cortical regions in which
haloperidol treatment affected MAP2 and spinophilin have
all been implicated in the psychopathology of
schizophre-nia (Goldman-Rakic 1999a; Harrison 1999; Weinberger et
al 1994). These regions have also been suggested as
possible sites for the palliative action of antipsychotic
medications (Lidow and Goldman-Rakic 1997; Lidow et
al 1998). It is possible, therefore, that haloperidol-induced
changes in MAP2 phosphorylation and spinophilin levels
may underlie, at least in part, the ability of antipsychotic
medications to improve the quality of life of schizophrenic
patients. It is important to remember, however, that the
results of this study pertain to older (15–25 years of age)
monkeys, and that some of the drug-induced alterations
could be products of an interaction of the treatment with
an aged brain.
The Molecular Biological Findings of This Study
Reflect Morphological Changes in the Cortices of
the Haloperidol-Treated Animals
The molecular biological data collected in this study
correspond well with morphological findings from several
previous studies on the effects of chronic haloperidol
treatment. As mentioned earlier, the degree of MAP2
phosphorylation is inversely proportional to its ability to
stabilize dendritic microtubules, which are essential for the
maintenance of these neuronal processes. Therefore, it is
reasonable to expect that increased MAP2
phosphoryla-tion, which we observed in several cortical regions of
haloperidol-treated animals, would result in some measure
of dendritic collapse in these regions. Indeed, Benes and
her colleagues (Benes et al 1985; Vincent et al 1991)
reported a significant decrease in the number of
small-caliber dendritic processes in the prefrontal cortex of
haloperidol-exposed rats. Furthermore, an electron
micro-scopic analysis (Benes et al 1985) revealed that most of
these processes were dendritic spines, whose necks have a
cytoskeletal structure identical to that of the dendritic shaft
proper (Bloom and Fawcett 1975). These findings are also
compatible with the decrease in levels of the
spine-associated protein spinophilin, which we observed in the
frontal lobe of the drug-treated animals. Additionally, a
decline in the volume of cortical neuropil (which is
composed largely of dendritic processes), together with a
reduced number of microtubules within dendritic shafts
and a lower density of dendritic spines, has been found in
postmortem studies of the frontal cortex of schizophrenic
patients (Garey et al 1998; Glantz and Lewis 1997;
Selemon et al 1996; Uranova 1988). Our data, along with
those of Benes and her colleagues (Benes et al 1985;
Vincent et al 1991), indicate that antipsychotic treatments
may have contributed to the generation of some of the
aforementioned alterations in the schizophrenic brains.
Another observation of our study is that the levels of
MAP2 in the haloperidol-treated animals, though not
reaching statistical significance, were consistently
ele-vated in the same cortical areas where increases in
phosphorylation of this protein were detected. This is
consistent with reports that an increase in MAP2
phos-phorylation not only reduces its microtubule-stabilizing
capacity but also elevates its resistance to proteolysis
(Alexa et al 1996; Johnson and Foley 1993). Interestingly,
studies in schizophrenic brains have suggested that this
disease may be characterized by an upregulation of
non-phosphorylated MAP2 and downregulation of the total
MAP2 in some cortical areas (Arnold et al 1995; Cotter et
al 1997; Dwork 1997). Our findings demonstrate that
haloperidol can, at least partially, counteract these effects
both by increasing the levels of MAP2 phosphorylation
and by reducing the extent of MAP2 degradation in
cortical cells. Consequently, this may be among the bases
for the therapeutic benefits of antipsychotic drugs.
It has recently been demonstrated that spines are the
main sites of D
1dopamine receptors in cortical pyramidal
neurons (for a review, see Goldman-Rakic 1999b).
There-fore, any decrease in the number of spines in the cortex
would be expected to affect the expression of D
1receptors
by these cells. This may explain a decline in the levels of
D
1receptors detected after long-term neuroleptic
treat-ment in the primate cortex (Lidow et al 1997; Lidow and
Goldman-Rakic 1994) and in the cortex of schizophrenic
patients (Okubo et al 1997; Sedvall and Farde 1996).
Several studies have suggested that haloperidol
treat-ment is accompanied by a shift in the position of synaptic
contacts from dendritic spines to dendritic shafts, without
significantly changing the density of synaptic contacts per
se within the cortex (Benes et al 1985; Klinzova et al 1989,
1990; Meshul et al 1992). In agreement with these
observations, we detected no significant changes in the
levels of the synaptic marker synaptophysin in any of the
cortical areas examined. Our results also support the
earlier report of Nakahara et al (1998), who found no
changes in the levels of synaptophysin messenger RNA in
the prefrontal cortex of rats chronically treated with
haloperidol. On the other hand, Eastwood et al (1997)
detected an increase in the levels of this message in the
frontoparietal cortex of haloperidol-treated rats. It should
be noted, however, that the latter study characterized the
parietal cortex, which was not analyzed by us nor by
Nakahara et al (1998). Finally, the lack of
haloperidol-induced changes in synaptophysin levels observed in our
study suggests that antipsychotic treatment may not be
responsible for the decrease in this protein reported in the
prefrontal and medial temporal cortical regions of
schizo-phrenic patients (Eastwood and Harrison 1995; Glantz and
Lewis 1997; Honer et al 1999; Karson et al 1999;
Perrone-Bizzozero et al 1996).
Possible Cellular Mechanisms of
Haloperidol-Induced Alterations in the Proteins Observed in
This Study
One of the major pharmacologic properties of haloperidol
as an antipsychotic medication is its ability to block D
2dopaminergic receptors (for a review, see Seeman 1992).
Since D
2receptors are negatively coupled to adenylyl
cyclase (Hemmings et al 1987), their blockade results in
an increase in the intracellular levels of cyclic adenosine
monophosphate (cAMP; Kaneko et al 1992; Nilsson and
Eriksson 1993), which may persist during long-term
treat-ments despite D
2receptor upregulation (Lau and Gnegy
1982; Okada et al 1996). Analysis of the literature
sug-gests that elevated intracellular cAMP levels can lead to
all of the alterations detected in the haloperidol-treated
animals in this study. For example, upregulation of cAMP
activates protein kinase A (PKA; Walsh et al 1972), which
is one of the major enzymes responsible for
phosphoryla-tion (Goldenring et al 1985; Sloboda et al 1975; Tsuyama
et al 1986, 1987; Walaas and Nairn 1989). The
involve-ment of the cAMP–PKA pathway in increasing
phosphor-ylation of MAP2 is supported in our study by the fact that
this increase reaches statistical significance only for the
serine residues, the only MAP2 residues known to be
susceptible to PKA-induced MAP2 phosphorylation
(Goldenring et al 1985; Walaas and Nairn 1989).
Elevated levels of cAMP could also lead to a collapse of
dendritic spines and, consequently, to decreases in levels
of spinophilin in the affected neurons. This collapse might
result from destabilization of the microtubule skeleton of
spine necks due to the PKA-induced increase in MAP2
phosphorylation. Alternatively, increased intracellular
lev-els of cAMP may affect the cAMP–PKA–CREB pathway,
which has also been demonstrated to play an important
role in the maintenance of dendritic spines (Martin and
Kandel 1996; Murphy and Segal 1997).
respect, it is interesting that chronic administration of the
tricyclic antidepressant desipramine, which interferes with
the brain noradrenergic system, also affects
phosphoryla-tion of the cerebral cortical MAP2 on the serine residue
(Miyamoto et al 1997). Of particular significance may be
the ability of haloperidol to act as a noncompetitive
antagonist at
N
-methyl-
D-asparate (NMDA) receptors
(Coughenour and Cordon 1997; Whittemore et al 1997).
Activation of NMDA receptors has been shown to induce
MAP2 dephosphorylation and increased spine formation
in the cortex (Collin et al 1997; Halpain and Greengard
1990). Haloperidol-induced blockade of NMDA receptors
should therefore result in increased MAP2
phosphoryla-tion and reduced levels of spine-associated proteins, both
of which were observed in our study.
This work was funded by the National Institute of Mental Health Grant No. MH44866 (PSG-R, MSL), the Hoechst Marion Roussel Co. (PSG-R), and the Essel Foundation (MSL).
The authors thank Galina Artamonova, Tatyana A. Trakht, Heather A. Findlay, and Terri A. Beattie for their excellent technical assistance; Dr. Ashiwel S. Undie for his help in designing experiments aimed at analysis of protein phosphorylation; and Dr. Lynn D. Selemon for sharing her extensive expertise in three-dimensional cell counting.
References
Alberts B, Bray D, Lewis J, Raff M, Roberts K, Watson J (1995):
Molecular Biology of the Cell.New York: Garland. Alexa A, Tompa P, Baki A, Vereb G, Friedrich P (1996): Mutual
protection of microtubule-associated protein 2 (MAP2) and cyclic AMP-dependent protein kinase II against mu-calpain.
J Neurosci Res44:438 – 445.
Allen PB, Ouimet CC, Greengard P (1997): Spinophilin, a novel protein phosphatase 1 binding protein localized to dendritic spines.Proc Natl Acad Sci U S A94:9956 –9961.
Anders VN (1978): Ultrastructural features of cerebral synapses in schizophrenic parients.Zh Nevropatol Psikhiatr78:1065–1070. Arnold SE, Lee VM-F, Gur RE, Trojanowski JQ (1995): Abnor-mal expression of two microtubule-associated proteins (MAP2 and MAP5) in specific subfields of the hippocampal formation in schizophrenia. Proc Natl Acad Sci U S A
88:10850 –10854.
Bajjalieh SM, Scheller RH (1995): The biochemistry of neuro-transmitter secretion.J Biol Chem270:1971–1974.
Benes FM, Paskevich PA, Davidson J, Domesik VB (1985): Synaptic rearrangements in medial prefrontal cortex of halo-peridol-treated rats.Brain Res348:15–20.
Berger B, Trottier C, Verney C, Gaspar P, Alvarez C (1988): Regional and laminar distribution of the dopamine and serotonin innervation in the in the macaque cerebral cortex: A radioautoradiographic study.J Comp Neurol273:99 –119. Bloom W, Fawcett DW (1975): The Textbook of Histology.
Philadelphia: Saunders.
Borda T, Genaro AM, Cremaschi G (1999): Haloperidol effect on
intracellular signals system coupled to alpha1-adrenergic recep-tor in rat cerebral frontal cortex.Cell Signal11:293–300. Bourdelais AJ, Deutch AY (1994): The effects of haloperidol and
clozapine on extracellular GABA levels in the prefrontal cortex of the rat: An in vivo microdialysis study. Cereb Cortex4:69 –77.
Brodmann K (1994):Localization in the Cerebral Cortex[Gray LJ, translator]. London: Smith-Gordon.
Cleveland DW, Hoffman PN (1991): Neuronal and glial cy-toskeleton.Curr Opin Neurobiol1:346 –353.
Collin C, Miyaguchi K, Segal M (1997): Dendritic spine density and LTP induction in cultured hippocampal slices.J Neuro-physiol77:1614 –1623.
Cotter D, Kerwin R, Doshi B, Martin CS, Everall IP (1997): Alterations in hippocampal non-phosphorylated MAP2 pro-tein expression in schizophrenia.Brain Res765:238 –246. Coughenour LL, Cordon JJ (1997): Characterization of haloperidol
and trifluperidol as subtype-selective N-methyl-D-aspartate (NMDA) receptor antagonists using [3H]TCP and [3H]ifenprodil
binding in rat brain.J Pharmacol Exp Ther280:584 –592. Csernansky JG (1996):Antipsychotics.New York: Springer Verlag. Dwork AJ (1997): Postmortem studies of the hippocampal
formation in schizophrenia.Schizophr Bull23:385– 402. Eastwood SL, Burnet PW, Harrison PJ (1995): Altered
synapto-physin expression as a marker of synaptic pathology in schizophrenia.Neuroscience66:309 –319.
Eastwood SL, Harrison PJ (1995): Decreased synaptophysin in the medial temporal lobe in schizophrenia demonstrated using immunoautoradiography.Neuroscience69:339 –343. Eastwood SL, Heffernan J, Harrison PJ (1997): Chronic
halo-peridol treatment differentially affects the expression of synaptic and neuronal plasticity-associated genes.Mol Psy-chiatry2:322–329.
Edelmann L, Hanson PI, Chapman ER, Jahn R (1995): Synapto-brevin binding to synaptophysin: A potential mechanism for controlling the exocytotic fusion machine.EMBO J 14:224 – 231.
Garey LJ, Ong WY, Patel TS, Kanani M, Davis A, Mortimer AM, et al (1998): Reduced density on cerebral cortical pyramidal neurons in schizophrenia. J Neurol Neurosurg Psychiatry65:446 – 453.
Glantz LA, Lewis DA (1997): Reduction of synaptophysin immunoreactivity in the prefrontal cortex of subjects with schizophrenia. Regional and diagnostic specificity.Arch Gen Psychiatry54:943–952.
Goldenring JR, Vallano ML, DeLorenzo RJ (1985): Phosphory-lation of microtubule-associated protein 2 at distinct sites by calmodulin-dependent and cyclic-AMP-dependent kinases.
J Neurochem45:900 –905.
Goldman-Rakic PS (1999a): The physiological approach: Func-tional architecture of working memory and disordered cogni-tion in schizophrenia.Biol Psychiatry26:650 – 661. Goldman-Rakic PS (1999b): The “psychic” neuron of the
cere-bral cortex.Ann N Y Acad Sci868:13–26.
Halpain S, Greengard P (1990): Activation of NMDA receptors induces rapid dephosphorylation of the cytoskeletal protein MAP2.Neuron5:237–246.
critical review of the data and their interpretation. Brain
122:593– 624.
Hemmings HC, Walaas SI, Ouimet CC, Greengard P (1987): Dopamine receptors: Regulation of protein phosphorylation. In: Crees I, Fraser CM, editors.Dopamine Receptors.New York: Liss, 115–152.
Honer WG, Falkai P, Chen C, Arango V, Mann JJ, Dwork AJ (1999): Synaptic and plasticity-associated proteins in anterior frontal cortex in severe mental illness. Neuroscience 91: 1247–1255.
Honer WG, Kaufmann CA, Davies P (1992): Characterization of a synaptic antigen of interest in neuropsychiatric illness.Biol Psychiatry31:147–158.
Hutz RJ, Dierschke DJ, Wolf RC (1985): Seasonal effects on ovarian folliculogenesis in rhesus monkeys. Biol Reprod
33:653– 659.
Johnson GV, Foley VG (1993): Calpain-mediated proteolysis pf microtubule-associated protein 2 (MAP2) is inhibited by phosphorylation by cAMP-dependent protein kinase but not by CA21/calmoduline-dependent protein kinase II.J Neuro-sci Res34:642– 647.
Johnson GVW, Jope RS (1992): The role of microtubule-associated protein 2 (MAP2) in neuronal growth, plasticity, and degeneration.J Neurosci Res33:505–512.
Kaneko M, Sato K, Hirikoshi R, Yaginuma M, Yaginuma N, Shiragata M, Kumashiro H (1992): Effects of haloperidol on cyclic AMP and inositol triphosphate in rat striatumin vivo. Prostaglandins Leukot Essent Fatty Acids46:53–57. Karson CN, Mark RE, Schluterman KO, Sturner WQ, Sheng JG,
Griffinj WS (1999): Alterations in synaptic proteins and their encoding mRNAs in prefrontal cortex in schizophrenia: A possible neurochemical basis for “hypofrontality”.Mol Psy-chiatry4:39 – 45.
Kebabian JW, Greengard P (1971): Dopamine-sensitive adenyl cyclase: Possible role in synaptic transmission.Science174: 1346 –1349.
Keith CH (1990): Neurite elongation is blocked if microtubules polymerization is inhibited in PC12 cells. Cell Motil Cy-toskeleton17:95–105.
Kelley JJ, Gao XM, Tamminga CA, Roberts RC (1997): The effect of chronic haloperidol treatment on dendritic spines in the rat striatum.Exp Neurol146:471– 478.
Klinzova AJ, Haselhorst U, Uranova NA, Schenk H, Isomin VV (1989): The effect of haloperidol on synaptic plasticity in rat medial prefrontal cortex.J Hirnforsch30:51–57.
Klinzova AJ, Uranova NA, Haselhorst U, Schenk H (1990): Synaptic plasticity in rat medial prefrontal cortex under haloperidol treatment produced behavioral sensitivity.J Hirn-forsch2:173–179.
Lau Y-S, Gnegy ME (1982): Chronic haloperidol treatment increased calcium-dependent phosphorylation in rat striatum.
Life Sci30:21–28.
Lidow MS, Elthworth JD, Goldman-Rakic PS (1997): Down-regulation of the D1 and D5 dopamine receptors in the primate prefrontal cortex by chronic treatment with antipsy-chotic drugs.J Pharmacol Exp Ther281:597– 603.
Lidow MS, Goldman-Rakic PS (1994): A common action of clozapine, haloperidol and remoxipride on D1-and D2-dopa-mine receptors in the primate cerebral cortex.Proc Natl Acad Sci U S A91:4353– 4356.
Lidow MS, Goldman-Rakic PS (1997): Differential regulation of D2 and D4 dopamine receptor mRNAs in the primate cerebral cortex vs. neostriatum: Effects of chronic treatment with typical and atypical antipsychotic drugs. J Pharmacol Exp Ther283:939 –946.
Lidow MS, Goldman-Rakic PS, Rakic P, Innis RI (1989): Dopamine D2 receptors in the cerebral cortex: Distribution and pharmacological characterization with [3H]raclopride.
Proc Natl Acad Sci U S A86:6412– 6416.
Lidow MS, Williams G, Goldman-Rakic PS (1998): A case for cerebral cortex as a common site of action by antipsychotic medications.Trends Pharmacol Sci19:136 –140.
Lipton SA, Kater SB (1989): Neurotransmitter regulation of neuronal outgrowth, plasticity and survival.Trends Neurosci
7:265–270.
Maccioni RB, Cambiazo V (1995): Role of microtubule-associ-ated proteins in the control of microtubule assembly.Physiol Rev75:835– 864.
Martin KC, Kandel ER (1996): Cell adhesion molecules, CREB, and the formation of new synaptic connections. Neuron
17:567–570.
Masliah E, Terry RD, Alford M, DeTersa R (1990): Quantitative immunohistochemistry of synaptophysin in human neocortex: An alternative method to estimate density of presynaptic termi-nals in paraffin sections.J Histochem Cytochem38:837– 844. Meshul CK, Janowsky A, Casey DE, Stallbaumer RK, Taylor B
(1992): Effects of haloperidol and clozapine on the density of “perforated” synapses in caudate, nucleus accumbens, and medial prefrontal cortex.Psychopharmacology106:45–52. Miyamoto S, Asakura M, Sasuga Y, Osada K, Bodaiji N,
Imafuku J, Aoba A (1997): Effects of long-term treatment with desipramine on microtubule proteins in rat cerebral cortex.Eur J Pharmacol333:279 –287.
Murphy DD, Segal M (1997): Morphological plasticity of dendritic spines in central neurons is mediated by activation of cAMP resdponse element binding protein.Proc Natl Acad Sci U S A94:1482–1487.
Nakahara T, Nakamura K, Tsutsumi T, Hashimoto K, Hondo H, Hisatomi S, et al (1998): Effects of chronic haloperidol treatment on synaptic protein mRNAs in the rat brain. Mol Brain Res61:238 –242.
Nalepa I (1993): The effect of chlorpromazine and haloperidol on second messenger system related to adrenergic receptors.
Pol J Pharmacol45:399 – 412.
Nieuwenhuys R (1985):Chemoarchitecture of the Brain. New York: Springer Verlag.
Nilsson CL, Eriksson E (1993): Haloperidol increases prolactin release and cyclic AMP formationin vitro:Inverse agonism at dopamine D2 receptors?J Neural Transm92:213–220. Okada F, Ito A, Horikawa T, Tokumitsu Y, Nomura Y (1996):
Long-term neuroleptic treatments counteract dopamine D2 agonist inhibition of adenylate cyclase but do not affect pertussis toxin ADP-rybosylation in the rat brain.Neurochem Int28:161–168.
Okubo Y, Suhara T, Suzuki K, Kabayashi K, Inoue O, Terasaki O, et al (1997): Decreased prefrontal dopamine D1 receptors in schizophrenia revealed by PET.Nature385:634 – 636. Perrone-Bizzozero NI, Sower AC, Bird ED, Benowitz LI, Ivins
GAP-43 are selectively increased in association cortices in schizophrenia.Proc Natl Acad Sci U S A93:14182–14187.
Physicians’ Desk Reference,53rd ed (1999): Oradell, NJ: Med-ical Economics.
Roth BL, Berry SA, Kroeze WK, Willins DL, Kristiansen K (1998): Serotonin 5HT2A receptors: Molecular biology and mechanisms of regulation.Crit Rev Neurobiol12:319 –338. Sasaki T, Kennedy JL, Nobrega JN (1997): Localized changes in
GABA receptor-gated chloride channel in rat brain after long-term haloperidol:Relation to vacuous chewing move-ments.Synapse25:73–79.
Sedvall G, Farde L (1996): Dopamine receptor in schizophrenia.
Lancet347:264.
Seeman P (1988): Tardive dyskinesia, dopamine receptors, and neuroleptic damage to cell membranes. J Clin Psychophar-macol8(suppl):3S–9S.
Seeman P (1990): Atypical neuroleptics: Role of multiple recep-tors, endogenous dopamine, and receptor linkage.Acta Psy-chiatr Scand358(suppl):14 –20.
Seeman P (1992): Dopamine receptor sequences. Therapeutic levels of neuroleptics accupy D2 receptors, clozapine occu-pies D4.Neuropsychopharmacology7:261–284.
Selemon LD, Lidow MS, Goldman-Rakic PS (1999): Increased volume and glial density in primate prefrontal cortex associ-ated with chronic antipsychotic drug exposure. Biol Psychi-atry46:161–172.
Selemon LD, Rajkowska G, Goldman-Rakic PS (1996): Abnor-mally high neuronal density in the schizophrenic cortex.Arch Gen Psychiatry52:805– 818.
Shea TB, Beermann ML (1994): Respective roles of neurofila-ments, microtubules, MAP1B and tau in neurite outgrowth and stabilization.Mol Cell Biol5:863– 875.
Sloboda RD, Rudolph SA, Rosenbaum JL, Greengard P (1975): Cyclic AMP-dependent endogenous phosphorylation of a microtubule-associated protein. Proc Natl Acad Sci U S A
72:177–181.
Smith FD, Oxford GS, Milgram SL (1999): Association of D2 dopamine receptor third cytoplasmic loop with spinophilin, a protein phosphatase-1-interacting protein. J Biol Chem274: 19894 –19900.
Tsuyama S, Bramblet GT, Huang KP, Flavin M (1986): Calcium/ phospholipid-dependent kinase recognized sites in microtu-bule-associated protein 2 which are phosphorylated in living brain and are not accesible to other kinases. J Biol Chem
261:4110 – 4116.
Tsuyama S, Terayama Y, Matsuyama S (1987): Numerous phosphates of microtubule-associated protein in living rat brain.J Biol Chem262:10886 –10892.
Uranova NA (1988): Structural changes in the neuropil of the frontal cortex in schizophrenia.Zh Nevropatol Psikhiatr88:52–58. Uranova NA, Casanova MF, DeVaughn NM, Orlovskaya DD,
Denisov DV (1996): Ultrastructural alterations of synaptic contactes and astrocytes in postmortem caudate nucleus of schizophrenic patients.Schizophr Res22:81– 83.
Uranova NA, Orlovskaya DD, Apel K, Klintsova AJ, Haselhorst U, Schenk H (1991): Morphometric study of synaptic patterns in the rat caudate nucleus and hippocampus under haloperidol treatment.Synapse7:253–259.
Vincent SL, Adamec E, Sorensen I, Benes FM (1994): The effects of chronic haloperidol administration on GABA-immunoreactive axon terminals in rat medial prefrontal cor-tex.Synapse17:26 –35.
Vincent SL, McSparren J, Wang RY, Benes FM (1991): Evi-dence for ultrastructural changes in cortical axodendritic synapses following long-term treatment with haloperidol or clozapine.Neuropsychopharmacology5:147–155.
Walaas SI, Nairn AC (1989): Multisite phosphorylation of microtubule-associated protein 2 (MAP2) in rat brain: Peptide mapping distinguishes between cyclic AMP-, calcium/cal-modulin-, and calcium/phospholipid-regulated phosphoryla-tion mechanisms.J Mol Neurosci1:117–127.
Walker E (1940): A cytoarchitectural study of the prefrontal area of the macaque monkey.J Comp Neurol73:59 – 86. Walker ML, Gordon TP, Wilson ME (1983): Menstrual cycle
characteristics of seasonally breeding rhesus monkeys. Biol Reprod29:841– 848.
Walsh DA, Brostrom CO, Brostrom MA, Chen L, Corbin JD, Reimann E, et al (1972): Cyclic AMP-dependent protein kinase from skeletal muscle and liver.Adv Cyclic Nucleotide Res1:33– 45.
Weinberger DR, Aloia MS, Goldberg TE, Berman KF (1994): The frontal lobes and schizophrenia.J Neuropsychiatry Clin Neurosci6:419 – 427.
Whittemore ER, Ilyin VI, Woodward RM (1997): Antagonism of N-methyl-D-aspartate receptors by s site ligands: Potency, subtype-selectivity and mechanisms of inhibition.J Pharma-col Exp Ther282:326 –338.
Wiche G, Oberkanins C, Himmler A (1991): Molecular structure and function of microtubule-associated proteins.Int Rev Cytol
124:217–273.
Williams RW, Rakic P (1988a): Elimination of neurons from the rhesus monkey’s lateral geniculate nucleus during develop-ment.J Comp Neurol272:424 – 436.
Williams RW, Rakic P (1988b): Three-dimentional counting: An accurate and direct method to estimate numbers of cells in sectioned material.J Comp Neurol278:344 –352.
Williams SM, Goldman-Rakic PS (1993): Characterization of the dopaminergic innervation of the primate frontal cortex using a dopamine-specific antibody.Cereb Cortex3:199 – 222.
Wilson JR, Ludowyke RS, Biden TJ (1998): Nutrient stimulation results in a rapid Ca12-dependent threonine phosphorylation
of myosin heavy chain in rat pancreatic islets and RINm5F cells.J Biol Chem28:22729 –22737.
Yamada KM, Spooner BS, Wessells NK (1970): Axon growth: Role of microfilaments and microtubules.Proc Natl Acad Sci U S A66:1206 –1212.
Yan Z, Hsieh-Wilson L, Feng J, Komizawa K, Allen PB, Fienberg AA, et al (1999): Protein phosphatase 1 modulation of neostriatal AMPA channels: Regulation by DARPP-32 and spinophilin.Nat Neurosci2:13–17.