www.elsevier.comrlocateratmos
Determination of cloud microphysical properties
from AVHRR images: comparisons of
three approaches
Anne Fouilloux
a,), Jean-Franc
¸ois Gayet
a, Karl-Theodor Kriebel
ba
Laboratoire de Meteorologie Physique, UPRESA 6016 CNRS, Uni´ ´ Õersite Blaise Pascal, Aubiere, France´ `
b
Institut fur Physik der Atmosphare, Deutsche Forschungsanstalt fur Luft-und Raumfahrt,¨ ¨ ¨
Oberpfaffenhofen, Germany
Received 8 January 1998; accepted 1 March 2000
Abstract
This contribution to the EUCREX mission 206 series aims at evaluating the performances of
Ž
three methods considered for the retrieval of cloud microphysical properties optical depth, droplet
Ž ..
effective radius and liquid water path LWP from Advanced Very High Resolution Radiometer
ŽAVHRR satellite images. These procedures, namely a set of empirical parameterizations, a.
physically based inversion code, and a neuronal approach, are tested with the mission 206 case study. The influence of horizontal averaging on the retrieved cloud properties is also investigated to assess the limitations of the comparison between satellite observations and aircraft measure-ments performed at a smaller scale.q2000 Elsevier Science B.V. All rights reserved.
Keywords: Cloud radiative properties; Remote sensing retrieval techniques
1. Introduction
For usual satellite remote sensing applications, the classical inversion problem consists of extracting pertinent parameters that characterize the medium from a set of
)Corresponding author. LIVIC, Bat 140, 13 route de la Miniere, 78000 Versailles, France. Tel.:` q
33-1-40-43-29-07; fax:q33-1-40-43-29-30.
Ž .
E-mail address: [email protected] A. Fouilloux .
0169-8095r00r$ - see front matterq2000 Elsevier Science B.V. All rights reserved.
Ž .
( ) A. Fouilloux et al.rAtmospheric Research 55 2000 65–83
66
radiative measurements, namely the radiances sampled in several illumination and observation conditions andror in different spectral bands. As part of meteorological and climate studies, the correct interpretation of such observations in terms of cloud microphysical properties requires the development of tools that are in the meantime
Ž .
powerful, robust and fast Arking and Childs, 1985; Rossow, 1989 .
Among the various retrieval procedures that were developed for deriving cloud
Ž . Ž
optical thickness, liquid water path LWP or droplet effective radius Kriebel et al.,
.
1989; Nakajima and King, 1990; Parol et al., 1991; Iaquinta and Pinty, 1997 , three kinds of approaches emerged: empirical parameterizations derived from in situ measure-ments, physical methods using optimization techniques or look-up tables, and a new generation of algorithms built with neuronal networks. These techniques have often been validated for homogeneous clouds, but their performances on heterogeneous situations are less documented.
The aim of the present paper is to retrieve values of cloud optical thickness, droplet effective radius and LWP within the stratocumulus observed on 18 April 1994, during
Ž .
the European Cloud and Radiation Experiment EUCREX mission 206. This case is particularly interesting since the cloud system was rather homogeneous over land surfaces, but progressively broken towards the North, over the Atlantic ocean. This case thus provides an opportunity to test the three retrieval procedures over a large range of
Ž .
heterogeneity of the cloud structure. The methods tested here are: i the AVHRR
Ž .
Processing Scheme Over Clouds, Land and Ocean APOLLO parameterizations of
Ž . Ž . Ž .
Kriebel et al. 1989 ; ii the Cloud Retrieval CRTVL inversion code developed by
Ž . Ž .
Nakajima and Nakajima 1995 ; and iii the Adjustable Combination of Neuronal
Ž . Ž .
Networks ACNN algorithm recently elaborated by Fouilloux and Iaquinta 1998 . Parameterizations specifically developed for the determination of cloud microphysical properties is an attractive solution since the method is straightforward and does not necessitate tedious computations. However, care must be taken to avoid using the parameterizations on situations that may differ significantly from those for which the empirical formulas have been developed.
Inversion techniques, such as CRTVL, require a preliminary modeling step and their accuracy depends upon the efficiency of the method at recovering the optimal fit between the actual radiances and those predicted by the radiative transfer model
ŽNakajima and Tanaka, 1986 . In order to avoid laborious and repeated calculations at.
each iteration, it is advantageous to keep only relevant information into look-up tables
ŽNakajima and King, 1990 . Therefore, the intrinsic quality of the retrieval depends on.
the model accuracy, but it is also strongly conditioned by the resolution of the look-up table in the parameter space.
The third method is based on a combination of self-organised neuronal networks
ŽFouilloux and Iaquinta, 1998 and performs a classification where the accuracy to be.
achieved is one of the parameters driving the procedure. That allows to explicitly design the network by increasing the number of classes, according to the desired accuracy.
2. Description of the retrieval schemes
2.1. Satellite data
The radiance data considered hereafter are taken from the Advanced Very High
Ž .
Resolution Radiometer AVHRR instrument mounted on board the National Oceanic
Ž .
and Atmospheric Administration NOAA -11 satellite.
The NOAA-AVHRR satellite image of 18 April 1994 was recorded at around 08:25 UTC, while in situ measurements with the instrumented aircraft were performed
Ž .
between 09:30 and 12:00 UTC Pawlowska et al., 2000b . The following analysis is
Ž .
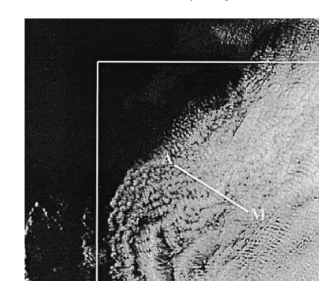
conducted in five spectral bands Table 1 with a spatial resolution of about 1.1 km. Fig. 1 shows the satellite image in the first visible channel. The bordered area of 300=300 pixels is the region of interest for the present study and the white straight line represents
Ž .
the aircraft sampling track Pawlowska et al., 2000b . Fig. 1 reveals that the cloud system is more heterogeneous towards the northwest of the sampling leg, above the Atlantic Ocean than towards the southeast, over the coast of Brittany.
The calibration procedures applied to this data follow standard techniques. In particular, since the visible channel of the sensor has been degrading from the pre-launch
Ž .
condition, the corrected calibration constants of Kaufman and Holben 1993 have been used to obtain the radiances from the satellite-recorded digital counts.
2.2. APOLLO parameterizations for cloud microphysical properties
Ž
The first step in this approach consists in making a cloud classification Saunders and
.
Kriebel, 1988 to identify pixels, which are fully cloudy. These are then categorized into thick and thin clouds. The thick clouds are then divided into low, medium and high clouds according to their temperature. Thick clouds are treated as water clouds. For the second step, the optical thickness and LWP are computed on a pixel-by-pixel basis using
Ž . Ž . Ž
parameterizations according to Stephens 1978 and Stephens et al. 1984 see also
.
Kriebel et al., 1989 . They are based on the observation that the radiation fields are the
Ž . Ž
most sensitive to cloud optical thickness in the visible window 0.4 to 0.8mm Curran
.
and Wu, 1982; Arking and Childs, 1985; Nakajima and King, 1990 . The formulas are thus valid in the solar spectral range, at wavelengths below 0.7mm, and they are used
( ) A. Fouilloux et al.rAtmospheric Research 55 2000 65–83
68
Fig. 1. Visible channel of the NOAA-AVHRR image at 08:24 UTC on 18 April 1994. The image encompasses the stratocumulus cloud area covered by the AVHRR measurements. The area of interest is indicated by a white frame and the leg flown by the instrumented aircraft is marked by a white segment.
with the AVHRR channel 1 data. The directional–hemispherical cloud reflectance in
Ž .
Channel 1, Rc m0 , is related to cloud optical thicknesst by the following relationship:
b m
Ž
0. Ž
t m0.
rm0Rcs
Ž .
11qb m
Ž
0. Ž
t m0.
rm0Ž .
where b m0 is the modified backscattering coefficient given for water clouds with optical thickness ranging from 1 to 500 and m0 is the cosine of the solar zenith angle.
Ž .
The values of b m0 that are considered hereafter are listed in the paper of Stephens et
Ž .
al. 1984 .
Ž y2.
The cloud LWP in g m is derived from the optical thickness by the following
Ž .
formula Kriebel et al., 1989 :
0 .234
log LWP
Ž
.
sŽ
0.5454=t.
Ž .
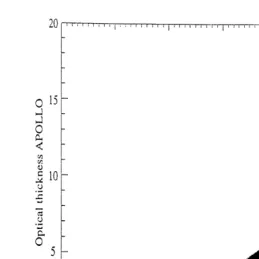
2Fig. 2 shows the dependence between directional–hemispherical cloud reflectance
Ž .
Fig. 2. Optical thickness values retrieved with the APOLLO code as a function of the actual directional
Ž .
hemispherical cloud reflectance, Rc m0 .
Ž .
no values of Rc m0 below 0.3 because such pixels are not classified as water clouds
Žthick clouds and are therefore eliminated..
2.3. CRTVL inÕersion code
Ž .
The CRTVL inversion code Nakajima and Nakajima, 1995 has been implemented to simultaneously retrieve optical thickness and droplet effective radius of cloudy pixels from the NOAA-AVHRR satellite images. This algorithm computes the microphysical
Ž . Ž
quantities from the radiances at visible 0.58 to 0.65mm and near-infrared 3.55 to 3.93
.
mm wavelengths by making use of look-up tables that saves computational time, yet conserving the accuracy of the analysis. For the simulation of the satellite measured radiances, we applied the radiative transfer model developed by Nakajima and Tanaka
Ž1986 with an atmosphere typical of winter oceanic mid latitudes. The number of.
Ž .
vertical levels are set to four with boundaries at 1, 2, 12 and 20 km . That does not particularly alter the results and drastically reduces the computational time. According to aircraft observations, the cloud layer was set at 1 km, and we assumed a Lambertian
Ž .
surface albedo of 0.06 for the underlying oceanic surface.
( ) A. Fouilloux et al.rAtmospheric Research 55 2000 65–83
70
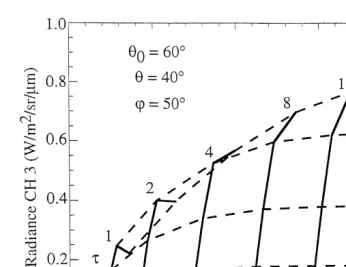
Fig. 3. Simulation of reflected solar radiances in AVHRR channels 1 and 3 as functions of cloud optical
Ž . Ž . Ž
thickness ts1, 2, 4, 8, 16, 32, 64 and effective radius reffs2, 4, 8, 16, 32 , with u0s608,us408and
.
ws508. The isolines of optical thickness and effective radius are represented by solid and dashed lines, respectively.
solar zenith angle of 608, a satellite zenith angle of 408 and a relative azimuth of 508. Near-vertical and near-horizontal lines illustrate iso-optical thickness and iso-effective radius radiances, respectively. Ground-reflected and thermal radiations are not taken into account, and the LOWTRAN-7 model associated with a mid-latitude model is
consid-Ž
ered to properly take into account the gaseous aerosol absorption Nakajima and King,
.
1990 . The principle of the inversion procedure is deduced from this figure as follows: Thet value is sought so as to minimize the difference between the actual and theoretical
Žstored in the look-up tables cloud-reflected radiances in the first channel the threshold. Ž .
being 0.1% . Afterwards,t is set to this value and reff is modified until the difference between measured and tabulated radiances in the third channel becomes less than 0.1%.
Ž .
This process is repeated until both differences in the visible and near infrared channels
Ž y2.
become lower than 0.1%, which usually requires three to four iterations. LWP g m is then calculated from the droplet effective radius and cloud optical thickness values by using the following equation:
2
LWPs rtreff
Ž .
33
Ž y3.
2.4. ACNN neuronal network
The main problem with the previous approaches is that, with APOLLO, the determi-nation of optical thickness and LWP is fast, but rather inaccurate, while with CRTVL,
Ž .
the retrieval requires large computer storage because of the huge look-up tables. A compromise between accuracy and fastness seems to be possible through a combination
Ž .
of neural networks as described in Fouilloux and Iaquinta 1998 .
The principle of the method is as follows: The determination of optical thickness and droplet effective radius is split into several steps, each being dedicated to a particular task. The first step consists in classifying the pixels of an AVHRR image into cloud categories. Actually, the same algorithm as in APOLLO has been used for cloud classification, for a better comparison between the two methods. The second step allows differentiation of the pixels as a function of the geometry of illumination and
observa-Ž .
tion. One or two further steps depending on the desired accuracy are then required for the determination of the retrieved parameters. They are performed with self-organized
Ž .
neuronal networks with two layers for the entry and for the output cells so as to let the system converge near a stable configuration corresponding to the required degree of accuracy. The accuracy depends on the quantity of information that the entry vectors
Ž . Ž
convey and also on a ‘‘ vigilance’’ factor also called the accuracy factor j a value
.
between 0 and 1 fixed by the operator. If this factor is close to 1, the system is forced to solve with a great accuracy and inversely, when j tends to 0, the system is relaxed to a lower accuracy. Nevertheless, the accuracy of the restitution depends also on both the radiative transfer model used and the degree of noise included in the initial data.
The inversion process is divided into two stages: a learning phase during which the connection weights of the neuronal networks are fixed and a generalization phase that consists in using the neuronal network with actual remotely sensed data.
Regarding the learning phase, several synthetic databases, containing radiances in the two visible and near infrared AVHRR channels for various values of the illuminationr observation geometry and cloud parameters are generated by running the radiative
Ž .
transfer model Nakajima and Tanaka, 1986 . In order to limit the size of these learning
Ž .
data sets i.e., the range of possible values for the retrieved variables , a sorting is performed by means of a ‘‘rough’’ cloud classification of AVHRR imagery. Such a
Ž .
discrimination considers the algorithm proposed by Saunders and Kriebel 1988 , which relies on five tests conducted on the two visible and two infrared AVHRR channels. Four categories have been identified, for which specific distributions of cloud optical thickness and droplet effective radius were defined. On 18 April 1994, most of the cloudy pixels are recognized as low clouds, which is in agreement with the aircraft
Ž .
observations Pawlowska et al., 2000a . For this cloud category, the following character-istics for the droplet size distribution have been selected: a number concentration of 350
y3 Ž .
cm , a mean radius of 4mm the size distribution ranges from 0 to 20mm and a LWC
y3 Ž .
value of 0.09 g m Cotton and Anthes, 1989 . These values are derived from a large
Ž .
set of in situ data made during several experiments Cotton and Anthes, 1989 and they are considered as typical of mid-latitude stratocumulus clouds. The selected droplet size
Ž
distribution is similar to the distributions measured in situ during mission 206 Pawlowska
.
( ) A. Fouilloux et al.rAtmospheric Research 55 2000 65–83
72
The first neural network is specially designed to discriminate the pixels as a function of the geometry of illumination and observation. These parameters have been added as
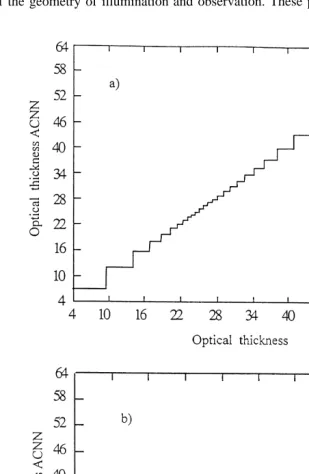
Fig. 4. Optical thickness values issued from the ACNN classification vs. values fixed in the radiative transfer
Ž . Ž .
neural network inputs to visible and near-infrared radiances and the accuracy parameter
j has been set to a value of 0.7 in order to distinguish 25 classes. A second network allows to determine cloud optical thickness and droplet effective radius. Fig. 4a and b shows the sensitivity of the neuronal network to values of optical thickness and of the
Ž .
parameterj two values — 0.5 and 0.8 — are used . It appears that in both cases, the steps clearly depend on optical thickness, and that the accuracy is improved when j
Ž .
increases the various steps are less pronounced . Similar results are found with the droplet effective radius when using a learning database sensitive to this parameter. LWP
Ž .
is finally computed using Eq. 3 .
2.5. Accuracy assessment
The application of APOLLO parameterizations is straightforward and very fast, but the uncertainty on the estimated parameters is of the order of 35%. Nevertheless, these
Ž
parameterizations have been extensively validated against in situ measurements Kriebel,
.
1989; Kriebel et al., 1989; Kaestner et al., 1993 . The CRTVL inversion code, which
Ž .
provides an accuracy of about 10% with synthetic data , has been tested against actual measurements and no systematic bias was found. The uncertainties were however not systematically computed. The ACNN and CRTVL inversion procedures have been tested on a large set of synthetic clouds of various types, and a very good agreement has
Ž .
been found the discrepancies are lower than 10% for values of optical thickness lower than 25 and values of droplet effective radius lower than 20 mm. The discrepancies between the two methods increase to 30% and 45%, for optical thickness and droplet effective radius, respectively, in the case of cumulonimbus clouds, that are characterized by much higher values of optical thickness and effective radius. In fact, the model that is
Ž . Ž .
used for generating either the look-up tables CRTVL or the learning database ACNN , is not efficient at simulating radiative transfer in very thick clouds.
3. Comparisons
3.1. APOLLOÕs. CRTVL
Ž
The comparison is conducted over the area of 300=300 pixels white frame in Fig.
.
1 covered by the stratocumulus cloud of interest. Fig. 5a shows the values of optical thickness derived from the CRTVL code vs. values calculated with the APOLLO parameterization. Values of the same order of magnitude are derived with both tech-niques, with minimum values of 2 and 3.6, and maximum values of 12 and 15, for CRTVL and APOLLO, respectively. Nevertheless, the agreement between the two methods is poor as indicated by the correlation factor of 0.6. Fig. 5b shows the comparison of the LWP values. The differences are even larger than for optical thickness, and the correlation factor is only 0.52. With the CRTVL inversion code, the mean effective radius is about 7.5mm, which is in agreement with in situ measurements
( ) A. Fouilloux et al.rAtmospheric Research 55 2000 65–83
This demonstrates that the parameterization of LWP in the APOLLO method is not well adapted to the type of clouds examined here.
3.2. ACNNÕs. CRTVL
Fig. 6a shows values of optical thickness retrieved with the ACNN approach vs. values derived from the CRTVL code, on the same 300=300 pixels area as in the previous section. The agreement is quite good, with a mean relative difference of 10%.
Ž .
The largest discrepancies are observed for small values of t lower than 3 . At such values, the inversion with CRTVL is ambiguous, as the same values of reflectances are
Ž .
produced by the model with two different sets of values of t and reff Fig. 3 . In constrast, the distribution of values of optical thickness and effective radius used for the generation of the learning ACNN database has been restricted to values representative of
Ž .
a stratocumulus cloud Fouilloux and Iaquinta, 1998 . Therefore, the ACNN solutions are likely to be more realistic than some of the ambiguous CRTVL solutions.
It must also be noted that, for both the CRTVL and ACNN methods, cloud heterogeneities are not explicitly taken into account in the model since the radiative
Ž .
transfer scheme is plane-parallel cloud parameters uniform horizontally . Therefore, additional errors are produced in the most heterogeneous parts of the mission 206 stratocumulus cloud, namely in the northern part of the system, over the ocean, where the lowest values of optical thickness are also observed.
Fig. 6b illustrates the comparison of the LWP values retrieved with ACNN vs. CRTVL. The mean relative difference is 7%. This is greater than with synthetic data, but
Ž
much lower than with the APOLLO parameterization. At small values of LWP between
y2.
2 and 25 g m , the discrepancies are slightly larger than for the optical thickness. This corresponds to small values of both optical thickness and effective radius, for which multiple solutions are possible with CRTVL, while ACNN is restricted to realistic values. In order to eliminate this inconsistency in CRTVL, a cloud classification
ŽSaunders and Kriebel, 1988 can be conducted as a pre-processing for the CRTVL.
Ž .
approach, for an a priori selection of the most probable solutions t, reff .
Direct comparison of the APOLLO calculations with the ACNN retrieved values has not been attempted here, since the results would be very similar to those obtained with
Ž .
the CRTVL code Section 3.1 . Actually, the remaining question is to assess which of these three retrieval approaches is the most accurate compared to in situ measurements of cloud characteristics. In the 18 April 1994 case study, the time difference between aircraft and satellite observations is approximately 2 h. This prevents any point-to-point comparison. The results of the ACNN method will however be tested vs. in situ
Ž
measurements and other remote sensing techniques in the summary paper Pawlowska et
.
al., 2000b . The area selected for such a comparison is restricted to the region, which is likely to be advected across the aircraft sampling leg between 10:00 and 12:00 UTC, based on constant wind speed and direction in the boundary layer, of 10 msy1 and 508,
Ž .
Fig. 5. Comparison of the values derived with CRTVL vs. APOLLO: optical thickness in a and effective
Ž .
( ) A. Fouilloux et al.rAtmospheric Research 55 2000 65–83
Ž .
respectively Pawlowska et al., 2000b . This procedure is necessary for the comparison between AVHRR and in situ measurements, but it is based on the crude hypothesis that the cloud system and the wind are stationary over a 2-h period. Because of the spatial uncertainty of this extrapolation procedure, it is no longer justified to keep the best spatial resolution and AVHRR data can be averaged over larger samples to reduce the variability of the retrieved parameters. The comparison can then be performed on a
Ž .
statistical basis. The various quantities radiances, t and reff have accordingly been averaged over boxes of 5=5 and 10=10 pixels. The effects of averaging are discussed in the next section.
3.3. Horizontal aÕeraging
The effects of averaging depend upon cloud homogeneity, that must be quantified. It is measured by H, the ratio of the standard deviation of the parameter of interest, either optical thickness, or effective radius, to its mean value, over areas of either 5=5 or 10=10 pixels.
In a first step, the satellite radiances in channels 1, 3 and 4 are averaged over the
Ž .
5=5 10=10 pixels areas. Cloud optical thicknesstAI and droplet effective radius rAI
Ž
are then retrieved with the ACNN method the index ‘‘AI’’ indicates that the data are
.
averaged before inversion . In a second step, the parameterstIA and rIA are estimated
Ž .
from the satellite image at the spatial resolution of 1.1 km and then averaged over the
Ž . Ž .
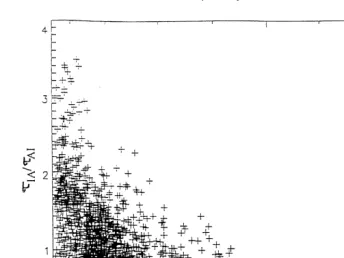
5=5 10=10 pixels areas ‘‘IA’’ means inversion before averaging . Similar results were obtained with 5=5 and 10=10 pixels averaging, so that the 10=10 case will not be further discussed. Fig. 7 shows the ratiotIArtAI as a function of H calculated over 5=5 pixels. Fig. 8 is similar for the droplet effective radius. These graphs reveal that, for large values of H, tIA is lower thantAI, while rIA is greater than r . Intuitively,AI this result is not very surprising because the albedo is smaller over heterogeneous clouds
Ž
than over the equivalent homogeneous area with the same averaged optical propertiest
.
and r , whereas the transmission is larger.
Nevertheless, no tendencies can be observed for small values of H since the ranges of values of the ratiostIArtAI and rIArrAI are very large. This can be explained by the
Ž
fact that the parameter H does not take into account particular clouds structures i.e.,
.
specific orientation with respect to the geometry of illumination, etc. . A better characterization of the cloud heterogeneities could be made by using the textural properties of clouds that can be computed using Gray Level Cooccurrence Matrices
ŽHaralick, 1979 , Gray Level Difference Vector Weszka et al., 1976 or Sum and. Ž .
Ž . Ž
Difference Histogram Unser, 1986 . Among these textural properties all of them could
.
not be computed because of the amount of computational time required , those that are really pertinent for the characterization of cloud fluctuations still have to be settled. Therefore, further investigations must be undertaken in order to improve the analysis of
Ž .
Fig. 6. Comparison of the values derived with ACNN vs. CRTVL: optical thickness in a and effective radius
Ž .
( ) A. Fouilloux et al.rAtmospheric Research 55 2000 65–83
78
Fig. 7. Ratio of the values of optical thickness derived before averaging to those derived from averaged radiances, vs. cloud homogeneity.
Ž . Ž .
heterogeneous clouds as in Garand 1988 or Bankert 1993 , where the cloud textural properties are taken into account.
The problems we faced are the same as those to be encountered when comparisons between aircraft data and satellite observations are performed. Indeed, the optical thickness and the droplet effective radius are derived from in situ measurements with a
Ž y1
horizontal resolution of about 100 m aircraft speed of 100 ms and sampling
.
frequency of 1 Hz and then averaged at the scale of the satellite data. The optical thickness issued from the aircraft data should thus be lower than that computed from the AVHRR satellite image, while the values of droplet effective radius measured by the aircraft should be greater than those derived from the satellite observations. These are very significant results that we have to keep in mind for the comparisons between data of different spatial scales.
3.4. ACNN learning database of in situ measurements
Different sources of information can be combined to increase the accuracy of a neural network. This is done here with the values of cloud optical thickness and droplet effective radius that have been derived from in situ microphysical measurements
ŽPawlowska et al., 2000b . It is, however, not possible to relate those values directly to.
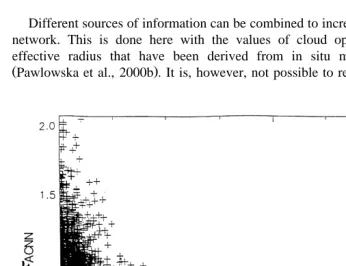
Fig. 9. Ratio of the values of optical thickness derived with the ACNNq network to those derived with the
( ) A. Fouilloux et al.rAtmospheric Research 55 2000 65–83
80
the values of radiances measured with AVHRR, because of the time lag between the AVHRR image and the in situ measurements. A first attempt is made here by assuming that the cloud system is stationary and that it is advected with the mean wind in the
Ž .
boundary layer Pawlowska et al., 2000b . Each pixel of the AVHRR image is advected assuming a 2-h difference between the two sets of measurements. Only values measured at the top of the convective cells are selected since the adiabatic estimation of optical
Ž
thickness and effective radius from in situ data is restricted to such regions Pawlowska
.
et al., 2000a .
Hence, the neural network is enriched with this new information without performing another complete learning phase. Clearly, any additional material can be further intro-duced if necessary as soon as it is available. The computational time required for the learning phase is therefore reduced, while the accuracy of the inversion can be improved.
Retrievals have then been conducted over boxes of 5=5 pixels with this new ACNN
Ž q. q
version called ACNN . Fig. 9 represents the ratio tAC NNrtACNN as a function of H and Fig. 10 represents the ratio rqAC NNrrACNN. Fig. 9 shows that the values derived in homogeneous cloud regions, with the synthetic learning database, only and those derived after implementation of the in situ data learning base agree reasonably well, whereas, for more heterogeneous cases, the new values of optical thickness are smaller than the original ones. This is quite surprising because theoretical considerations show that in the
case of heterogeneous clouds, implementation of in situ data in the learning base should lead to greater values than the ones derived with the synthetic learning database only. The same tendency as in Fig. 7 is observed, namely an under-estimation of optical thickness. In contrast, the over-estimation of the droplet effective radius apparent in Fig.
q Ž q
8 is not observed with the ACNN method in Fig. 10 the ratio rAC NNrrACNN is always
.
close to 1 .
This study shows that comparison between data sampled at different spatial scales is not that simple: It requires new campaigns of measurements with simultaneous in situ and remote sensing measurements of different cloud types. Indeed, the experimental approach is necessary to improve and validate retrieval procedures, which aim at taking into account cloud heterogeneities. Since there is no systematic bias, it is not conceiv-able to make simplistic corrections to adjust the parameters derived from satellite observations with in situ measurements.
4. Summary and conclusion
In this paper, three retrieval procedures have been compared, which are designed for the retrieval of cloud optical thickness, droplet effective radius, and LWP, in the case of a stratocumulus observed on 18 April 1994, during the EUCREX mission 206. The geographical region selected in this study is homogeneous over the southern part of the region and heterogeneous over the northern part. This case is thus well suited for the comparison between the various methods.
The main drawback of the APOLLO parameterizations set is that the uncertainty on the retrieved parameters is large. For the stratocumulus cloud situation analysed here, it is clear that better relationships should be derived from in situ measurements. The results obtained with the CRTVL algorithm based on a radiative transfer model are more general, but they rely upon the representativeness of the model.
Indeed, the ACNN and CRTVL methods give similar results for both cloud optical
Ž .
thickness and droplet effective radius or LWP . This is partly due to the fact that the same radiative transfer model is used to build the CRTVL look-up table and the ACNN learning database. In particular, there is no systematic bias in terms of cloud optical thickness and droplet effective radius. The discrepancy between the two approaches becomes significant at the smallest values of optical thickness and effective radius. This is due to an ambiguity in the inversion with the CRTVL technique, while the ACNN learning database has been built with non-ambiguous values, that are typical of the type of cloud analysed here.
( ) A. Fouilloux et al.rAtmospheric Research 55 2000 65–83
82
effective radius derived before averaging are greater than those derived from the averaged radiances.
Therefore, comparisons between aircraft measurements and satellite observations will
Ž .
not be valid if the cloud is heterogeneous which is the case for most of the clouds . This preliminary study suggests that the parameter H, which was used to characterize cloud homogeneity seems to be inadequate. An attempt has been made to introduce in situ data in the learning phase of the ACNN method. The result shows no systematic tendency for the droplet effective radius, while an under-estimation of the cloud optical thickness is found as a function of H.
In conclusion, it is suggested that the efficiency of the radiative transfer inversion
Ž .
technique CRTVL can be significantly improved by using neural networks, without loosing its capability to retrieve cloud parameters with a high accuracy. A neural network can also be progressively improved by introducing in situ measurements in its learning database, especially for solving the problem of heterogeneous clouds.
Acknowledgements
The authors are particularly thankful to T.Y. Nakajima and T. Nakajima for providing them with their CRTVL inversion scheme. This work was supported by a grant from the Direction des Recherches Etude et Technique no. 9334075 and was part of the EUCREX supported by the European Union, under Grant ENVV5V-CT94-0455.
References
Arking, A., Childs, J.D., 1985. Retrieval of cloud cover parameters from multispectral satellite images. J. Clim. Appl. Meteor. Soc. 69, 618–626.
Bankert, R.L., 1993. Cloud classification of AVHRR imagery in maritime regions using a probabilistic neural network. IEEE Trans. Geosci. Remote Sens. 33, 909–918.
Cotton, W.R., Anthes, R.A., 1989. Storm and Cloud Dynamics. Academic Press, San Diego, 883 pp. Curran, R.J., Wu, L.M.C., 1982. Skylab near-infrared observations of clouds indicating supercooled liquid
water droplets. J. Atmos. Sci. 39, 635–647.
Fouilloux, A., Iaquinta, J., 1998. Assessment of clouds characteristics from satellite observations by means of self-organized neuronal networks. Remote Sens. Environ. 66, 101–109.
Garand, L., 1988. Automated recognition of oceanic cloud patterns: Part I. Methodology and application to cloud climatology. J. Clim. 1, 20–39.
Haralick, R.M., 1979. Stastical and structural approaches to texture. Proc. IEEE 67, 786–804.
Iaquinta, J., Pinty, B., 1997. Radiation field in a multi-layered geophysical medium: the Ice–Water–Aerosol–
Ž .
VEgetation–Soil IWAVES model. J. Geophys. Res. 102, 13627–13642.
Kaestner, M., Kriebel, K.T., Meerkoetter, R., Renger, W., Ruppersberg, G.H., Wendling, P., 1993. Compari-son of cirrus height and optical depth derived from satellite and aircraft measurements. Mon. Weather.
Ž .
Rev. 121 10 , 2708–2717.
Kaufman, Y.J., Holben, B.N., 1993. Calibration of the AVHRR visible and near-infrared bands by atmospheric scattering, ocean glint and desert reflexion. Int. J. Remote Sens. 14, 21–52.
Kriebel, K.T., Saunders, R., Gesell, G., 1989. Optical properties of clouds derived from fully cloudy AVHRR pixels. Beitr. Phys. Atmos. 62, 165–171.
Nakajima, T., King, M.D., 1990. Determination of the optical thickness and effective particle radius of clouds from reflected solar radiation measurements: Part I. Theory. J. Atmos. Sci. 47, 1878–1893.
Nakajima, T.Y., Nakajima, T., 1995. Wide-area determination of cloud microphysical properties from NOAA-AVHRR measurements for FIRE and ASTEX regions. J. Atmos. Sci. 52, 4043–4059.
Nakajima, T.Y., Tanaka, M., 1986. Matrix formulation for the transfer of solar radiation in plane-parallel scattering atmosphere. J. Quant. Spectrosc. Radiat. Transfer 35, 13–21.
Parol, F., Buriez, J.C., Brogniez, G., Fouquart, Y., 1991. Information content of AVHRR channels 4 and 5 with respect to the effective radius of cirrus cloud particles. J. Appl. Meteorol. 30, 973–984.
Pawlowska, H., Brenguier, J.L., Burnet, F., 2000a. Microphysical properties of stratocumulus clouds. Atmos. Res., in press.
Pawlowska, H., Brenguier, J.L., Fouquart, Y., Armbruster, W., Descloitres, J., Fischer, J., Flamant, C., Fouilloux, A., Gayet, J.F., Ghosh, S., Jonas, P., Parol, F., Pelon, J., Schuller, L., 2000b. Microphysical and¨
radiative properties of stratocumulus cloud: the EUCREX mission 206 case study. Atmos. Res., in press. Rossow, W.B., 1989. Measuring cloud properties from space: a review. J. Clima. 2, 201–213.
Saunders, R.W., Kriebel, K.T., 1988. An improved method for detecting clear sky and cloudy radiances from AVHRR data. Int. J. Remote Sens. 9, 123–150.
Stephens, G.L., 1978. Radiation profiles in extended water clouds: II. Parameterization schemes. J. Atmos. Sci. 35, 2123–2132.
Stephens, G.L., Ackerman, S., Smith, E.A., 1984. A shortwave parameterization revised to improve cloud absorption. J. Atmos. Sci. 41, 687–690.
Unser, M., 1986. Sum and difference histograms for texture classification. IEEE Trans. Pattern Anal. Mach. Intell. PAMI-8, 118–125.

