Geriatric Depression
Te-Jen Lai, Martha E. Payne, Christopher E. Byrum,
David C. Steffens, and K. Ranga R. Krishnan
Background: Postmortem studies have documented
ab-normalities in the medial orbital frontal cortex in
de-pressed patients. In this study we evaluated whether
atrophy of this region can be identified in older depressed
patients using magnetic resonance imaging.
Methods: Twenty elderly patients meeting DSM-IV
crite-ria for major depression and 20 matched control subjects
were studied. The orbital frontal cortex was measured in
both hemispheres using magnetic resonance imaging.
Results: Depressive patients had reduced volume in the
total orbital frontal cortex, right orbital frontal cortex,
and left orbital frontal cortex.
Conclusions: Our finding of a reduction in orbital frontal
cortex volume in both sides of the brain suggests that this
region of the brain may have a critical role in the
development of depression and raises questions about the
etiology of the changes. Biol Psychiatry 2000;48:
971–975 © 2000 Society of Biological Psychiatry
Key Words: Depression, orbital frontal cortex,
neuroim-aging, circuit, neuroim-aging, neuropsychology
Introduction
O
ur group and others have described a putative
neuro-anatomic circuit for depression. The structures in this
circuit include the amygdala, basal ganglia, and prefrontal
cortex (Byrum et al 1999; Drevets 1999; Drevets et al
1999). A prior study by Coffey et al (1993) suggested that
prefrontal volume is reduced in depressed patients.
Dre-vets et al (1997) noted a reduction of regional cerebral
blood flow (rCBF) and metabolism and reduction of the
subgenual prefrontal cortical volume in familial forms of
depression but no loss of neurons (Drevets et al 1997;
Ongur et al 1998). In unmedicated subjects with primary
depression Baxter et al (1989), Drevets et al (1992,
1995b), and Ebert et al (1991) have noted increased rCBF
in the posterior orbital cortex. Metabolism and rCBF have
also been noted to increase in these areas during
experi-ments that induce sadness or anxiety in healthy subjects
(Drevets et al 1995a). Treatment appears to reduce rCBF
and metabolism in the euthymic phase relative to the
depressed phase in these patients in this region (Nobler et
al 1994). The relationship between depression severity and
metabolic activity in this region is complex in that severity
of depression appears to be inversely correlated with the
blood flow and metabolism in this region (Nobler et al
1994). In more ill patients, rCBF and metabolism have
been shown to be decreased rather than increased in these
regions of the brain (Mayberg et al 1990).
Anatomic changes of this region have also been
exam-ined in postmortem studies of the brain. In the medial
orbital prefrontal cortex and the dorsolateral prefrontal
cortex a reduction in cortical thickness and smaller sizes of
neuronal cell bodies were noted (Rajkowska et al 1999).
The greatest reduction was noted in layer 2. Glial density
was also reduced in the orbital frontal cortex (OFC;
Rajkowska et al 1999). Despite these multiple imaging and
postmortem studies, there is remarkably little literature
available on neuroanatomic changes in vivo in this part of
the prefrontal cortex.
In this study we evaluated the medial prefrontal cortex
in patients with depression from our clinical research
center and compared it with a group of control subjects.
We hypothesized that, compared with age-matched elderly
control subjects, older depressive patients would have
smaller volumes of the OFC.
Methods and Materials
Subjects
All subjects were participants in the National Institute of Mental Health (NIMH) Mental Health Clinical Research Center (MHCRC) for the Study of Depression in Later Life, located at Duke University. The MHCRC operates in a naturalistic treat-ment milieu and screens for both incident and prevalent cases. Inpatients and outpatients of the Duke University Psychiatric Service presenting with clinically significant depressive
symp-From the Department of Psychiatry and Behavioral Sciences, Duke University Medical Center, Durham, North Carolina.
Address reprint requests to K. Ranga R. Krishnan, M.D., Duke University Medical Center, Department of Psychiatry & Behavioral Sciences, Box 3950, Durham NC 27710.
Received May 9, 2000; revised August 7, 2000; accepted August 21, 2000.
© 2000 Society of Biological Psychiatry 0006-3223/00/$20.00
toms or a previous diagnosis of mood disorder were screened with the Center for Epidemiologic Studies Depression Scale (Radloff 1977). All enrolled subjects were 60 years or older. Exclusion criteria included 1) another major psychiatric illness, such as bipolar disorder, schizophrenia, and schizoaffective disorder; 2) active alcohol or drug dependence; 3) primary neurologic illness, such as dementia, stroke, Parkinson’s disease, seizure disorder, and multiple sclerosis; 4) medications or med-ical illness that may affect cognitive function; 5) physmed-ical disability that precludes cognitive testing; and 6) metal in the body that precludes magnetic resonance imaging (MRI). Patients were excluded if they had dementia or suspected dementia at baseline. Study geriatric psychiatrists clinically examined all subjects, performed a standardized neurologic examination, re-viewed medical records, and conferred with referring physicians for all patients. Although most MHCRC subjects have baseline Mini Mental State Examination (MMSE; Folstein et al 1975) scores above 25, some severely depressed patients have scores below 25. The MHCRC protocol is to observe such patients through an acute (8 week) phase of treatment to determine if cognition improves. Subjects whose MMSE scores remain below 25 are not observed longitudinally in the MHCRC. Thus, in the clinical judgment of study geriatric psychiatrists, dementia is effectively excluded at or close to baseline in all elderly depressed MHCRC subjects.
DSM-IV diagnoses were assigned to all subjects by a consen-sus diagnostic conference that included a board-certified or board-eligible psychiatrist, using procedures conforming to the Longitudinal, Expert, and Available Data standard (Spitzer 1983) and informed by screening data, the Duke Depression Evaluation Schedule (DDES), and the clinical data listed above (George et al 1989). All patients met DSM-IV criteria for major depression. The purpose of the MHCRC and its procedures were explained to each patient, and those who provided written informed consent were enrolled. At baseline, all enrolled subjects underwent an MRI scan of the brain, using standardized procedures. A trained interviewer administered the DDES to each subject. The DDES, a composite diagnostic interview instrument, includes sections of the NIMH Diagnostic Interview Schedule (Robins et al 1981) assessing depression, enriched with items assessing sleep prob-lems and the clinical features of melancholia and psychosis, dysthymia, mania, and alcohol abuse or dependence (Krishnan et al 1997). The DDES also includes the Montgomery–Asberg Depression Rating Scale (MADRS; Montgomery and Asberg 1979), the MMSE (Folstein et al 1975), the Global Assessment Scale (Endicott et al 1976), items assessing self-reported physical health, four subscales of the Duke Social Support Index (George et al 1989; Landerman et al 1989), and a scale assessing frequency and severity of stressful life events during the year preceding the interview (Landerman et al 1989).
Control subjects were recruited from the Aging Center Subject Registry at Duke University, which includes a listing of over 1900 community-dwelling elders in the Durham/Chapel Hill and Raleigh areas who have expressed a willingness to participate in Duke Aging Center research. Registry subjects may be selected by race, gender, age, and socioeconomic strata. Eligible control subjects had a nonfocal neurologic examination, no self-report of neurologic or depressive illness, no evidence of a depression
diagnosis based on the Diagnostic Interview Schedule portion of the DDES, and no other Axis I psychiatric disorders.
Subjects of this study were from the MHCRC, 20 cases and 20 control subjects matched on age at enrollment (within 5 years). The aims of this study were to compare the difference in volumes of the OFC between the depressed patients and healthy control subjects and to investigate the relationship of the volume of OFC and age of onset, MADRS, and MMSE.
Magnetic Resonance Imaging
MRI ACQUISITION. All subjects were screened for the presence of cardiac pacemakers, neurostimulators, metallic im-plants, metal in the orbit, aneurysm clips, or any other condition where MRI is contraindicated. Subjects were imaged with a 1.5-T whole-body MRI system (Signa, GE Medical Systems, Milwaukee) using the standard head (volumetric) radio fre-quency coil. Padding was used to immobilize the head without causing discomfort. The scanner alignment light was used to adjust the head tilt and rotation so that the axial plane lights passed across the canthomeatal line and the sagittal lights were aligned with the center of the nose. Reference standards consist-ing of water with added contrast agent to obtain T2values of
approximately 80 msec and 120 msec were included within the field of view on the left and right sides of the head. A rapid sagittal localizer scan was acquired to confirm the alignment.
HIGH-RESOLUTION IMAGING FOR VOLUME MEASURE-MENTS. A dual-echo fast spin echo acquisition was obtained in the axial plane for morphometry. The pulse sequence parameters were repetition time5 4000 msec, echo times 530 and 135 msec, 32-kHz imaging bandwidth, and echo train length 516, with a 256 3 256 matrix, 3-mm section thickness, and one excitation per phase-encoding increment, 20-cm field of view. Saturation of spins outside the imaging volume (standard gap 15 mm) was employed to minimize artifacts due to flowing blood and cerebrospinal fluid. The images were acquired in two separate acquisitions with a 3-mm gap between sections for each acquisition. The second acquisition was offset by 3 mm from the first so that the resulting data set consisted of contiguous sections.
MR Image Processing
The MR images were transferred to the Neuropsychiatric Imag-ing Research Laboratory (NIRL), located at Duke University Medical Center, for processing on SUN (Sun Microsystems, Palo Alto, CA) workstations. Dual-echo images, consisting of proton density– and T2-weighted images, were used for all processing.
Volume measurements were made using a NIRL-modified ver-sion of MrX Software, which was created by GE Corporate Research and Development (Schenectady, NY) and originally modified by Brigham and Women’s Hospital (Boston) for image segmentation.
Kikinis et al (1992) and has been described previously (Byrum et al 1996). Once the brain was segmented into tissue types and the nonbrain tissue stripped away through a masking procedure, specific regions of interest were assessed using tracing and connectivity functions. The cerebral hemispheres and orbitofron-tal gyri (OFG) were traced and a mask was created that could be applied to the segmented brain.
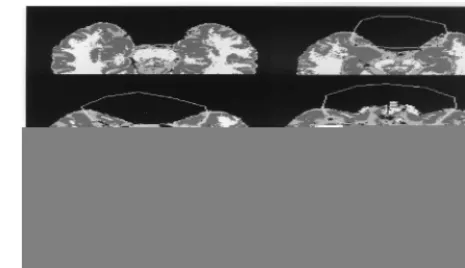
DEFINITION OF THE OFG. The following borders were
used for the OFG tissue (see Figure 1):
• Inferior border. Began with first appearance of frontal lobe
tissue as one moves superiorly from the base of the brain on consecutive axial slices. At the most inferior level, there is no connection between OFG and the rest of the brain, and all of the OFG tissue is included.
• Lateral and posterior borders. As one moves superiorly,
the limen insula (temporal stem) appears connecting OFG and temporal lobes. The posterior boundary of OFG was determined by the anterior appearance of the circular insular sulcus. If the cistern at the medial frontotemporal notch was 20 or more pixels across, then lines were drawn from the circular insular sulcus to the lateral end of the cistern on each hemisphere. If the cistern was less than 20 pixels across, then a line was drawn joining the circular insular sulci of each hemisphere. The entire lateral extent of the frontal lobe was included until the superior border was reached.
• Superior border. To determine the superiormost slice to
include in OFG, each hemisphere was assessed separately. If the cerebrosinal fluid of the olfactory sulcus plus the gray matter extending posteriorly from the sulcus was at least three fourths of the OFG length (anterior to posterior), OFG were included on that hemisphere.
CALCULATION OF VOLUMES. The final step was to run a summarizing program that calculated the volumes of each tissue type within each region. Volumes were determined for the whole brain, cerebral hemispheres, and OFG. Only OFG gray matter was included in the OFC volumes presented here.
TRAINING AND RELIABILITY. All technicians received extensive training by experienced volumetric analysts. Reliabil-ity was established by repeat measurements on multiple MR scans before raters were approved to process study data. Intra-class correlation coefficients were left cerebral hemisphere5
.99, right cerebral hemisphere 5 .99, left OFC 5 .96, right OFC5.90, and total OFC5.94.
Statistical Analyses
Two separate statistical analyses were conducted:
1. The mean total volume of the OFC, mean right volume of the OFC, mean left volume of the OFC, standardized total OFC (total OFC/total cerebral hemispheres), standardized right OFC (right OFC/total cerebral hemispheres), and
standardized left OFC (left OFC/total cerebral hemi-spheres) between the depressed and control groups using the general linear models (GLM) procedure of SAS Software (Cary, NC). Linear regression was used with GLM. Data are described as means6SDs.
2. In the patient group, Pearson correlation matrices were used to evaluate the relationship between the OFC and age of depression onset, MADRS score, and MMSE score.
Results
As shown in Table 1, the gender and race of the depressive
patients and healthy control subjects were not statistically
significantly different, except healthy control subjects
were, on average, about 5 years older at time of MRI.
Many depressive patients had long histories of depression,
with mean age of onset of depression about 45 years.
Depressed patients were, on average, moderately
de-pressed at baseline, as indicated by a mean MADRS score
of 23. The mean number of previous hospitalizations of
the depressive patients was 2.75, ranging from 0 to 6
times. Half of the patients had been thinking about suicide.
Four patients had history of psychotic depression. Fifteen
patients were taking antidepressants at time of enrollment.
One patient had depression for 1 month and 19 patients
had depression for between 6 and 12 months at enrollment.
Nine patients had onset of depression after the age of 50.
The range of previous depressive episodes was 0 to “20 or
more,” the latter reported in two cases.
Past history of alcohol or substance abuse or
depen-dence was ruled out in control subjects during enrollment.
One patient had past alcohol abuse, and one patient had
past alcohol dependence.
The mean score of MMSE in patients was 28.35
6
2.56.
The ranges of MMSE were from 20 to 30 at baseline.
Table 2 shows that depressive patients demonstrated
reduced volume compared with control subjects in total
OFC, right OFC, and left OFC. After adjustment to
percentage of total cerebral hemispheres (total OFC/total
cerebral hemispheres, right OFC/total cerebral
hemi-spheres, left OFC/total cerebral hemispheres), depressive
patients had significantly reduced volume in total OFC,
right OFC and left OFC, relative to control subjects. We
used linear regression to covary for age and gender. The
differences in total OFG, right OFG, left OFG, corrected
total OFG, corrected right OFG, and corrected left OFG
between cases and control subjects were still statistically
significant. No significant correlations were observed
between MADRS scores, MMSE scores, or age of onset,
and these volumes.
Discussion
Our main finding of a significant reduction in the OFC
brain volumes of patients as compared with control
sub-jects is consistent with the hypothesis that this region of
the brain is involved in depression. It is also quite
consistent with postmortem studies that demonstrate a
reduction in thickness and reduction in size of neurons,
neuronal cell bodies, and glial density in this region of the
brain (Rajkowska et al 1999).
The findings contribute to the growing evidence that the
orbital cortex is critically involved in affective disorders.
Previous rCBF and metabolic studies demonstrated
in-creased metabolism in milder patients and dein-creased
metabolism in more ill patients. Serotonin depletion
pro-duces rCBF changes and metabolic changes in these same
regions of the brain (Bremner et al 1997). It is also
consistent with Mayberg’s study reporting reductions in
orbital cortex metabolism in Parkinson’s patients with
depression relative to nondepressed Parkinson’s patients
(Mayberg et al 1990). Numerous studies have suggested
that the pyramidal cells of the orbital cortex play a role in
extinguishing unreinforced responses to appetitive stimuli
(Rolls 1995). This probably involves an interaction with
the amygdala and other limbic structures.
Neuropsycho-logic analysis of humans with orbital cortex lesions has
demonstrated impaired performance on tasks evaluating
emotional performance (Angrilli et al 1999). Subjects also
exhibited difficulty shifting intellectual strategies in
re-sponse to changing demands and perseveration. These
studies are concomitant and consistent with findings in
animal studies (Rolls et al 1994). Our study may be limited
by small sample size, although our significant finding is
noteworthy for such a relatively small sample. The mismatch
on age, though slight, was significant; however, the fact that
control subjects were older would likely bias against our
finding a significant difference, making our results even more
Table 1. Clinical and Demographic Characteristics of Depressive Patients and Healthy Control Subjects
Characteristics
Depressive patients (n520)
Control subjects (n520)
Age (years) 66.6565.65a 71.79 64.44a
Number of subjects 20 20
Male/Female 9/11 6/14
Race (African American/ Caucasian)
2/18 2/18
Age at onset of depression (years)
44.75618.03a —
Mean MADRS score 23.20610.76a —
Age, at the time of magnetic resonance imaging; MADRS, Montgomery– Asberg Depression Rating Scale.
aMean
6standard deviation
Table 2. Analysis of Orbital Frontal Cortex (OFC) in Depressive Patients and Healthy Controls
Regions
Depressive patients (n520)a
Control subjects
(n520)a F df p
Total OFC 12.1462.13 mL 14.1162.51 mL 7.13 1 .011 Right OFC 6.1561.13 mL 7.2661.23 mL 8.88 1 .005 Left OFC 5.9961.15 mL 6.8461.54 mL 3.96 1 .054 Standardized total OFCb 0.013
60.002 0.01660.003 4.22 3 .012 Standardized right OFCc 0.007
60.001 0.00860.001 5.07 3 .005 Standardized left OFCd 0.006
60.001 0.00860.002 2.95 3 .046
aValues are means
6SDs.
striking. This adds to the growing evidence that the
neuro-anatomic circuit involved in depression involves the medial
OFC besides the other structures implicated in the circuit—
namely, the amygdala, basal ganglia, and the thalamus.
Further research is needed to determine the relationship
between these changes and the pathogenesis of depression as
well as the mechanisms by which these changes could
predispose to depression.
This study was sponsored by National Institute of Mental Health Center Grant No. P30 MH40159.
The authors thank Denise L. Fetzer, M.A., and Douglas R. McQuoid, B.S., for their expert technical assistance.
References
Angrilli A, Palomba D, Cantagallo A, Maietti A, Stegagno L (1999): Emotional impairment after right orbitofrontal lesion in a patient without cognitive deficits. Neuroreport 10:1741–1746. Baxter LR, Schwartz JM, Phelps ME, Mazziota JC, Guze BH, Selin CE, et al (1989): Reduction of prefrontal cortex glucose metabolism common to three types of depression. Arch Gen
Psychiatry 46:243–250.
Bremner JD, Innis RB, Salomon RM, Staib LH, Ng CK, Miller HL, et al (1997): Positron emission tomography measurement of cerebral metabolic correlates of tryptophan depletion-induced depressive relapse. Arch Gen Psychiatry 54:346 –374. Byrum CE, Ahearn EP, Krishnan KR (1999): A neuroanatomic
model for depression. Prog Neuropsychopharmacol Biol
Psychiatry 23:175–193.
Byrum CE, MacFall JR, Charles HC, Chitilla VR, Boyko OB, Upchurch L, et al (1996): Accuracy and reproducibility of brain and tissue volumes using a magnetic resonance segmen-tation method. Psychiatr Res 67:215–234.
Coffey CE, Wilkinson WE, Weiner RD, Ritchie JC, Aque M (1993): The dexamethasone suppression test and quantitative cerebral anatomy in depression. Biol Psychiatry 33:442– 449. Drevets WC (1999): Prefrontal cortical-amygdalar metabolism in
major depression. Ann N Y Acad Sci 877:614 – 637. Drevets WC, Gadde K, Krishnan R (1999): Neuroimaging
studies of depression. In: Charney EJ, Nestler BJ, Bunney, editors. Neurobiology of Mental Illness. New York: Oxford University Press, 394 – 418.
Drevets WC, Price JL, Simpson JR, Todd RD, Reich T, Vannier M, et al (1997): Subgenual prefrontal cortex abnormalities in mood disorders. Nature 386:824 – 827.
Drevets WC, Simpson JR, Raichle ME (1995a): Regional blood flow changes in response to phobic anxiety and habituation.
J Cereb Blood Flow Metab 15:S856.
Drevets WC, Spitznagel E, Raichle ME (1995b): Functional anatomical differences between major depressive subtypes.
J Cereb Blood Flow Metab 15:S93.
Drevets WC, Videen TO, Price JL, Preskorn SH, Carmichael ST, Taichle ME (1992): A functional anatomical study of unipo-lar depression. J Neurosci 12:3628 –3641.
Ebert D, Feistel H, Barocka A (1991): Effects of sleep depriva-tion on the limbic system and the frontal lobes in affective disorders: A study with Tc-99 m-MHPAO SPECT. Psychiatr
Res Neuroimaging 40:247–251.
Endicott J, Spitzer RL, Fleiss JL, Cohen J (1976): The Global Assessment Scale: A procedure for measuring overall severity of psychiatric disturbance. Arch Gen Psychiatry 33:766 –771. Folstein MF, Folstein SE, McHugh PR (1975): “Mini-Mental
State”: A practical method for grading the cognitive state of patients for the clinician. J Psychiatr Res 12:189 –198. George LK, Blazer DG, Hughes DC, Fowler N (1989): Social
support and the outcome of major depression. Br J Psychiatry 154:478 – 485.
Kikinis R, Shenton ME, Gerig G, Martin J, Anderson M, Metcalf D, et al (1992): Routine quantitative analysis of brain and cerebrospinal fluid spaces with MR imaging. J Magn Reson
Imaging 2:619 – 629.
Krishnan KR, Hays JC, Blazer DG (1997): MRI-defined vascular depression. Am J Psychiatry 154:497–501.
Landerman R, George LK, Campbell RT, Blazer DG (1989): Alternative models of the stress buffering hypothesis. Am J
Community Psychol 17:625– 642.
Mayberg HS, Starkstein SE, Sadzot B, Preziosi T, Andrezejew-ski PL, Dannal RF, et al (1990): Selective hypometabolism in the inferior frontal lobe in depressed patients with Parkin-son’s disease. Ann Neurol 28:57– 64.
Montgomery SA, Asberg M (1979): A new depression scale designed to be sensitive to change. Br J Psychiatry 134:382–389. Nobler MS, Sackeim HA, Prohovnik I, Moeller JR, Mukherjee S,
Schnur DB, et al (1994): Regional cerebral BF in mood disorders, III. Treatment and clinical response. Arch Gen
Psychiatry 51:884 – 897.
Ongur D, Drevets WC, Price JL (1998): Glial reduction in the subgenual prefrontal cortex in mood disorders. Proc Natl
Acad Sci U S A 95:13290 –13295.
Radloff LS (1977): The CES-D scale: A self-report depression scale for research in the general population. Appl Psychol
Meas 1:385– 401.
Rajkowska G, Miguel-Hidalgo JJ, Wei J, Dilley G, Pittman SD, Meltzer HY, et al (1999): Morphometric evidence for neuro-nal and glial prefrontal cell pathology in major depression.
Biol Psychiatry 45:1085–1098.
Robins LN, Helzer JE, Croughan J, Ratcliff KS (1981): National Institute of Mental Health Diagnostic Interview Schedule: Its history, characteristics, and validity. Arch Gen Psychiatry 38:381–389.
Rolls ET (1995): A theory of emotion and consciousness, and its application to understanding the neural basis of emotion. In: Gazzaniga MS, editor. The Cognitive Neurosciences. Cam-bridge, MA: MIT Press, 1091–1106.
Rolls ET, Hornak J, Wade D, McGrath J (1994): Emotion-related learning in patients with social and emotional changes asso-ciated with frontal lobe damage. J Neurol Neurosurg
Psychi-atry 57:1518 –1524.