www.elsevier.com / locate / bres
Research report
Probenecid-inhibitable efflux transport of valproic acid in the brain
parenchymal cells of rabbits: a microdialysis study
a b b c c ,
*
Jamie L. Scism , Karen M. Powers , Alan A. Artru , Lydia Lewis , Danny D. Shen
a
Eli Lilly& Company, Department of Drug Disposition, Lilly Corporate Center, Indianapolis, IN 46285, USA
b
Department of Anesthesiology, School of Medicine, University of Washington, Seattle, WA 98195, USA
c
Department of Pharmaceutics, School of Pharmacy, Box 357630, University of Washington, Seattle, WA 98195, USA
Accepted 22 August 2000
Abstract
Delivery of valproic acid (VPA) to the human brain is relatively inefficient as reflected by a low brain-to-unbound plasma concentration ratio (#0.5) at steady state. Previous pharmacokinetic studies suggested that the unfavorable brain-to-plasma gradient is maintained by coupled efflux transport processes at both the brain parenchymal cells and blood–brain barrier (BBB); one or both of the efflux transporters are inhibitable by probenecid. The present study in rabbits utilized microdialysis to measure drug concentration in the brain extracellular fluid (ECF) of the cerebral cortex during steady-state i.v. infusion with VPA alone or with VPA plus probenecid. Probenecid co-infusion elevated VPA concentration in the brain tissue surrounding the tip of the microdialysis probe to a greater extent than in the ECF (230% versus 47%). Brain intracellular compartment (ICC) concentration was estimated. In control rabbits, the ICC concentration was 2.860.28 times higher than the ECF concentration. Probenecid co-infusion elevated the ICC-to-ECF concentration ratio to 4.260.44, which confirms the existence of an efflux transport system in brain parenchymal cells. The ECF-to-unbound plasma concentration ratio was well below unity (0.029), indicating an uphill efflux transport of VPA across the BBB. Co-infusion of probenecid did not have a significant effect on VPA efflux at the BBB as evidenced by a minimal change in the ECF-to-unbound plasma concentration ratio. This study suggests the presence of distinctly different organic anion transporters for the efflux of VPA at the parenchymal cells and capillary endothelium in the brain. 2000 Elsevier Science B.V. All rights reserved.
Theme: Disorders of the nervous system
Topic: Epilepsy: anticonvulsant drugs
Keywords: Valproic acid; Efflux transport; Organic anion transporter; Blood–brain barrier; Brain parenchyma
1. Introduction brain-to-plasma concentration ratio of VPA is due to avid efflux transport of VPA from the central nervous system Valproic acid (VPA), a branched medium-chain fatty (CNS) [1,6].
acid, is widely used in the treatment of epilepsy and Adkison et al. [1] investigated the brain clearance of several psychiatric disorders such as manic depression and VPA through simultaneous ventriculocisternal perfusion of panic disorder. Studies in epilepsy patients undergoing radiolabeled VPA and i.v. infusion of VPA in rabbits. brain surgery or lumbar spinal tap have revealed that VPA Co-infusion of probenecid, an organic anion transport concentration in the brain cortex or cerebrospinal fluid inhibitor, was used to probe the presence of transport (CSF) is only 1 / 10th that of total or free plasma con- processes. Extraction of radiotracer during transit through centration [17,29,31,33]. Poor distribution of VPA to the the ventricular space was not affected by probenecid co-brain has also been observed in several animal species treatment. Probenecid co-infusion did elevate the con-[11,12,14,16,21,28]. Evidence to date suggests that the low centration of VPA in the brain tissue by almost twofold compared to control animals. Similar effects were ob-served in a later study with the unsaturated metabolite of *Corresponding author. Tel.: 11-206-685-2920; fax: 11-206-543- 2
VPA, E-D-VPA [26]. These results led to an initial 3835.
2
E-mail address: [email protected] (D.D. Shen). conclusion that removal of VPA or E-D-VPA from the
CNS occurs via a probenecid-sensitive efflux transport at 2. Materials and methods
the BBB, and does not involve organic anion transport at
the choroid plexus. However, further analysis of the data 2.1. Animals suggested a more complex scenario [26]. A critical
ob-servation relates to a lower effect of probenecid on the This study was approved by the University of Washing-2
steady-state concentration of VPA or E-D-VPA in the ton Animal Care Committee. Ten male New Zealand white perfusate outflow at the cisterna magna relative to that in rabbits (weight range 3.1–4.1 kg) were randomly assigned the brain tissue; i.e. an elevation in the brain-to-cisternal to two study groups designated as either the control group concentration ratio. An equivalent percentage increase in (n55) or the probenecid treatment group (n55).
cisternal concentration, i.e. no change in brain-to-cisternal 2
ratio, is expected if the exchange of VPA or E-D-VPA 2.2. Chemicals between the intracellular compartment (ICC) and the brain
extracellular fluid (ECF) occurs strictly via passive diffu- VPA, probenecid, and Trypan Blue were purchased from 3
sion, and if ventricular fluid drug concentration is reflec- Sigma Co. (St. Louis, MO). [ H]VPA was purchased from tive of ECF drug concentration. Compartmental modeling Moravek Biochemicals (Brea, CA).
suggested that the change in brain-to-cisternal gradient
could be explained by blockade of probenecid-sensitive 2.3. Surgical preparation 2
efflux transport of VPA or E-D-VPA at both the BBB and 1
the parenchymal cells. In other words, the putative Each rabbit was anesthetized with halothane (0.8–1.2% transport systems at the brain parenchymal cell membrane inspired) and nitrous oxide (66% inspired) in oxygen and and BBB act in concert to remove VPA and its 2-unsatu- mechanically ventilated via a small animal respirator rated analog from the brain. (Harvard Apparatus, Dover, MA) through a tracheotomy Multiple anticonvulsant mechanisms have been pro- tube. Expired CO was monitored by a Novametrix model2 posed for VPA, and can be broadly divided into actions at 1250 Capnogard end-tidal monitor (Wallingford, CT) and the intracellular sites versus actions at the neuronal mem- maintained within the normal range of 3265 mmHg [30]. brane or the extracellular site. A long-standing hypothesis With the animal in the supine position, the left and right for valproate’s antiepileptic effect is its ability to increase femoral veins were exposed and cannulated for the sepa-inhibitory GABAergic neurotransmission in critical regions rate infusion of VPA and probenecid. An ear vein was of the brain, mainly as a result of increase in GABA cannulated for the administration of the muscle relaxant, biosynthesis or inhibition of GABA catabolism (see review pancuronium (0.5 mg / h). A femoral artery was cannulated [15]). It has also been proposed that VPA limits the to allow blood sampling for drug assay and blood gas and bursting activity of neurons, most likely by interfering with pH determinations. The femoral artery cannula was also
1
use- and voltage-dependent Na channels (see review [8]). used to determine arterial blood pressure and heart rate. Hence, the existence of an intracellular-to-extracellular The electrocardiogram was monitored using needle elec-gradient within the brain parenchyma is important with trodes inserted bilaterally at the shoulder and thighs. Rectal respect to which of the proposed anticonvulsant mecha- temperature was monitored by a thermistor probe and nisms of VPA is more likely to operate in vivo. maintained at 37.5–38.58C by a servo-controlled heat There have been two reports of studies attempting to lamp. Gold cup electrodes were placed over the right measure brain ECF concentration of VPA in rats following frontal and parietooccipital cortices to monitor the elec-i.v. injection or rapid infusion of VPA: one by mi- troencephalogram (EEG) using a Lifescan Brain Activity crodialysis [34] and the other by VPA-selective microelec- System (Diatek Corp., San Diego, CA) with a band pass of trode [19]. In the present study, we applied intracerebral 0.5–29.9 Hz. This system used aperiodic analysis to microdialysis to measure the steady-state ECF concen- convert the analog EEG signal into a set of digital tration achieved during continuous i.v. infusion of VPA in parameters [10]. Computer (Zenith Data Systems, Glen-rabbits. Brain tissue surrounding the dialysis probe was view, IL) analysis of the EEG was performed using a sampled and assayed for VPA content, which allowed an Lifescan Research System program. For each 60-s interval, estimate of ICC concentration. In an effort to pinpoint the the following values were determined: the power (calcu-locations of the putative VPA transporter(s), we examined lated as amplitude squared) and number of waves in each the effect of probenecid co-infusion on the steady-state of the standard frequency bins (delta, 0.5–3.0 Hz, alpha, concentration gradient of VPA between the brain ECF and 8–12 Hz, and beta, 12–30 Hz), total hemispheric power, plasma water (i.e. across the BBB), and between the ICC and the activity edge (the frequency below which 95% of and the ECF within the brain parenchyma (i.e. across the the hemispheric activity was present). The EEG was parenchymal cell membrane). monitored to insure adequate anesthesia during the ex-perimental procedure. It also allowed a measure of the
1 neuropharmacological effects of VPA against VPA plus
Parenchymal cells refer to the cell types present in the brain parenchyma
The animal was turned to the prone position and its head target concentration of 60 mg / ml. The probenecid treat-was affixed to a stereotaxic frame. A midline scalpal ment group received the same VPA loading dose and incision was made and the scalp and muscle tissue constant rate infusion as the control group, along with an reflected. A burr hole was drilled in the skull at 8 mm i.v. loading dose (60 mg / kg over 1 min) and a constant anterior and 2 mm lateral to the intersection of the sagittal rate i.v. infusion (1 mg / min / kg) of probenecid. This and coronal sutures to allow placement of the mi- probenecid dose was twice the dose used in our earlier crodialysis probe in the cerebral cortex of the frontal lobe. studies [1] to ensure a significant increase ($2-fold) in A nick was made in the dura using the tip of a 20 g needle. brain VPA concentration.
With the aid of a stereotaxic device, the microdialysis Dialysate samples were collected at 10-min intervals for probe (CMA / 12, 3 mm length, 0.5 mm outer diameter, 100 min after initiation of drug infusion for the analysis of Bioanalytical Systems, West Lafayette, IN) was placed unlabeled VPA. Beginning at 100 min, after steady state over the burr hole and was lowered until the tip of the had been attained, dialysate samples were collected at probe made contact with the surface of the brain (any 20-min intervals for six collection periods. Alternating accumulated CSF and / or blood was removed from the burr 20-min collections of dialysate were analyzed for either
3
hole using the tip of a cotton swab prior to lowering the unlabeled VPA or [ H]VPA. Arterial blood samples (1 ml) probe into the hole). Upon contact with the brain surface, were taken at 15, 25, 35, 45, and 60 min and analyzed for the probe was slowly advanced into the brain tissue until plasma concentration of unlabeled VPA. Beginning at 90 the entire surface of the probe membrane was surrounded min, the volume of each arterial blood sample was by brain tissue. The distance of probe insertion from the increased to 3 ml to allow for plasma protein binding brain surface was between 3.5 and 3.7 mm. determination as well as analysis of unlabeled VPA. Blood samples of 3 ml were collected at 90, 110, 130, 170, 190,
2.4. Microdialysis and 210 min.
At 240 min after i.v. infusion of VPA or combined i.v. The dialysate, which consisted of a degassed solution of infusion of VPA and probenecid, the probe was removed 3
[ H]VPA (1400 dpm /ml) and Trypan Blue (0.04%) in from the brain. The halothane inhalation concentration was physiologic buffer (145 mM NaCl, 0.6 mM KCl, 2.0 mM increased to 3.0%. The skin and subcutaneous tissue were K HPO , 1.2 mM CaCl , and 1.0 mM MgCl , pH 7.4) [7],2 4 2 2 removed to expose the top part of the skull. Saturated KCl was loaded into a 1-ml gas-tight glass syringe. Re- was administered i.v. to euthanize the animal. An arterial
3
trodialysis with [ H]VPA allowed the determination of blood sample was taken just before the injection of dialytic recovery of VPA (see Section 2.7). Trypan Blue saturated KCl (i.e. a 240-min sample). A craniectomy was was added to the dialysate to aid in visualizing the performed to expose the brain. The entire brain was complete insertion of the probe membrane into brain removed from the cranium as quickly as possible (usually tissue, to verify proper dialysate flow, and for marking the within 5 min), and rinsed with ice-cold saline. The Trypan probe implantation site after probe removal. A Harvard Blue-marked tissue surrounding the probe implantation site syringe pump was used to pump the dialysate through 87 was dissected out, divided into three portions of|120 mg cm of fluoroethylene polymer (FEP) inlet tubing (i.d. 0.12 each, and immediately frozen on dry ice pending analysis mm) (Bioanalytical Systems) at an elevated flow rate until of unlabeled VPA.
the entire tube was cleared of any air bubbles. The flow
rate was slowed to 30 ml / min and the inlet tubing was 2.5. In vitro dialysis experiments connected by a tube connector (Bioanalytical Systems) to
the microdialysis probe, which had been prepared for use After removal from the rabbit brain, the microdialysis by soaking for 10 min in 70% ethanol and subsequently probe was placed in a beaker containing 3mg / ml of VPA rinsed in physiological buffer. After flushing the probe in 378C dialysate buffer for the purpose of determining the
3
with the dialysate, |22 cm of outlet FEP tubing was relative recovery of VPA and the loss of [ H]VPA in vitro. connected to the probe. The dialysate was continuously Dialysate was continuously pumped through the probe at 1 perfused through the probe at 30 ml / min until all air ml / min. The probe was allowed to equilibrate in the VPA bubbles had been cleared from both the tubing and the solution for 50 min prior to collection of dialysate samples. probe. The dialysate flow rate was then reduced to 1 Dialysate samples were collected over 20-min intervals for ml / min and the probe was lowered into the brain. six collection periods and were analyzed alternately for
3
The experiment began 45 min after the probe was VPA or [ H]VPA. The in vitro loss and recovery de-inserted into the brain. At 10 min prior to the start of the termination was conducted to verify normal probe func-experiment, a baseline arterial blood sample was drawn (5 tion.
ml). At the start of the study, the control group received an
i.v. loading dose (7.5 mg / kg over 1 min) of VPA followed 2.6. Drug analysis immediately by a constant rate i.v. infusion (125mg / min /
determined by ultrafiltration at 388C using Centrifree The operating assumption is that the fraction of the marker ultrafiltration devices (Amicon, Beverley, MA). The con- molecule lost from the dialysate, as it is perfused through centration of VPA in plasma and brain samples was the probe, is equivalent to the fraction of the analyte analyzed by a capillary gas chromatographic assay de- recovered from the tissue surrounding the probe. The scribed by Semmes and Shen [27]. A more sensitive assay, concentration of VPA in the ECF was calculated using the utilizing mass spectrometry, was performed for the mea- following equation:
surement of subnanogram per ml VPA concentrations in
DC
dialysate samples. The dialysate assay used was a modified ECF5] (1)
FL version of the assay previously described by Rettenmeier
et al. [25]. Briefly, 10 ml of 1-methyl-1-cyclohexane where DC is the concentration of unlabeled VPA found in 3
carboxylic acid (MCCA) were added as the internal the dialysate sample and FL is the fraction of [ H]VPA lost standard to each sample. Extraction of VPA and MCCA from the dialysate. The ICC VPA concentration was from the dialysate was accomplished by acidifying the estimated using Eq. (2):
sample with 500 ml of 1 N HCl, adding 3 ml of
Br2fe3ECF chloroform, and shaking for 15 min. The organic phase
]]]]
ICC5 (2)
containing the VPA and MCCA was then dried over (12fe) anhydrous magnesium sulfate powder and evaporated to
where Br is the concentration of VPA found in the brain |50 ml under dry nitrogen. The VPA and MCCA were
tissue samples and fe is the fractional volume of ECF in converted to trimethylsilyl (TMS) derivatives by adding 40
cortical brain tissue, which has been determined to be ml of bis(trimethylsilyl)trifluoroacetamide (BSTFA) and
|0.18 [5]. heating to 658C for|40 min. The derivatized samples were
Brain tissue-to-plasma concentration ratios of VPA were then diluted to |100ml with chloroform and analyzed by
computed using the average total or free plasma con-gas chromatography / mass spectrometry (GC / MS).
centration of unlabeled VPA at steady state. The steady-Quantitative GC / MS analyses of VPA-TMS and
state plasma concentration in each rabbit was computed by MCCA-TMS derivatives were performed on a Carlo Erba
averaging concentrations of samples taken from 90 min 8000 gas chromatograph (Fisons Instruments, Manchester,
through 210 min. The mean steady-state dialysate and ECF UK) interfaced to a VG MD 800 Quadrupole mass
values were computed by averaging dialysate samples and spectrometer (VG BioTech, Cheshire, UK) using a fused
the corresponding ECF values from 90 min through 240 silica capillary column (60 m30.32 mm ID30.25mm film
min, respectively. The steady-state ICC concentration of thickness) coated with a DB-1 stationary phase (J&W
VPA for each rabbit was calculated using the mean ECF Scientific, Folsom, CA). The temperature of the ion source
concentration and concentration of the brain tissue sur-was 2008C. The temperatures at the injector and the GC
rounding the dialysis probe sampled at the termination of interface were held at 2508C. Helium was used as the
the experiment. carrier gas, at a head pressure of 15 psi. The initial oven
All data are expressed as means6S.E. Data at serial temperature was 408C. After 1 min, the temperature was
time points from the control and probenecid treatment raised rapidly to 808C. The temperature was then raised
groups were analyzed by repeated measure ANOVA, from 80 to 1208C at 28/ min, followed by a 408/ min
followed by post-hoc paired-wise comparisons. Statistical gradient to 2508C. Molecular ions with mass-to-charge
significance was defined as P#0.05. ratios of 201 and 199 were monitored that corresponded,
respectively, to VPA and MCCA. Under these chromato-graphic conditions, VPA-TMS and MCCA-TMS eluted at
|15.7 min and 16.7 min, respectively. The concentration 3. Results of VPA in samples was determined by comparing
VPA-to-internal standard peak area ratios with standard curves, 3.1. Physiologic data which were generated from the extracts of VPA standards.
3
Radioactivity of [ H]VPA in dialysate samples was Table 1 compares the results of the physiologic data assayed by liquid scintillation counting using a TriCarb collected from the control and probenecid-treatment 2000CA (Packard Instrument, Downers Grove, IL). groups. Between-group comparisons indicated that there were no significant differences in any of the physiological
2.7. Data analysis parameters monitored. Within-group comparisons indicated
a time-related decrease of blood pH and bicarbonate The method of retrodialysis was used to determine concentration in the probenecid group. Post hoc paired-relative recovery of each probe. This method typically wise comparisons of the data within the probenecid group includes, in the perfusing dialysate, either a marker mole- indicated that only the mean pH at 220 min decreased cule of similar molecular weight and structure to that of significantly from baseline value.
Table 1
a
Comparison of physiologic parameters between the control and probenecid treatment groups (n55 in each)
Group / time Mean arterial Heart rate PaO2 PaCO2 pH Arterial Rectal
blood pressure (beats / min) (mmHg) (mmHg) bicarbonate conc. temperature
(mmHg) (mEq / l)
Control
Baseline 7465 280615 18063 3161 7.3960.02 18.761.0 38.160.2
60 min 7765 267610 18165 3362 7.3760.02 19.061.4 38.160.1
110 min 7364 27169 18064 3161 7.3860.02 17.960.7 38.060.1
170 min 7763 26267 18165 3261 7.3660.01 17.861.0 38.160.1
220 min 7863 27466 18165 2961 7.3760.01 16.760.6 38.160.1
Probenecid
b b
Baseline 7762 287616 17964 3262 7.4360.01 20.861.4 37.460.4
b b
60 min 8465 294612 18162 3262 7.3860.02 18.360.9 37.560.3
b b
110 min 8064 300611 18463 3361 7.3260.02 16.861.0 37.760.3
b b
170 min 7763 290616 18163 3162 7.3060.02 15.160.9 37.660.3
b,c b
220 min 6763 31265 18162 2962 7.2660.03 13.060.7 37.760.3
a
Values represent mean6S.E.
b
Significant variation with respect to time, P,0.001.
c
Significantly different from baseline mean value, P,0.05.
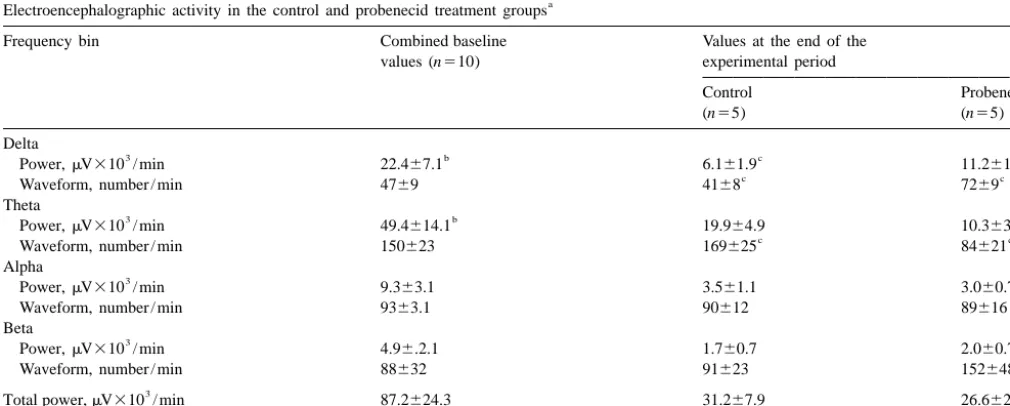
value in the control group was not different from that in representative control rabbit. Plasma VPA concentration the PBD group; therefore, they were combined for the reached steady state within the first 25 min of the study purpose of statistical analysis. Administration of VPA or and remained constant through 240 min. Cerebral dialysate VPA plus probenecid decreased power in the delta and VPA concentration reached steady state by 50 min, and theta frequency bins at the end of the study as compared to remained relatively constant throughout the study. baseline values. Moreover, probenecid co-infusion
in-creased power and number of delta waveforms, and 3.3. Microdialysis probes decreased number of theta waveforms in comparison to
3
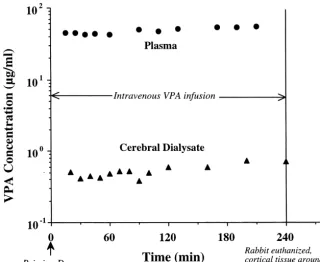
values in the control group. The mean fractional loss of [ H]VPA during
re-trodialysis in vivo was 0.2860.014 for the control group 3.2. VPA pharmacokinetics and 0.2660.014 for the probenecid treatment group (data not shown). The two mean values do not differ sig-Fig. 1 illustrates the concentration–time profile of VPA nificantly, indicating that the probes used in each group in the plasma and dialysate during VPA infusion for one had comparable dialytic characteristics.
Table 2
a
Electroencephalographic activity in the control and probenecid treatment groups
Frequency bin Combined baseline Values at the end of the
values (n510) experimental period
Control Probenecid
(n55) (n55)
Delta
3 b c c
Power,mV310 / min 22.467.1 6.161.9 11.261.3
c c
Waveform, number / min 4769 4168 7269
Theta
3 b
Power,mV310 / min 49.4614.1 19.964.9 10.363.7
c c
Waveform, number / min 150623 169625 84621
Alpha
3
Power,mV310 / min 9.363.1 3.561.1 3.060.7
Waveform, number / min 9363.1 90612 89616
Beta
3
Power,mV310 / min 4.96.2.1 1.760.7 2.060.7
Waveform, number / min 88632 91623 152648
3
Total power,mV310 / min 87.2624.3 31.267.9 26.662.9
Fig. 1. Typical time course of VPA concentration in the plasma and cerebral dialysate during a cerebral cortex microdialysis experiment in a control rabbit. At time zero, an i.v. priming dose (7.5 mg / kg) was administered and immediately followed by a constant rate infusion (125mg / kg / min) that was maintained throughout the experiment. The respective mean6S.E. of steady-state plasma and dialysate concentration (from 90 min to the end of the study) was 52.862.9mg / ml and 0.5960.06mg / ml.
The relative recovery of VPA in vitro was 0.4160.04 for steady-state VPA concentration was 63.666.1 mg / ml, probes used in control animals, and was not significantly which was not significantly different from that in the different from the relative recovery for probes used in control group. Determination of the plasma protein binding probenecid-treated animals (0.3860.03). Our fractions of of VPA for both groups showed that the unbound fraction VPA recovery in vitro are comparable to the in vitro VPA of VPA in the plasma was not significantly different value reported by Golden et al. [9] using microdialysis between control and probenecid treatment groups, probes of similar construction to those used in this study. 0.1960.03 versus 0.2360.02. The mean steady-state
con-3
The loss of [ H]VPA in vitro was 0.4660.04 for probes centration of unbound VPA in the plasma was calculated to used in control animals, which was not significantly be 11.362.2 mg / ml for control animals and 14.962.3 different from the value for probes used in probenecid- mg / ml for probenecid-treated animals. The difference treated animals (0.4260.01). The in vitro relative recovery between the group means was not statistically significant. value for VPA was not statistically different from the in The mean steady-state tissue concentration of VPA at the
3
vitro loss of [ H]VPA. This was in keeping with the probe site was lower than in plasma in both groups of operating assumption of retrodialysis, i.e. the fractional animals. Co-treatment with probenecid resulted in a greater loss of tracer molecule is equivalent to the fractional than twofold increase in brain tissue VPA concentration,
3
recovery of analyte. The relative loss of [ H]VPA in vivo from 4.1560.24 mg / g to 9.3461.37 mg / g. Steady-state was|60% of the in vitro loss, most likely due to restricted
Table 3
diffusion of VPA in tissue as compared to water; this is Comparison of steady-state VPA concentrations in plasma, dialysate, and a commonly observed in microdialysis [23]. brain tissue between control and probenecid treatment groups
Control Probenecid
3.4. Plasma, brain, and dialysate distribution of VPA (n55) (n55)
Plasma (mg / ml) 60.463.5 63.666.1
A comparison of the mean steady-state concentrations of Free fraction 0.1960.03 0.2360.02 VPA in plasma, dialysate, and brain tissue between the Free plasma (mg / ml) 11.362.2 14.962.3
b control and probenecid treatment groups is presented in Brain tissue (mg / g) 4.1560.24 9.3461.37
b
Dialysate (mg / ml) 0.4960.04 0.7260.07 Table 3. An average steady-state plasma VPA
concen-a
tration of 60.463.5 mg / ml was reached in the control Values represent mean6S.E.
b
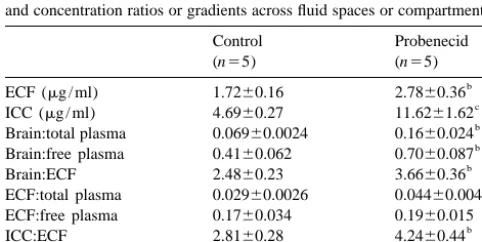
VPA concentration in the dialysate was much lower calculated and was found to be somewhat higher for compared to either plasma or brain tissue in control probenecid-treated animals (0.04460.0048) than for con-animals (0.4960.04mg / ml), and increased significantly by trol animals (0.02960.0026). However, when plasma probenecid treatment (0.7260.07 mg / ml). protein binding was taken into account, difference in the mean ECF-to-free plasma VPA concentration ratio between 3.5. Estimated ECF and ICC VPA concentrations the control group (0.1760.034) and the probenecid group
(0.1960.015) was no longer statistically significant. The estimated mean steady-state concentrations of VPA The ICC-to-ECF VPA concentration ratio was calculated in the ECF and the ICC in the control and probenecid to examine the VPA concentration gradient between the groups are shown in Table 4. The ECF VPA concentration, brain ECF and ICC. On average, the control animals had calculated directly from the dialysate VPA concentration, an ICC VPA concentration that was 2.8160.28 times was 1.7260.16 mg / ml for control animals, and was higher than the extracellular VPA concentration. Treatment significantly higher in the probenecid-treated animals, at with probenecid increased this ratio to 4.2460.44. 2.7860.36 mg / ml. The mean estimated ICC VPA con- The ICC-to-free plasma VPA concentration ratio, which centration for control animals was 4.6960.27 mg / ml, serves as an index of intracellular delivery, was computed which was almost threefold higher relative to the ECF to gain an appreciation of the overall effect of sequential VPA concentration. Treatment with probenecid signifi- exchange processes at both the parenchymal cell mem-cantly increased the mean ICC VPA concentration to brane and the BBB. The ICC-to-free plasma VPA
con-11.661.6 mg / ml. centration ratio was 0.4660.068 for control animals and
Mean concentration ratios of brain tissue-to-plasma, was significantly increased by probenecid treatment to brain tissue-to-ECF, ECF-to-plasma, ICC-to-plasma, and 0.8160.10.
ICC-to-ECF are also presented in Table 4. The mean ratio of VPA concentration in the cerebral cortical to that in total
plasma was well below unity for both the control group 4. Discussion
(0.06960.0024) and the probenecid group (0.1660.024).
The difference in the mean ratios between the two groups Microdialysis was used to measure the effects of pro-was statistically significant. When corrected for plasma benecid on freely diffusible VPA concentration in the brain protein binding, the brain tissue-to-free plasma VPA con- ECF of anesthetized rabbits under steady-state condition. centration ratio was still below unity for control animals, at Coupled with assay of drug concentration in brain tissue 0.4160.062, and increased by nearly twofold to surrounding the probe site, this technique affords an 0.7060.087 upon treatment with probenecid. The tissue- estimate of the ICC concentration of VPA and provides an to-ECF VPA concentration ratio indicated that brain tissue, indirect means of studying the compartmentalization of when assayed as a homogenate, had a VPA concentration drugs within the brain parenchyma.
that was 2.4860.23 times higher than the VPA concen- The increase in brain concentration of VPA concen-tration in the ECF fraction in control animals. In prob- tration by probenecid was in keeping with results from our enecid-treated animals, this ratio was significantly in- previous study [1], in which rabbits were infused
intraven-creased to 3.6660.36. ously with VPA alone or in combination with probenecid,
To examine the equilibration kinetics of VPA across the while simultaneously perfusing the ventricles with artificial BBB, the ECF-to-total plasma concentration ratio was CSF. We noted in this earlier study that upon co-infusion with probenecid the steady-state brain tissue concentration of VPA was elevated to a greater extent than was the Table 4
cisternal outflow perfusate. This observation was unex-Estimated steady-state concentrations of VPA in the ECF and the ICC,
a pected if the exchange of drug between brain tissue and the
and concentration ratios or gradients across fluid spaces or compartments
ventricular fluid occurs strictly by passive diffusion across
Control Probenecid
cell membrane barriers, through the ECF space, and across
(n55) (n55)
the ependyma. We had suggested that probenecid might b
ECF (mg / ml) 1.7260.16 2.7860.36
c have inhibited carrier-mediated transport of VPA from the
ICC (mg / ml) 4.6960.27 11.6261.62
b ICC to the extracellular spaces, which resulted in
intracel-Brain:total plasma 0.06960.0024 0.1660.024
b
Brain:free plasma 0.4160.062 0.7060.087 lular retention of VPA and elevated VPA concentration in
b
Brain:ECF 2.4860.23 3.6660.36 tissue relative to ventricular perfusate. Indeed our results
b
ECF:total plasma 0.02960.0026 0.04460.0048
from the present microdialysis study show that VPA is ECF:free plasma 0.1760.034 0.1960.015
b taken up by the cells of the brain parenchyma, and provide
ICC:ECF 2.8160.28 4.2460.44
b evidence in support of the existence of a
probenecid-ICC:free plasma 0.4660.068 0.8160.10
a sensitive efflux transporter at the parenchymal cell
mem-Values represent mean6S.E.
b brane.
Significantly different from control, P,0.05.
c
able to maintain a steady-state intracellular-to-extracellular glial cells, as suggested by the effect of probenecid in the concentration ratio of nearly 3.0. Apparent blockade of present microdialysis study, awaits further investigation. efflux transport with probenecid elevated this gradient to Our present observation of higher VPA concentrations in 4.2. The apparent concentration of VPA in the ICC relative ICC than in ECF differs from the conclusion reached in an to the ECF could be interpreted to mean that the paren- earlier microdialysis study in rats. Wolf et al. [34] reported chymal cells, or one or several of its constituent cell types that 64% of VPA in the brain tissue was located in the (neurons or glial cells), have the ability to sequester VPA. ECF. However, the experimental technique differed be-Since VPA does not bind to brain homogenate constituents tween the two studies in several key respects. Firstly, the (unpublished data), sequestration can only occur by a microdialysis probe was placed in the striatum of the rat in concentrative, inward transport system at the parenchymal Wolf’s study, whereas the cerebral cortex of the rabbit was cell membrane. However, it is equally (or more) likely that dialyzed in the present study. Given that a different mix of the high ICC-to-ECF concentration ratio merely reflected a cell types is present at the two brain sites, regional dynamic gradient created by facilitated release from the differences may exist in the extent of parenchymal cell parenchymal cells followed by an efficient removal of VPA uptake. Secondly, there may be species differences in the from the ECF via efflux transport at the BBB. transport mechanisms, which would account for the vari-Our present finding indicates a very steep uphill gradient ation between rats and rabbits in the partitioning of VPA for VPA in the direction of ECF to plasma; i.e. 34:1 in between the intracellular and extracellular compartments. terms of total plasma concentration or 5.9:1 in terms of Thirdly, retrodialysis was used to determine dialytic ef-free plasma concentration (see Table 4). This confirms our ficiency in the present study, whereas Wolf et al. calculated hypothesis of an active efflux transport at the BBB. In this ECF VPA concentrations in two ways: by assuming the regard, it is interesting that probenecid co-treatment ap- dialytic efficiency in vitro was identical to the in vivo peared to have little effect on the ECF-to-free plasma VPA efficiency, and by the method of Jacobson et al. [13] in concentration ratio; efflux transporter at the BBB, unlike which the extracellular concentration is estimated by that at the parenchymal cell membrane, is not inhibitable measuring dialysate concentration at different flow rates by probenecid. This may imply that the transporter mecha- and extrapolating to zero flow. Lastly, a critical difference nisms at the two barrier sites are not identical. Alternately, between the two studies lies in the manner in which the probenecid may have inhibited both the influx (blood-to- VPA dose was administered. Wolf et al. [34] administered ECF) transport as well as the efflux (ECF-to-blood) a single bolus dose of sodium valproate through a cannula transport, such that there is minimal net perturbance in the implanted into the heart, and monitored the ECF VPA bidirectional flux. It should be noted that some of prob- concentration over time as the blood VPA concentration enecid’s effects may be related to the alteration in blood declined rapidly. In contrast, blood or plasma as well as pH or bicarbonate. This is not likely, since the probenecid- ECF concentration of VPA was maintained at steady state induced elevation in dialysate concentration was observed in the present study. It is quite conceivable that the uptake throughout the study, whereas significant change in blood rate of VPA into parenchymal cells is sufficiently slow, chemistry was only apparent toward the end of the 240- such that only limited access into the parenchymal cells min infusion period. occurred in a non-steady-state situation. Also, the previous Previous studies from our laboratory have already single dose study was complicated by transient high drug demonstrated the existence of carrier-mediated transport concentrations that led to saturation in VPA binding to for the bidirectional movement of VPA across the blood– plasma proteins and may have resulted in saturation of brain barrier [2,20]. In addition to passive diffusion, the brain transport mechanisms. In contrast, maintenance of a influx of VPA from blood into the brain is mediated by an constant ECF level of VPA in the present study allowed organic anion exchanger that operates in a manner similar accumulation of VPA in the ICC, and avoided confounding to the so-called para-aminohippurate (PAH) transporter at pharmacokinetic complexities.
concluded that the access of VPA to the intracellular sites technical assistance with the GC / MS analysis of brain ¨
of action is a relatively slow process. In fact, Loscher [15], tissue and dialysate samples. We would also like to thank in his recent review on VPA pharmacology, postulated that Michael Fisher, Ph.D. (Eli Lilly & Company, Indianapolis, the sequence of early extracellular and late intracellular IN) for his assistance with the section pertaining to GC / effects explains the well-known biphasic clinical effects of MS analysis. National Institutes of Health grant NS-30738 VPA in epileptic patients. We believe that the duration of funded this work.
VPA infusion in the present study (4 h) is sufficiently long to allow for the drug to fully equilibrate between the ECF and ICC of the rabbit brain. Moreover, the ECF-to-ICC
References
distribution is crucial to our understanding of the in vivo importance of the various anticonvulsant mechanisms
[1] K.D. Adkison, A.A. Artru, K.M. Powers, D.D. Shen, Contribution of proposed for VPA.
probenecid-sensitive anion transport processes at the brain capillary Our incidental finding of EEG changes during VPA endothelium and choroid plexus to the efficient efflux of valproic infusion or VPA and probenecid co-infusion warrants acid from the central nervous system, J. Pharmacol. Exp. Ther. 268 comment. The observation that VPA infusion decreased (1994) 797–805.
[2] K.D. Adkison, D.D. Shen, Uptake of valproic acid into rat brain is EEG power but not the number of waveforms is consistent
2 mediated by a medium-chain fatty acid transporter, J. Pharmacol. with the EEG effect of VPA andD-VPA reported
previ-Exp. Ther. 276 (1996) 1189–1200. ously [26]. In the present study, co-infusion of VPA and
[3] U. Altrup, G. Gerlach, H. Reith, M.N. Said, E.J. Speckmann, Effects probenecid resulted in changes in both delta and theta of valproate in a model nervous system (buccal ganglia of Helix waveforms that are qualitatively different from that ob- pomatia): I. Antiepileptic actions, Epilepsia 33 (1992) 743–752.
[4] H.G. Bolander, G. Wahlstrom, Interaction between probenecid and served with VPA infusion alone. The reported effects of
two lipid-soluble barbiturates in the rat, Neuropharmacology 23 probenecid on brain electrical activities are inconsistent.
(1984) 977–981. Bolander and Wahlstrom [4] reported that probenecid
[5] M. Bradbury, in: The Concept of a Blood–Brain Barrier, John decreased the threshold for thiopental-induced EEG de- Wiley, New York, 1979, pp. 64–70.
pression in rats. In contrast, Walker and Pratt [32] reported [6] E.M. Cornford, C.P. Diep, W.M. Pardridge, Blood–brain barrier that probenecid did not change the incidence of low transport of valproic acid, J. Neurochem. 44 (1985) 1541–1550.
[7] E.C. de Lange, M. Danhof, A.G. de Boer, D.D. Breimer, Critical voltage electrical activity in unanesthetized fetal sheep. It
factors of intracerebral microdialysis as a technique to determine the is possible that the effect on theta waveform represented a
pharmacokinetics of drugs in rat brain, Brain Res. 666 (1994) 1–8. pharmacodynamic interaction between VPA and probene- [8] R.G. Fariello, M. Varasi, M.C. Smith, Valproic acid: mechanisms of cid. Furthermore, the effects of probenecid co-infusion action, in: R.H. Levy, R.H. Mattson, B.S. Meldrum (Eds.), Anti-could reflect a change in the pharmacology of VPA that epileptic Drugs, Raven Press, New York, 1995, pp. 581–588.
[9] P.L. Golden, K.R. Brouwer, G.M. Pollack, Assessment of valproic occurred in response to the shift in
intracellular-to-ex-acid serum-cerebrospinal fluid transport by microdialysis, Pharm. tracellular distribution of VPA in neurons. The idea of a
Res. 10 (1993) 1765–1771.
qualitative change in the pharmacology of VPA as a result [10] T.K. Gregory, D.C. Pettus, An electroencephalographic processing of drug–drug interaction at the level of membrane trans- algorithm specifically intended for analysis of cerebral electrical porters is a novel concept that warrants further inves- activity, J. Clin. Monit. 2 (1986) 190–197 [published erratum
appears in J. Clin. Monit. 1987 Jan;3(1):21]. tigation. It is also possible that the effect on theta
[11] E.J. Hammond, R.J. Perchalski, H.J. Villarreal, B.J. Wilder, In vivo waveform may be secondary to probenecid’s effect on
uptake of valproic acid into brain, Brain Res. 240 (1982) 195–198. blood pH (and possibly blood bicarbonate level).
[12] F. Ichimura, Y. Deguchi, K. Yokogama, T. Yamana, Physiologically In conclusion, microdialysis proved to be a powerful based pharmacokinetics of valproic acid in rabbits, Int. J. Pharm. 27 tool to investigate intracellular versus extracellular com- (1985) 45–60.
[13] I. Jacobson, M. Sandberg, A. Hamberger, Mass transfer in brain partmentalization of VPA in the brain parenchyma. The
dialysis devices — a new method for the estimation of extracellular concentration of VPA in the ICC relative to the
extracellu-amino acids concentration, J. Neurosci. Methods 15 (1985) 263– lar pool suggests that intracellular anticonvulsant
mecha-268.
nisms (e.g. elevation in synaptic GABA pool) are largely [14] J.S. Lockard, C.T. Viswanathan, R.H. Levy, Diurnal oscillations of responsible for the clinical efficacy of VPA. The results of CSF valproate in monkey, Life Sci. 36 (1985) 1281–1285. this study, in combination with previous observations, also [15] W. Loscher, Valproate: a reappraisal of its pharmacodynamic
prop-erties and mechanisms of action, Prog. Neurobiol. 58 (1999) 31–59. demonstrate a probenecid-sensitive efflux transport system
[16] W. Loscher, H. Nau, Distribution of valproic acid and its metabolites in the parenchymal cells that works in tandem with the
in various brain areas of dogs and rats after acute and prolonged active efflux transport system at the blood–brain barrier in treatment, J. Pharmacol. Exp. Ther. 226 (1983) 845–854. hindering an efficient delivery of VPA to the brain. [17] W. Loscher, H. Nau, H. Siemes, Penetration of valproate and its
active metabolites into cerebrospinal fluid of children with epilepsy, Epilepsia 29 (1988) 311–316.
[18] R. Lu, B.S. Chan, V.L. Schuster, Cloning of the human kidney PAH
Acknowledgements
transporter: narrow substrate specificity and regulation by protein kinase C, Am. J. Physiol. 276 (1999) F295–F303.
concentration of valproate in blood and extracellular space of rat [27] R.L. Semmes, D.D. Shen, Capillary gas chromatographic assay for cerebral cortex, Epilepsia 35 (1994) 922–926. valproic acid and its 2-desaturated metabolite in brain and plasma, J. [20] K. Naora, D.D. Shen, Mechanism of valproic acid uptake by isolated Chromatogr. 432 (1988) 185–197.
rat brain microvessels, Epilepsy Res. 22 (1995) 97–106. [28] R.L. Semmes, D.D. Shen, Comparative pharmacodynamics and [21] H. Nau, W. Loscher, Valproic acid: brain and plasma levels of the brain distribution of E-delta 2-valproate and valproate in rats,
drug and its metabolites, anticonvulsant effects and gamma-amino- Epilepsia 32 (1991) 232–241.
butyric acid (GABA) metabolism in the mouse, J. Pharmacol. Exp. [29] D.D. Shen, G.A. Ojemann, R.L. Rapport, R.L. Dills, P.N. Friel, R.H. Ther. 220 (1982) 654–659. Levy, Low and variable presence of valproic acid in human brain, [22] M. Nilsson, E. Hansson, L. Ronnback, Transport of valproate and its Neurology 42 (1992) 582–585.
effects on GABA uptake in astroglial primary culture, Neurochem. [30] W.S. Spector (Ed.), Handbook of Biological Data, W.B. Saunders,
Res. 15 (1990) 763–767. Philadelphia, 1956, p. 270.
[23] L.H. Parsons, J.B. Justice Jr., Quantitative approaches to in vivo [31] F.J. Vajda, G.A. Donnan, J. Phillips, P.F. Bladin, Human brain, brain microdialysis, Crit. Rev. Neurobiol. 8 (1994) 189–220. plasma, and cerebrospinal fluid concentration of sodium valproate [24] J.E. Race, S.M. Grassl, W.J. Williams, E.J. Holtzman, Molecular after 72 h of therapy, Neurology 31 (1981) 486–487.
cloning and characterization of two novel human renal organic anion [32] D.W. Walker, N. Pratt, Effect of probenecid on breathing movements transporters (hOAT1 and hOAT3), Biochem. Biophys. Res. Com- and cerebral clearance of prostaglandin E2 in fetal sheep, J. Physiol.
mun. 255 (1999) 508–514. (Lond.) 506 (1998) 253–262.
[25] A.W. Rettenmeier, W.N. Howald, R.H. Levy, D.J. Witek, W.P. [33] H.G. Wieser, Comparison of valproate concentrations in human Gordon, D.J. Porubek, T.A. Baillie, Quantitative metabolic profiling plasma, CSF and brain tissue after administration of different of valproic acid in humans using automated gas chromatographic / formulations of valproate or valpromide, Epilepsy Res. 9 (1991) mass spectrometric techniques, Biomed. Environ. Mass. Spectrom. 154–159.
18 (1989) 192–199. [34] J.H. Wolf, L. Veenma-van der Duin, J. Korf, The extracellular [26] J.L. Scism, K.M. Powers, A.A. Artru, A.C. Chambers, L. Lewis, concentration of the anti-epileptic drug valproate in the rat brain as K.K. Adkison, T.F. Kalhorn, D.D. Shen, Effects of probenecid on determined with microdialysis and an automated HPLC procedure, brain-cerebrospinal fluid-blood distribution kinetics of E-Delta 2- J. Pharm. Pharmacol. 43 (1991) 101–106.