Contribution
of
roots
and
amendments
to
soil
carbon
accumulation
within
the
soil
pro
fi
le
in
a
long-term
fi
eld
experiment
in
Sweden
Lorenzo
Menichetti
a,*
,
Alf
Ekblad
b,
Thomas
Kätterer
caSwedishUniversityofAgriculturalSciences,DepartmentofSoilandEnvironment,P.O.Box7014,Uppsala75007,Sweden bSchoolofScienceandTechnology,ÖrebroUniversity,Örebro70182,Sweden
cSwedishUniversityofAgriculturalSciences,DepartmentofEcology,P.O.Box7044,Uppsala75007,Sweden
ARTICLE INFO
Articlehistory:
Received5December2013
Receivedinrevisedform30October2014 Accepted3November2014
Availableonlinexxx
Keywords: d13C
Roothumification SOC
Subsoil Topsoil
ABSTRACT
ThecontributionofdifferentCinputstoorganiccarbonaccumulationwithinthesoilprofileintheUltuna
long-termcontinuoussoilorganicmatterexperiment,establishedin1956,wasdetermined.Until1999,
C3-cropsweregrownatthesite,butsincethenmaize(C4)hasbeentheonlycrop.Theeffectofatotalof
10differentinorganicnitrogenandorganicamendmenttreatments(4MgCha 1yr 1)onSOCintopsoil
andsubsoilafter53yearswasevaluatedandthecontributionfrommaizerootstoSOCafter10yearsof
cultivationwasestimated.
Soilorganiccarbon(SOC)andd13Csignatureweremeasureddownto50cmdepth.TheCcontentinthe
topsoil(0–20cmdepth)was1.5%atthestartoftheexperiment.After53yearsoftreatments,theaverage
topsoilCcontentvariedbetween0.9and3.8%ofsoildryweight,withtheopenfallowhavingthelowest
andthepeatamendedthehighestvalue.NitrogenseemedtopromoteCaccumulationinthetopsoil
treatmenteffectsweresmallerbelow20cmdepthandonlytwooftheamendments(peatandsewage
sludge)significantlyaffectedSOCcontentdownto35cmdepth.Despitethis,penetrometer
measure-mentsshowedsignificanttreatmentdifferencesofcompactionbelow41cmdepth,andalthoughwe
couldnotexplainthesedifferencesthispresentedsomeevidenceofaninitialtreatment-inducedsubsoil
differentiation.Tenyearsofmaizegrowthaffectedthed13CofSOCdownto22.5cmdepth,whereitvaried
between 25.16and 26.33(m), andanisotopic massbalance calculation suggestedthat maizeC
accountedfor4–8%oftotalSOCinthetopsoil.Untillessthan2500yearsagothesitewasapost-glacialsea
floorandthe14CdatasuggestthatmarinesedimentCstilldominatestheSOCindeepersoillayers.
Overall,theresultssuggestthat53yearsoftreatmentshascauseddramaticchangesonthestoredCinthe
topsoilinseveralofthetreatments,whilethechangesinthesubsoilismuchlessdramaticandasmallC
accumulationintheuppersubsoilwasfoundintwoofthetreatments.
The contribution from roots to SOC accumulation was generally equal to or greater than the
contributionfromamendments.Theretentioncoefficientofroot-derivedCinthetopsoilwasonaverage
0.300.09,whichishigher thanusuallyreportedintheliteratureforplantresiduesbutconfirms
previousfindingsforthesameexperimentusinganotherapproach.Thisstrengthenstheconclusionthat
root-derivedSOCcontributedmoretoSOCthanabove-groundcropresidues.
ã 2014ElsevierB.V.Allrightsreserved.
1.Introduction
The globalcarbon (C) sinkis expected toincrease with the increasein primaryproductivity drivenbyhighertemperatures andCO2concentrations(Kirschbaum,2000).However,a
simulta-neousincreaseinemissionsduetolandusechangeoranincrease insoilrespirationafteranincreaseintemperaturemaycounteract almostallthispositiveeffect(Eglinetal.,2010).Morethan
one-third(37%)ofgloballandisusedinagricultureand10%ofglobal landisunderannualcrops(FAOStatisticalDatabase,2013), and thereforeexposedtoquickchangesinmanagement.On agricul-turalland,therangeofpossibleinterventionsforclimatechange mitigation is constrained by the global requirements for food production (Powell and Lenton, 2012), but C sequestration in agriculturalsoilscanbeincreasedthrough changesin manage-mentpractices(Lal,2004;Kättereretal.,2013;Stockmannetal., 2013).
MostpreviousstudiesonCsequestrationhavefocusedonthe topsoil(e.g.,LorenzandLal,2005).Althoughthisis understand-able, since the concentrationsand turnoverof SOC are usually
* Correspondingauthor.Tel.:+46768549268;fax:+4618673156.
E-mailaddress:[email protected](L.Menichetti).
http://dx.doi.org/10.1016/j.agee.2014.11.003
0167-8809/ã 2014ElsevierB.V.Allrightsreserved.
–
ContentslistsavailableatScienceDirect
Agriculture,
Ecosystems
and
Environment
higherin topsoilsthanin subsoils,globallysubsoilsstoremore than half of total SOC (Jobbagy and Jackson, 2000) and are thereforepotentiallyimportantforC sequestrationstrategies.A fewstudieshavebeenconducted(e.g.,Pauletal.,1997;Jobbagy andJackson,2000;BirdandKracht,2003;JenkinsonandColeman, 2008;Jenkinsonetal.,2008;Kirchmannetal.,2013),butthereis stillrelativelylargeuncertaintyregardingCindeepersoillayers (LorenzandLal,2005).Areasofuncertaintyincludetheresponse tochangesinmanagementofalargepartoftheCstoredinsoil (Poeplauet al., 2011) and itsstabilizationmechanisms (Chabbi etal.,2009),makingprecisequantitativepredictionsdifficult.Itis therefore important to obtain accurate information on the reactivity of different C pools to management changes and on howdifferentCinputscontributetotheformationofSOCoverthe wholesoilprofile.Inparticular,thecontributionofroot-derived materialcanbeparticularlyrelevantforSOCaccumulationbecause of thepossible associatedprotection mechanisms(Rasseet al., 2005), and might so far be underestimated in the literature (Kättereretal.,2011).
During recent decades, long-term experiments have been shownto produceinformation on theformation of SOC stocks fromdifferentorganicCinputs(Kättereretal.,2011)andonhow theolderSOCdecays(Barréetal.,2010).Thereforeinthisstudywe useddatafromtheUltunalong-termfieldexperiment,established inSwedenin1956andmanagedsincethenbyadditionsofafixed amountofCintheformofdifferentamendments,incombination withorwithoutnitrogen(N)fertilization.
Theaimofthestudywastoexaminethefollowingquestions: (1)HowhaveNfertilizationandadditionoforganicamendments affectedSOCaccumulation intopsoil and subsoilin theUltuna long-termfieldexperiment?and(2)HowhaveCinputsfromroots contributedtoSOCformationandaccumulation?
To determine how management practices affect soil C accumulationor release in agricultural topsoil and subsoil, we analyzed soil cores from 0 to 50cm depth in 10 different experimentaltreatments.Thisallowed ustoevaluatetheeffect ofdifferentCinputsonSOCstocksonthewholesoilprofilesince thestartoftheexperimentin1956.
Toconsidertheinputsfromroots,webasedourinvestigationon thefactthatthecropscultivatedintheexperimentshiftedfromC3
to C4 crops in the year 2000. Several authors have tried to
determinethe decayof SOCof differentages byexploitingthe natural difference in 13C content of plants with C
3 and C4
photosynthetic cycles (Wynn and Bird, 2007; Blagodatskaya etal.,2011).Theanalysisof
d
13Csignaturesdownthewholesoil profileallowedustoquantifythecontributiontoSOCfrommaize rhizodepositiontoadepthof50cmover10yearsinthedifferent experimental treatments. We then determined the retention coefficient ofthenewly formedmaterialfor each experimental treatment,investigatingtheinfluenceofrhizodepositiononSOC accumulationanddecayatdifferentdepths.2.Materialandmethods
2.1.Studysiteandtreatments
Thelong-termfieldexperimentislocatedinUltuna,closeto Uppsala (59.82N, 17.65E), in a Dfb climate (warm summer
hemiboreal) accordingto theKöppen classification (Peel et al., 2007), with mean annual precipitation of 570mm and mean annualairtemperatureof+5.4C.Thetopsoil(0–20cm)isaclay
loamwith36.5% clay,41% silt(0.002–0.06mm)and22.5% sand
(0.06–2mm)andisclassifiedasaEutricCambisol(IUSSWorking Group,2007).The parentmaterialconsistsofpost-glacial sedi-mentsandilliteisthemainclaymineral(Gerzabeketal.,1997).In 1956,thetopsoilhadanorganicCcontentof1.5%,anNcontentof 0.17%andapHof6.6.Thesitehasbeeninagriculturaluseforat least300years.Sincethestartoftheexperiment,theplotshave beencultivatedmanually.
From1956to1999,annualC3cropssuchasoats,springbarley,
sugar beet, oilseedrape, turnip rape and white mustard were cultivated.Prior to2000, cultivatedplants had anaverage
d
13C signatureof 28.00.1m
(Menichetti etal., 2013).In 2000, C3crops were replaced with forage maize, a plant with a C4
photosyntheticcycleandanaverage
d
13Csignatureof 12.30.1m
(Menichettietal.,2013).Theexperimentaldesignconsistedof15treatmentswithfour replicateplotsinarandomizedblockdesign.Eachplotis2m2m,
separated by 40cm high steel frames extending toa depth of 30cm.ApproximatelythesameamountofC(4Mgha 1)isadded
in10ofthetreatmentsinautumneverysecondyearasdifferent organic amendments (Table 1). Inorganic N fertilizer is added annually during spring at a rate of 80kgNha 1yr 1 in the
N-fertilizedtreatments.Theexperimentalsoincludesatreatment thatreceivesneitherNfertilizernororganicamendmentsanda barefallowtreatmentthatiskeptfreefromvegetationbyregular weeding.Allplotsarefertilizedannuallywith22kgPand35–38kg
Kha 1.Above-ground biomassis harvested bycutting thecrop
closetothesoilsurface,andbothgrainandabove-groundyields arerecordedeachyear.Asamplearchive,managedtogetherwith theexperiment,storessamplesfromtopsoil,plantmaterialsand amendments takeneverysecondyearsince1983 and intermit-tentlybetween1956and1982.Fromthe15treatments,thesubset of10selectedforthisstudycoveredthewholerangeofSOCquality intheexperiment(Table1).
2.2.Samplingandanalysis
SoilsamplingwascarriedoutaftercropharvestinSeptember 2009. Samples were taken with an auger at increasing depth intervals of: 0–15,15–17.5,17.5–20, 20–22.5, 22.5–25, 25–27.5,
27.5–30,30–35,35–40and40–50cm.Thesesamplingdepthshave
beenchosentoincreasetheresolutionintheintervalswithmore
Table1
Topsoil(0–20cm)characteristics(meanswithstandarderrors;n=4)oftreatmentsA–OintheUltunalong-termexperimentstudiedhere.
Treatment Crop Fertilisera
expected variation. Since the soil is ploughed to 20cm, we expectedthatvariationwouldbethehighestinthetransitionzone betweentop-and subsoil,between15and30cm depth.Dueto limitationsintheamountofsubsoilthatcanbetakenfromthe smallplotsinthisexperiment,onlyonecore(diameter2cm)per plot was taken below 20cm depth. This was extractedwithin 40cmfromtwobordersofeachplot.Thetopsoil(0–20cm)was
sampledaccordingtostandardproceduresatfivelocationswithin eachplot.Thesampleswerebroughttoacoolroomwithin2hof samplingandstoredat5Cforaperiodthatvariedbetweentwo
weeksandonemonthuntilfurthertreatment. Fromeachdepth interval, a sample of 10–15g was taken by aggregating five subsamples(2–3geach)takenatapproximately1-cmintervals.
Thebulksampleswerethendriedat105Cfor12h,homogenized
and milled toa powder withan agate mortarand pestle, and subsequentlyanalyzed.
TopsoilC and Nwere analyzedusing anelemental analyzer (Leco CN-2000, St. Joseph, Michigan) and
d
13C signature was determined with an elemental analyzer (model EuroEA3024; Eurovector, Milan, Italy) coupled online to a continuous flow Isoprime isotope-ratio mass spectrometer (GV Instruments; Manchester,UK)atÖrebroIsotopeLaboratory.Soilsamplesfrom 1956and1999andsamplesoftheamendmentsusedfrom1975to 2009weretakenfromthehistoricalarchiveandalsoanalyzedfor totalCandd
13C.Theresultingd
13Cvalueswereexpressedinparts perthousand(m
)relativetotheinternationalstandardofViennaPeeDee Belemnite(V-PDB),where
d
13C=1000(Rsample R stan-dard)/Rstandardm
andRistheratioof13C–12C.Thed
13Cvalueoftheamendmentswasmeasuredbyaveragingdirectmeasurementsof samplesfrom1975,1979,1989,1993,1995and2005.Theresulting
d
13Cvaluesforfarmyardmanure,greenmanureandsewagesludge were 27.91.2, 27.40.9and 25.70.1m
,respectively.Thed
13Cvalueforpeat( 25.60.4m
)wastakenfromGerzabeketal. (1997).Thephysicalconditionsinthesoilprofilewerecharacterizedby measuring penetration resistance in September 2009 down to
45cm depthwith an Eijkelkamppenetrologger(model P1.52,
Eijkelkamp, Arnhem, Netherlands). Each penetration profile representedtheaverageoffourplots,with7repeated measure-mentswithineachplotfora totalof28 measurementsforeach penetrationprofile.
Soilcoresfromaprevioussamplingperformedin1997inthe unamended,fertilizedtreatmentbyBergkvistetal.(2003) were analyzed for 14C content. The analyses were performed after
bulkingthefourreplicatesintotwoseparatesamples.Theresults of 14C analyses were expressed as per cent of modern carbon
(pMC),wherepMC=Asn/Aon(1/8267(Y 1950))% and Asn
rep-resents the particle count per minutes of the sample, Aon
represents the particle count per minutes of the international standardandYreferstotheyearofsampling.Thevalue8267refers tothe average life of 14C relative tothis particular convention
(Stuiver and Polach,1977). Conventional radiocarbon age was calculatedaccordingtotheformula CRA= 8033ln(Asn/Aon)and
expressedinyearsbeforepresent(BP).Thevalue8033referstothe averagelifeof14Crelativetothisparticularconvention(Stuiverand Polach,1977).
2.3.Datatreatmentandanalysis
DataanalysiswasperformedwithintheRstatistical environ-ment(RDevelopmentCoreTeam,2011).Basedonthe penetrome-terdata, three depthzoneswereidentified: (a)the topsoil(0–
20cm),wheretillageandfertilizationtakesplace,(b)theinterface between topsoil and subsoil (20–25cm) just below ploughing
depthand(c)theuppersubsoil(25–50cm).
TreatmenteffectsweretestedwithANOVAindependentlyfor eachdepthintervalandalsoaggregated(byweightedaverage)by depth zones, followed then by a Tukey’s Honestly Significant Difference (HSD)test. Correlationswereexpressed asPearson’s
correlationcoefficient.
Thetopsoilinthestrawtreatment(F)hasbeenroughlyinC equilibriumsincethestartoftheexperiment,havinggainedonlya 0.03% C or 0.26gCcm 3 over the last 56 years. We therefore
considereditasareferenceandassumedthedifferencebetween the SOC profile in the straw treatment and that in the other treatmentstorepresenttheCgainsorlossesduetothedifferent treatments.
Allthepast profile data,takensometimesduringthewhole historyoftheexperimentatdifferentdepthintervalsfordifferent analyses, werereconciledbylinear interpolationwithavertical resolutionof1cminordertohavecompatiblemeasurementsfor subsequentcalculations.Thebulkdensityprofilesfor2009were estimatedbylinearinterpolationbetweenthetopsoilbulkdensity in2009(Kättereretal.,2011)andthebulkdensityvaluesdownto 100cmdepthtakenin1956.Changesinbulkdensityinthesubsoil sincethestartoftheexperimentwereassumedtobenegligible. ThecalculationsofmaizecontributionstoSOCwereperformed accordingtotheconceptofequivalentsoildepth(Kättereretal., 2011),inordertoaccountfortherelativechangeinsoildensityand theconsequentchangeinthetilledpartofthesoil.Thischangewas assumedtoinfluencethepreferentialrootingzonesoapplication oftheequivalentsoildepth,ascalculatedforthesameexperiment byKättereretal.(2011),wasthereforeparticularlyrelevantinthis study. Fromtherelativecontributionof maizetoSOC,we then estimatedtheamountofmaterialaddedbymaizecultivationover 10 years and its retention coefficient, which is defined as the amountofCfrommaize-derivedinputsthatis retainedasSOC. Sinceallabove-groundcropresiduesareremovedfromthefieldin ourexperiment,theretentioncoefficientreferstocarbonderived from below-groundbiomass which was estimated from above-ground yields usinglinear allometric functions(Bolinderet al., 2007).
The contribution from maize to total SOC was estimated according to Bayesian principles. We utilized a Monte Carlo MarkovChain(MCMC)searchalgorithmrunningthemodelinR through the JAGS sampler (Plummer, 2003), which utilizes a formallog-likelihoodcostfunction.Wechoseforthetargetvaluea prior distribution generated as uniform distributionin a range between0and0.3forthemaizeproportion,andforthemeasured valuesanormaldistributioncentredonthemeanofthevalueand withstandarddeviationcorrespondingtothemeasurederrorof
d
13Csignatures.Themodelwascalibratedbasedonfourchainsof 350,000runseach.TheapplicationofBayesianprinciplesallowed us to calibrate the desired value propagating the known uncertainty involved in the calculation, and to estimate a probability distributionfor each value.Thistechnique becomes particularlyusefulwhenworkingwithsmallisotopeintervalsfor which errors need to be quantified precisely to determine significant differences, since it gives much more detailed information on the probability distribution of the results and permitsmore rigorouserrorpropagationcomparedwith deter-ministictechniques(Parnelletal.,2010).Aprincipalcomponentanalysis(PCA)hasbeenrun(Venables andRipley,2002)onourdatasetincombinationwithdatafrom
Börjessonetal.(2011),inordertoassessthepossiblecorrelations betweenSOCmineralizationandmicrobialecology.
2.3.1.EstimationofmaizerootcontributiontoSOC
The contributions of C3 and C4 material to total SOC were
calculatedaccordingtothefollowingmass-balanceequation:
pC4¼
d
13C2009
d
13C1999d
13Cmaized
13C1999(1)
wherepC4 represents theproportionfromC4 toC,
d
13C2009themeasured
d
13Csignaturein2009,d
13C1999thesignatureofSOCin1999and
d
13Cmaizetheaverageisotopicsignatureof maize.Thed
13C signature change due to addition of amendments was consideredbycalculatingtheannuald
13C changeinSOCdue to amendments for each treatment from 1956 to 1999, and extrapolatingthelineartrendtotheperiod2000–2009toestimatethetheoretical
d
13C signatureof SOC in 2009 thatwould have resultedifonlyC3plantshadbeengrown.Thisvaluewasthenusedtocalculatetheproportionduetomaizeinordertoaccountforthe effectofamendments.
3.Results
3.1.SOC,Nand14Cintopsoilandsubsoil
**ThehighestCstocks(Table3)werefoundinthepeat(M)and sludge(O)treatments,whichcontained87.0and74.7MgCha 1,
respectively.ThisismorethanthreetimesthetotalCofthebare fallow(A),whichamountedto23.6MgCha 1andabouttwicethat
of the straw (F)treatment, which amounted to38.7MgCha 1.
Nitrogenfertilizationpositivelyinfluenced SOCaccumulationin thetopsoil,aneffectwhichwasparticularlyclearwhencomparing thetreatmentsthatdifferedonlyinNfertilization.TheN+straw treatment(G)hadmoreSOCthanthestraw(F)treatmentandthe +N treatment (C) had more SOC than the control (B). Butthe accumulation of C4-derived SOC didnot showany statistically
significantdifferencebetweenthe+Nandthe+strawtreatment (Table2).
Significant increases between 25 and 35cm were generally recorded in the richer amended treatments (peat and sludge), whichdisplayedanincreaserelativetothestrawtreatmentofon average0.27gCcm 3(andrangedbetween0.12and0.31gCcm 3),
whiletheCcontentofthenon-amendedtreatments(A,BandC)
was notsignificantlydifferentfromthestrawtreatmentatthis depth.TreatmentdifferencesinCcontentweresignificantdownto 35cmdepthwhentestedbycomparingvaluesaggregatedbylayer withanANOVA(TableA1).ConsideringCvariationinthesubsoil (depthbelow25cm)asalinearfunctionofdepth,treatmentsM (peat)andO(sewagesludge)showedsignificantly(C.I.95%)higher C contents below this depth than in the straw treatment. Interestingly,whentestedwithANOVAthepenetrometervalues showed significanttreatmentdifferences onlyabove 13cm and below41cm(Fig.2).
TocalculatetheSOCchangesinducedbythetreatmentsover thewholesoilprofile,weconsideredthestrawtreatment,whichis roughlyinCequilibrium,aszero(Table3).Relativetothestraw treatment, alltheamendmenttreatmentsgained SOC(between 0.26 and 2.27gCcm 3 in the 0
–15cm range), while the
non-amendedtreatmentslostSOC(between0.42and0.85gCcm 3in
the0–15cmrange).
TheNcontentofthesoilprofilesfollowedtheSOCcontent.The
d
15N signature in the topsoil varied according to the different fertilizationregimes,butwithnoapparentrelationshipwithtotal SOC and probably depending mainly on the signature of the fertilizer and amendments added. Treatment differences were significant in the topsoil but no significant differences were detectedinthesubsoil.Theanalysisof14Ccontentwithinthepro
fileoftheunamended fertilizedplots(treatmentC)in1997revealedasteepdeclinein moderncarbonthroughouttheprofile,whichfollowedanonlinear decreasefromaround100%inthetopsoiltoaround40%at70cm depth(Fig.3).TheaverageSOCagebetween40and60cmdepth was 1759296 years BP, while below 60cm depth it was
7747100yearsBP.
3.2.ContributionfrommaizetoSOC
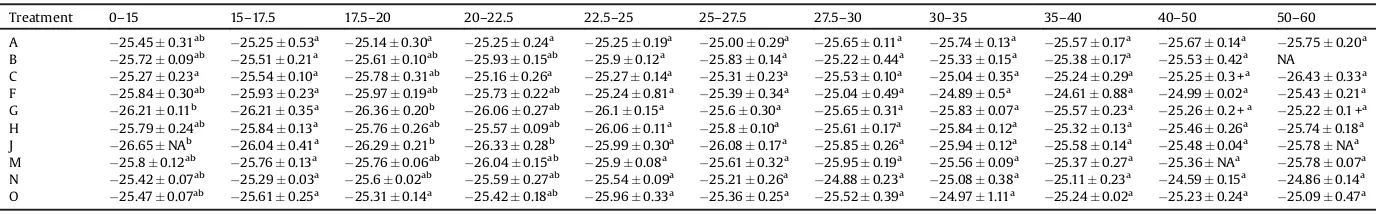
Significanteffectsoftreatmentsonsoilorganic
d
13Csignature were foundto 22.5cm depth accordingto analysisof variance (Fig.4).Whencomparingthed
13Csignatureofthetopsoil(after aggregating the data by weightedaverage for the three depthTable3
Differences(gcm3)insoilorganiccarbonstocksrelativetotreatmentF.FortreatmentcodesA
–OseeTable1.
Treatment Soildepth(cm)
0–15 15–17.5 17.5–20 20–22.5 22.5–25 25–27.5 27.5–30 30–35 35–40 40–50
A 0.850.20 0.500.07 0.360.06 0.150.02 0.150.01 0.020.00. 0.050.01 0.000.00 0.030.01 0.050.02
B 0.390.13 0.320.10 0.270.09 0.100.03 0.090.02 0.020.00 0.020.00 0.040.01 0.050.01 0.180.03
C 0.420.08 0.120.01 0.160.01 0.170.02 0.110.01 0.000.00 0.050.01 0.100.02 0.210.06 0.220.08
G 0.260.05 0.20.04 0.170.03 0.100.02 0.050.01 0.130.03 0.320.09 0.150.04 0.010.01 0.110.06
H 0.280.03 0.180.02 0.210.01 0.070.01 0.050.01 0.120.02 0.050.00 0.140.03 0.300.10 0.320.12
J 0.790.10 0.580.13 0.520.16 0.420.12 0.190.05 0.160.03 0.220.05 0.260.07 0.150.03 0.080.02
M 2.270.10 1.740.33 1.160.41 0.470.09 0.120.01 0.170.01 0.280.02 0.260.03 0.320.05 0.390.04
B 0.500.09 0.000.00 0.060.01 0.020.00 0.010.00 0.030.00 0.120.02 0.050.01 0.020.01 0.060.02
O 0.970.15 0.770.16 0.580.08 0.400.06 0.310.06 0.310.05 0.210.02 0.130.02 0.100.02 0.120.03
Table2
Soilcarbonstocks,contributionsfrommaizeandmaizeretentioncoefficientsinthetopsoil(consideringequivalentsoildepthsaccordingtoKättereretal.,2011)with standarderrorsofthemean(n=4).FortreatmentcodesA–OseeTable1.
Cstocks,Mgha 1 C
4(%) Maizestocks,Mgha 1 Maizeretentioncoefficient
A 23.584.59 NA NA NA
B 27.28.27 0.070.01 1.880.57 0.41
C 32.476.47 0.080.02 2.450.49 0.25
F 38.685.34 0.070.03 2.610.36 0.46
G 48.5512.82 0.050.02 2.410.64 0.21
H 41.568.34 0.070.03 2.940.59 0.34
J 56.128.38 0.050.03 2.910.44 0.26
M 86.9817.26 0.040.02 3.660.73 0.26
N 45.3510.29 0.050.02 2.250.51 0.21
O 74.7211.7 0.050.02 3.840.60 0.29
zones), a Tukey’s HSD test found significant differences only betweenamendedandnon-amendedtreatments(TableA2).
Thecontributionof10yearsofmaize cultivationtothe
d
13C signatureof SOCin thetopsoil, calculatedaccordingtoEq. (1), varied between 4 and 8% of total SOC. The non-amended treatmentsdisplayedless uncertainvalues,probablydue tothe factthattherewerenoamendmentscontributingtotheCstock.In treatmentswithhighCaccumulation(M,N,OandJ,seeTable1), therelativecontributionofmaizewasbetween4and5%oftotal SOC,althoughtheabsoluteCstocksofmaizeoriginwereingeneral higherthanintreatmentswithlowerCaccumulationrangingfrom 2.41Mgha 1 in the N+ straw treatmentto 3.88Mgha 1 in thesludgetreatment(Table2).Asimilarinteractionofamendments
Fig.1.SoilCcontentwithdepthinsixofthe10selectedtreatments.Shadedareas representstandarderrorofthemean(n=4).Valuesabovethehorizontaldashed lineshowsignificanttreatmentdifferences(p<0.1).FortreatmentcodesA–Osee
Table 1.
Fig.2.Penetrationforcealongthesoilprofile.FortreatmentcodesA–OseeTable1.
Fig.3.Percentageofmoderncarbon(pMC)alongthesoilprofileintreatmentC(no organicamendment, fertilised with calciumnitrate) in the Ultunalong-term continuoussoilorganicmatterexperiment.
Fig.4.d13Csignaturesalongthesoilprofile.Shadedareasrepresentstandarderror ofthemean(n=4).Valuesabovethehorizontaldashedlinesshowsignificant treatmentdifferences(p<0.1).FortreatmentcodesA–OseeTable1.
Fig.5.Relationshipbetweenmaize-derivedSOCandabove-groundyieldineach treatment.FortreatmentcodesA–OseeTable1.
withC4–Chasbeenalreadynoticedinthegasfluxesofthesame experiment(Menichettietal.,2013).Particularlyinterestingisthe comparisonbetweenthestrawandN+strawtreatments,where themaizecontributiontoSOCwas2.610.36and2.410.64Mg
ha 1,respectively.Thiscontraststothealmostdoubledyieldinthe
N+strawcomparedtostrawtreatment.
There was a statistically significant positive relationship (R2=0.54; p<0.02) between above-ground biomass yield and the amount of maize-derived SOC (Fig. 5), indicating the importanceof roots fromthelast 10years totheformation of soilC stocks. Mosttreatments showeda ratiobetween maize-derivedsoilCstocksandmaizeabove-grounddrymatteryieldof between0.29and0.45,whilethestraw(F)treatment showeda ratioof0.62.Theaverageretentioncoefficient,whichisbasedon theratiobetweenmaizeCstocksandrootinputs(withthelatter linearly derived from yield), was 0.300.09 (where the error
represents the standard deviation for all treatments taken together,and hasbeencalculatedfromtheprobability distribu-tionsshowedinFig.6).Thehighestretentioncoefficient forthe maizerootswasfoundinthestraw(F)andcontrol(B)treatments andthelowestintheN+straw(G)andsawdust(N)treatments.
4.Discussion
The 53 years of various treatments have caused significant changesintheSOCcontentdownto35cmdepthbutnotbelowthis level(Fig.1).Acorrespondinginfluenceoffertilizationtreatments ontheupper(inthiscase30–40cm)subsoilwasreportedrecently byKirchmann etal. (2013) intwo otherlong-term fertilisation experimentsinSwedenoverasimilartimeframe.Inthatcasethe fertilizationtreatmentaffectedinamoreevidentwayothersoil properties and produced two markedly different soil profile descriptions.
The analysis of 14C contentoverthe pro
file ofthe nitrogen-fertilised treatment revealed a distribution of modern carbon (Fig.3)compatible withthe rootdistributionfunction usedby
Kättereretal.(2011).Thisparticulartreatmentonlyshowsroot inputssincethestartoftheexperiment,andthereforerootshavea greatinfluenceonSOCformation.Accordingtothedistributionof
14C,thein
fluenceofCinputsoverthesoilprofiledecreasesasan exponential-likefunctionofdepth. Similarlyshaped14Cpro
files
werefoundforagriculturalsoilscroppedwithmaizeandwheatat RotthalmünsterandHalleinGermany(Rethemeyeretal.,2005).
The soil at the Ultuna site is formedfrom post-glacial marine sedimentsandispresentlysituatedat14mabovesealevel.Based on estimatedshore displacementsat Gamla Uppsala (Eriksson, 1999),anearbysite,theUltunasiteemergedfromthesealessthan 2500yearsago.Consequently,theaverageagesofthedeepsoil layerssuggeststhatthesoilCintheseisstilldominatedby pre-terrestrialCfrommarinesediments.
The penetrometer revealed some significantdifferences be-tweentreatmentsinthecompactionof deeperhorizons(below 41cmdepth),suggestinginfluencesofthetreatmentsonstructure inthesubsoil.Thesevariationscouldbeduetodirectorindirect cropactivity,forexampletodrierconditions inducedbyhigher evapotranspiration.Theorganicmaterialeluviatedfromtheupper layers might for example also differ in nature between the treatments,thus,producingdifferenteffectsontheaggregatesin the deeperlayers. Several otherexplanations might be equally possibleandamoredetailedinvestigationwouldbeneededfor obtainingapreciseanswer.
WecalculatedtheSOCbalancerelativetothestrawtreatment (Table3)asthetopsoilinthistreatmentisroughlyinCequilibrium (inputs=outputs)andisthereforeassumedtobeinsteadystate. The resulting SOC balance profile suggested again a major influenceofthetreatmentsonthetopsoil.
The effect of maize roots and rhizodeposition was not yet detectablebelow22.5cmdepthafter10years(Fig.4).Considering insteadthetime elapsedsince thestart oftheexperiment, the richertreatments(MandO)weretheonlytreatmentstoshowa significantSOCincreasealsointhesubsoil(Fig.1)whichcanhave beenduetotranslocationinducedbysoilfauna,dissolvedorganic carbonoraccumulationofrhizodeposits.Althoughdifferencesin SOCbetweenquiteextremetreatments,suchasbarefallowand compost-amended soil, were shown tobe significant to 40cm depthalreadyafter13yearsin a Swedishexperiment(Kätterer etal.,2014), theaccumulationofSOCinthesubsoil,atleastin agriculturalsoilsinNordicenvironments,canbeconsideredtobe relativelyslowrelativetotherateofchangesinthetopsoil.
WhencalculatingthecontributionofmaizetoSOC,theisotopic effect of atmospheric CO2 enrichment (Francey et al.,1999) is
contained,aserror,intheaveragemaize
d
13Csignatureoverthe period of maize cultivation. The isotopic enrichment due to fractionationmentionedbyBalesdentandMariotti(1996)canbe estimatedfromthebarefallowtreatmentas0.0050.001m
yr 1ifsuchaneffectisapproximatedwithalinearrelationshipbetween
d
13Csignatureandtime(Schweizeretal., 1999).Insucharelatively shortperiod as 10years,a linear approximationshouldnot be distinguishablefromamoredetailedexponentialapproximation such as the Rayleigh equation (Balesdent and Mariotti, 1996; Menichettietal.,2014).Over10yearsitcanthereforeberegarded as quite small, given also thedifference betweenthe two end members(C3andC4signatures).In anycase,thisenrichmentiscontainedinthecorrectionappliedtoeachsingletreatment,which considersthechangesin
d
13Csignaturerecordedineachtreatment from1956to1999.Thiscorrectionalsotakescareoftheeffectof thedifferentamendmentsonthed
13Csignature.Theaverageretentioncoefficientcalculatedformaizematerial over all treatments (0.300.09) was compatible with that
previously calculated by Kätterer et al. (2011). Those authors utilized SOC mass balance and found an average retention coefficient for root-derived C during 53 years of 0.270.09.
Althoughthesetwocoefficientswerecalculatedontwodifferent periodsusingdifferentapproaches,theyareverysimilar.
In general, the retention coefficient of root material seems higher than previously calculated (e.g., Plénet et al.,1993 and
Bolinderetal.,1999).Ourresultsareinlinewiththehypotheses proposed by Rasse et al. (2005), who suggested that besides
Fig.6. ProbabilitydensityofthecontributionofmaizetoSOCinthetopsoilinthe differenttreatmentsduring 10years, 1999–2009. Eachprobability density is calculatedfromfourMonteCarloMarkovchainsof250,000runsandexpressesthe probabilitydistributionofthecalibratedvalue.FortreatmentcodesseeTable1.
chemicalprotection, root-derivedC isalsomoreprotectedthan other forms of C inputs due to physicochemical and physical interactions.Inparticular,theCcontainedinroothairs,associated mycorrhizaeandfinerootsisconsideredtoenterthesoildirectlyat thescaleofphysicallyprotectedCinsideaggregatesorfinepores (Rasseetal.,2005;Mendez-Millanetal.,2010).Rootgrowthalso actively structures the soil and it is able to promote soil aggregationandcoatingformationaroundtheroots,whichcould contributeto subsequent SOC stabilization.The retention
coef-ficientsof roots weregenerally alsohigher than those of non-humifiedamendmentssuchasstraw,sawdustorgreenmanure,as foundpreviouslybyKättereretal.(2011),suggestingthatroots contributemorethantheseamendmentstoSOCformation.This
finding is in line with the above-mentioned hypotheses, as C originatingfromamendmentswouldlackthephysicalprotection thatrootChas.
Calculatingaspecificretentioncoefficientforeachtreatment allowedustodiscusseventualdifferencesbetweenthedifferent fertilisationregimesandtoexploremoreindetailsthelimitations of a uniform allometric function for every treatment. Some treatments (unfertilized, straw and green manure) which pro-ducedrelativelylow yields(Table 1)alsogavea slightlyhigher retentioncoefficientformaizerootsthantreatmentswithhigher yields(Table2).Thisobservationcouldindicatesomekindofstress factor,possiblyrelatedtonutrientdeficiencieswithinroottissues oreveninthesoilthatmighthaveinfluencedthedecomposability oftherootmaterialduringthefirstdecade(Freschetetal.,2012).In amorelong-termperspective,however,nitrogenlimitationmay ratherleadtolowermicrobialsubstrateuseefficiencyandlowerC retention(Poeplauetal.,2015).ThisissupportedbytheeffectofN fertilization on straw C retention observed in the Ultuna experiment. During the period 1956–1999 with only C3-crops,
yieldswereinaverage91%higherinN-fertilized(treatmentCand G)compared tounfertilizedtreatments irrespectiveof whether strawwasaddedornot(BandF).Thus,itisreasonabletoassume thattheroot-derivedCcontributiontoSOCwasverysimilarinthe treatmentpairsC/BandG/F.Nevertheless,totalCstocksinGwere about10MghigherthaninFwhereasthoseinCwereonly5Mg higherthaninB(Table2).Consequently,theretentionofstrawC was higherin Gthanin F.Inabsoluteamounts,strawaddition resultedin16MgmoreSOCinGcomparedwithCbutonlyin11Mg moreinFthaninB.
Factors generating a non-linear response of yield to C accumulation caused by nutrient deficiencies seemed present, butonlyinextremecases.Thelogarithmicrelationshipbetween maize-derivedC and yieldresultedonly ina marginallyhigher coefficientofdetermination(R2=0.54)thanalinearrelationship
(R2=0.52) (Fig. 5). This supports the validity of the linear
relationship between roots and yields proposed by Bolinder etal.(2007) incaseoflow yields,althoughsuchcoefficientsof determinationsmightbeconsideredperfectlyacceptableorreally lowdependingonthepurposeofthestudy.Assuminganuniform root:shootvalueseemsaviableapproachincaseoflackofdata,but onemust bearin mindthelimitationsassociated withsuchan approach.
Wealso observed correlations betweenretention coefficient and certain phospholipid fatty acid (PLFA) classes previously
measured inthesamesitebyBörjessonet al.(2011).TwoPLFA classes indicating Gram-negative bacteria(16:1
v
7 and 16:1v
9), whichareconsideredtobelessefficientdecomposersthan Gram-positivebacteria(ZoggandZak,1997),werefoundtobenegatively correlated with the retention coefficient (r= 0.2 and r= 0.4, respectively). Class 18:2, which is commonly associated with fungal cells(BååthandAnderson,2003), wasinsteadpositively correlated withtheretention coefficient (r=0.6).A multivariate analysis(PCA) pointed out similarcorrelations. It is difficultto drawpreciseconclusionsfromtheserelationships,sincethetwo datasetsarecomingfromtwodifferentyearsalthoughfromthe same experimentalfield.Butalsotheseresultssuggesta direct relationshipofmicrobialecologyandSOCmineralizationandits interactionwithagriculturalpractices.5.Conclusions
ApplicationoforganicamendmentsandNfertilisationinthe Ultunalong-termexperimentalplotssubstantiallyaffectedSOCin thetopsoil,givingrisetoa4timesrangeincarbonstock.Below thisdepthasignificantaccumulationofCdownto35cmdepth wasonlyfoundinrecalcitrantorprocessedamendmentssuchas peatandsewagesludge,thetwotreatmentswhichalsohadthe largest accumulation in the topsoil. In contrast, the physical conditionsin deepersoil layerswereaffected inseveralof the treatments.Maizeroots significantlycontributedtoSOCin the topsoil after 10 yearsof cultivation, and contributed approxi-mately4–8%ofthenewlyformedSOCthroughrhizodeposition.
However, SOC accumulation in most of the subsoil was not detectableafter10years.TheSOCbelow40cmdepthshowedan averageage>1500years,suggestingagainthatSOCindeepersoil layers is influenced quite slowly by changes in the topsoil. However, since organic matter stored in the subsoil may decompose slower than in the topsoil,C accumulation in the subsoilinducedfor exampleby deep-rootingvarietiesof crops remainsapromisingstrategyforCsequestration.
ThecontributionofrootstoSOCwassimilartothatreported recentlyusinganothermethodology.Rootscontributedrelatively moretoSOCthanthesamemassofcarbonderivedfrom above-groundplantmaterial.Theseresultssuggestthat root contribu-tions to SOCare oftenunderestimated and that root-derivedC should be considered one of the most effective inputs for C sequestrationinsoil.
Acknowledgements
Wearegratefultoformercolleagues,especiallyOlle Gunnars-son,HansNömmikandJanPerssonforstartingandkeepingthis experiment runningdespiteseveral threatsof closure.Pär Hill-strömhasmanagedtheexperimentoverthelast25years.Financial supportforkeepingthelong-termexperimentandforthepresent study was provided by the Faculty of Natural Resources and AgriculturalSciencesatSLU.
AppendixA
SeeTablesA1andA2
Table A2
d13C signature (m) in the experimental treatments at different depths with standard error (n= 4). Superscript letters represent the groups identified by a Tukey’s HSD test (a= 0.1). NA = not available. For treatment codes A–O see
Table 1.
Treatment 0–15 15–17.5 17.5–20 20–22.5 22.5–25 25–27.5 27.5–30 30–35 35–40 40–50 50–60
A 25.450.31ab 25.250.53a 25.140.30a 25.250.24a 25.250.19a 25.000.29a 25.650.11a 25.740.13a 25.570.17a 25.670.14a 25.750.20a
B 25.720.09ab 25.510.21a 25.610.10ab 25.930.15ab 25.90.12a 25.830.14a 25.220.44a 25.330.15a 25.380.17a 25.530.42a NA
C 25.270.23a 25.540.10a 25.780.31ab 25.160.26a 25.270.14a 25.310.23a 25.530.10a 25.040.35a 25.240.29a 25.250.3 +a 26.430.33a
F 25.840.30ab 25.930.23a 25.970.19ab 25.730.22ab 25.240.81a 25.390.34a 25.040.49a 24.890.5a 24.610.88a 24.990.02a 25.430.21a
G 26.210.11b 26.210.35a 26.360.20b 26.060.27ab 26.10.15a 25.60.30a 25.650.31a 25.830.07a 25.570.23a 25.260.2 +a 25.220.1 +a
H 25.790.24ab 25.840.13a 25.760.26ab 25.570.09ab 26.060.11a 25.80.10a 25.610.17a 25.840.12a 25.320.13a 25.460.26a 25.740.18a
J 26.65NAb 26.040.41a 26.290.21b 26.330.28b 25.990.30a 26.080.17a 25.850.26a 25.940.12a 25.580.14a 25.480.04a 25.78NAa
M 25.80.12ab 25.760.13a 25.760.06ab 26.040.15ab 25.90.08a 25.610.32a 25.950.19a 25.560.09a 25.370.27a 25.36NAa 25.780.07a
N 25.420.07ab 25.290.03a 25.60.02ab 25.590.27ab 25.540.09a 25.210.26a 24.880.23a 25.080.38a 25.110.23a 24.590.15a 24.860.14a
O 25.470.07ab 25.610.25a 25.310.14a 25.420.18ab 25.960.33a 25.360.25a 25.520.39a 24.971.11a 25.240.02a 25.230.24a 25.090.47a
Table A1
Carbon concentrations (%) in the experimental treatments at different depths with standard error (n= 4). Superscript letters represent the groups identified by a Tukey’s HSD test (a= 0.1). NA = not available. For treatment codes A–O seeTable 1.
Treatment 1–15 15–17.5 17.5–20 20–22.5 22.5–25 25–27.5 27.5–30 30–35 35–40 40–50 50–60 A 0.890.11e 0.880.10e 0.900.05d 0.910.08c 0.930.04b 0.780.01b 0.780.03b 0.710.07c 0.730.10a 0.620.08a 0.510.11a
B 1.020.11de 1.060.12de 0.910.13d 0.980.17c 0.970.18ab 0.840.10b 0.80.11ab 0.780.04bc 0.740.11a 0.700.09a NA
C 1.300.15cde 1.310.12cde 1.280.07cd 1.140.03bc 0.930.05b 0.870.05b 0.830.09ab 0.760.05c 0.640.08a 0.520.07a 0.370.02a
F 1.630.04cd 1.60.03bcde 1.330.12cd 1.220.10bc 1.030.13ab 0.940.05ab 0.790.03ab 0.780.09bc 0.690.09a 0.590.04a 0.480.05a
G 1.970.17c 1.890.24bcd 1.570.18bcd 1.490.14abc 0.970.09ab 0.950.08ab 0.920.12ab 1.210.19a 0.780.14a 0.690.16a 0.790.45a
H 1.750.12cd 1.790.07bcd 1.430.09cd 1.420.03abc 1.060.07ab 0.970.05ab 0.890.07ab 0.840.04abc 0.510.14a 0.430.07a 0.340.07a
J 2.31NAbc 2.020.18bcd 1.870.18bc 1.780.38ab 1.440.21ab 1.100.17ab 0.940.08ab 0.920.09abc 0.940.16a 0.750.05a 0.4NAa
M 3.790.15a 4.060.15a 3.300.35a 1.660.41abc 1.530.19a 1.090.05ab 0.990.08ab 1.140.08ab 0.990.12a 0.98NAa 0.910.07a
N 2.130.18c 2.190.04bc 1.420.05cd 1.210.12bc 1.130.09ab 0.990.08ab 0.760.12b 1.000.09abc 0.650.13a 0.560.08a 0.50.11a
O 3.010.14b 2.630.44b 2.270.25b 1.910.12a 1.520.18ab 1.320.14a 1.160.11a 1.040.07abc 0.740.01a 0.790.07a 0.70.08a
L.
Menichetti
et
al.
/
A
griculture,
Ecosystems
and
En
vironment
20
0
(20
15)
79
–
References
Balesdent,J.,Mariotti,A.,1996.Measurementofsoilorganicmatterturnoverusing 13Cnaturalabundance.In:Yamasaki,S.,Boutton,T.(Eds.),MassSpectrometryof Soil.M.Dekker,NewYork,pp.47–82.
Bååth,E.,Anderson,T.,2003.Comparisonofsoilfungal/bacterialratiosinapH gradientusingphysiologicalandPLFA-basedtechniques.SoilBiol.Biochem.35, 955–963.
Barré,P.,Eglin,T.,Christensen,B.,Ciais,P.,Houot,S.,Kätterer,T.,VanOort,F.,Peylin, P.,Poulton,P.,Romanenkov,V.,Chenu,C.,2010.Quantifyingandisolatingstable soilorganiccarbonusinglong-termbarefallowexperiments.Biogeosciences7, 3839–3850.
Bergkvist,P.,Jarvis,N.,Berggren,D.,Carlgren,K.,2003.Long-termeffectsofsewage sludgeapplicationsonsoilproperties:cadmiumavailabilityanddistributionin arablesoil.Agric.Ecosyst.Environ.97,167–179.
Bird,M.A.,Kracht,O.B.,2003.Theeffectofsoiltextureandrootsonthestablecarbon isotope.Aust.J.SoilRes.41,77–94.
Blagodatskaya,E.,Yuyukina,T.,Blagodatsky,S.,Kuzyakov,Y.,2011.Turnoverofsoil organicmatterandofmicrobialbiomassunderC3–C4vegetationchange: considerationof13Cfractionationandpreferentialsubstrateutilization.Soil Biol.Biochem.43,159–166.
Bolinder,M.,Angers,D.,Giroux,M.,Laverdiere,M.,1999.EstimatingCinputs retainedassoilorganicmatterfromcorn(ZeamaysL.).PlantSoil85–911996.
Bolinder,M.,Janzen,H.,Gregorich,E.,Angers,D.,VandenBygaart,A.,2007.An approachforestimatingnetprimaryproductivityandannualcarboninputsto soilforcommonagriculturalcropsinCanada.Agric.Ecosyst.Environ.118, 29–42.
Börjesson,G.,Menichetti,L.,Kirchmann,H.,Kätterer,T.,2011.Soilmicrobial communitystructureaffectedby53yearsofnitrogenfertilizationanddifferent organicamendments.Biol.Fertil.48,245–257.
Chabbi,A.,Kögel-Knabner,I.,Rumpel,C.,2009.Stabilizedcarboninsubsoilhorizons islocatedinspatiallydistinctpartsofthesoilprofile.SoilBiol.Biochem.41, 256–261.
Eglin,T.,Ciais,P.,Piao,S.L.,Barre,P.,Bellassen,V.,Cadule,P.,Chenu,C.,Gasser,T., Koven,C.,Reichstein,M.,Smith,P.,2010.Historicalandfutureperspectivesof globalsoilcarbonresponsetoclimateandland-usechanges.Tellus:Ser.B62, 700–718.
Eriksson,J.A.,1999.Land-usehistoryinGamlaUppsala.LaborativArkeologi12, 25–34.
FAOstatisticaldatabase,FAOSTAT,http://faostat.fao.org/,(accessed25.03.2013).
Francey,R.,Allison,C.,Etheridge,D.,Trudinger,C.,Enting,I.,Leuenberg,M., Lagenfelds,R.,Michel,E.,Steele,L.,1999.A1000-yearhighprecisionrecordof
d13CinatmosphericCO2.Tellus:Ser.B51,170–193.
Freschet,G.,Aerts,R.,Cornelissen,J.,2012.Aplanteconomicsspectrumoflitter decomposability.Funct.Ecol.26,56–65.
Gerzabek,M.,Pichlmayer,F.,Kirchmann,H.,Habernauer,G.,1997.Theresponseof soilorganicmattertomanureamendmentsinalong-termexperimentat Ultuna,Sweden.Eur.J.SoilSci.48,273–282.
Jenkinson,D.S.,Coleman,K.,2008.Theturnoveroforganiccarboninsubsoils:part 2modellingcarbonturnover.Eur.J.SoilSci.59,400–413.
Jenkinson,D.S.,Poulton,P.R.,Bryant,C.,2008.Theturnoveroforganiccarbonin subsoils:part1.Naturalandbombradiocarboninsoilprofilesfromthe Rothamstedlong-termfieldexperiments.Eur.J.SoilSci.59,391–399.
IUSSWorkingGroup,2007.Worldreferencebaseforsoilresources2006,first update2007.WorldSoilResourcesReportsNo.103.FAO,Rome.
Jobbagy,E.,Jackson,R.,2000.Theverticaldistributionofsoilorganiccarbonandits relationtoclimateandvegetation.Ecol.Appl.10,423–436.
Kätterer,T.,Bolinder,M.,Andrén,O.,Kirchmann,H.,Menichetti,L.,2011.Roots contributemoretorefractorysoilorganicmatterthanabovegroundcrop residues:asrevealedbyalong-termfieldexperiment.Agric.Ecosyst.Environ. 141,184–192.
Kätterer,T.,Bolinder,M.,Berglund,K.,Kirchmann,H.,2013.Strategiesforcarbon sequestrationinagriculturalsoilsinnorthernEurope.ActaAgric.Scand.Sect.A 1–18May2013.
Kätterer,T.,Börjesson,G.,Kirchmann,H.,2014.Changesinorganiccarbonintopsoil andsubsoilandmicrobialcommunitycompositioncausedbyrepeated additionsoforganicamendmentsandNfertilisationinalong-termfield experimentinSweden.Agric.Ecosyst.Environ.189,110–118.
Kirchmann,H.,Schön,M.,Börjesson,G.,Hamnér,K.,Kätterer,T.,2013.Propertiesof soilsintheSwedishlong-termfertilityexperiments:VII.Changesintopsoiland uppersubsoilatÖrjaandForsafter50yearsofnitrogenfertilizationand manureapplication.ActaAgric.Scand.Sect.B63,25–36.
Kirschbaum,M.U.F.,2000.Willchangesinsoilorganiccarbonactasapositiveor negativefeedbackonglobalwarming?Biogeochemistry48,21–51.
Lal,R.,2004.Soilcarbonsequestrationtomitigateclimatechange.Geoderma123, 1–2.
Lorenz,K.,Lal,R.,2005.Thedepthdistributionofsoilorganiccarboninrelationto landuseandmanagementandthepotentialofcarbonsequestrationinsubsoil horizons.Adv.Agron.88,35–66.
Mendez-Millan,M.,Dignac,M.-F.,Rumpel,C.,Rasse,D.P.,Derenne,S.,2010. Moleculardynamicsofshootvs.rootbiomarkersinanagriculturalsoil estimatedbynaturalabundance13Clabeling.SoilBiol.Biochem.42,169
–177.
Menichetti,L.,Ekblad,A.,Kätterer,T.,2013.Organicamendmentsaffectd13C signatureofsoilrespirationandsoilorganicCaccumulationinalong-termfield experimentinSweden.Eur.J.SoilSci.64,621–628.
Menichetti,L.,Huoot,S.,vanOort,F.,Kätterer,T.,Christensen,B.T.,Chenu,C.,Barré, P.,Vasilyeva,N.A.,Ekblad,A.,2014.Increaseinsoilä13Crelatestolossoforganic carbon:resultsfromfivelong-termbarefallowexperiments.Oecologia doi: http://dx.doi.org/10.1007/s00442-014-3114-4inpress.
Parnell,A.C.,Inger,R.,Bearhop,S.,Jackson,A.L.,2010.Sourcepartitioningusing stableisotopes:copingwithtoomuchvariation.PLoSOne5,e9672.
a,PaulE.,Follett,R.F.,Leavitt,S.W.,Halvorson,A.,Peterson,G.A.,Lyon,D.J.,1997. Radiocarbondatingfordeterminationofsoilorganicmatterpoolsizesand dynamics.SoilSci.Soc.Am.J.61,1058–1067.
Peel,M.,Finlayson,B.,McMahon,T.,2007.UpdatedworldmapoftheKöppen–
Geigerclimateclassification.Hydrol.EarthSyst.Sci.11,1633–1644.
Plénet,D.,Lubet,E.,Juste,C.,1993.Évolutionàlongtermedustatutcarbonédusol enmonoculturenonirriguéedumaïs(ZeamaysL.).Agronomie13,685–698.
Plummer,M.,2003.JAGS:aprogramforanalysisofBayesiangraphicalmodelsusing Gibbssampling.Proceedingsofthe3rdInternationalWorkshoponDistributed StatisticalComputing(DSC2003),March20–22,Vienna,Austria.
Poeplau,C.,Don,A.,Vesterdal,L.,Leifeld,J.,VanWesemael,B.,Schumacher,J., Gensior,A.,2011.Temporaldynamicsofsoilorganiccarbonafterland-use changeinthetemperatezone–carbonresponsefunctionsasamodelapproach. GlobalChangeBiol.17,2415–2427.
Poeplau,C.,Kätterer,T.,Bolinder,M.a.,Börjesson,G.,Berti,A.,Lugato,E.,2015.Low stabilizationofabovegroundcropresiduecarboninsandysoilsofSwedish long-termexperiments.Geoderma246–255237–238.
Powell,T.,Lenton,T.,2012.Futurecarbondioxideremovalviabiomassenergy constrainedbyagriculturalefficiencyanddietarytrends.EnergyEnviron.Sci.5, 8116–8133.
Rasse,D.P.,Rumpel,C.,Dignac,M.-F.,2005.Issoilcarbonmostlyrootcarbon? Mechanismsforaspecificstabilization.PlantSoil269,341–356.
RDevelopmentCoreTeam.,2011.R:Alanguageandenvironmentforstatistical computing.(eds.RFoundationforStatisticalComputing).Vienna.Retrieved fromhttp://www.r-project.org/.
Rethemeyer,J.,Kramer,C.,Gleixner,G.,John,B.,Yamashita,T.,Flessa,H.,Andersen, N.,Nadeau,M.-J.,Grootes,P.M.,2005.Transformationoforganicmatterin agriculturalsoils:radiocarbonconcentrationversussoildepth.Geoderma128, 94–105.
Schweizer,M.,Fear,J.,Cadisch,G.,1999.Isotopic(13C)fractionationduringplant residuedecompositionanditsimplicationsforsoilorganicmatterstudies. RapidCommun.Mass.Spectrom.13,1284–1290.
Stockmann,U.,a,AdamsM.,Crawford,J.W.,Field,D.J.,Henakaarchchi,N.,Jenkins, M.,Minasny,B.,McBratney,A.B.,DeRemyDeCourcelles,V.,Singh,K.,Wheeler, I.,Abbott,L.,Angers,D.A.,Baldock,J.,Bird,M.,Brookes,P.C.,Chenu,C.,Jastrow,J. D.,Lal,R.,Lehmann,J.,O'Donnell,A.G.,Parton,W.J.,Whitehead,D., Zimmermann,M.,2013.Theknowns:knownunknownsandunknownsof sequestrationofsoilorganiccarbon.Agric.Ecosyst.Environ.164,80–99.
Stuiver,M.,Polach,H.,1977.Discussion:reportingofC-14data.Radiocarbon19, 355–363.
Venables,W.,Ripley,B.,2002.ModernAppliedStatisticswithS.Springer-Verlag.
Wynn,J.G.,Bird,M.I.,2007.C4-derivedsoilorganiccarbondecomposesfasterthan itsC3counterpartinmixedC3/C4soils.GlobalChangeBiol.13,2206–2217.
Zogg,G.,Zak,D.,1997.Compositionalandfunctionalshiftsinmicrobial communitiesduetosoilwarming.SoilSci.Soc.Am.J.61,475–481.