DESIGN RESEARCH ON MATHEMATICS EDUCATION:
INVESTIGATING THE DEVELOPMENT OF INDONESIAN FIFTH
GRADE STUDENTS IN LEARNING PERCENTAGES
A THESIS
Submitted in Partial Fulfilment of the Requirements for the Degree of Master of Science (M.Sc)
in
International Master Program on Mathematics Education (IMPoME) Faculty of Teacher Training and Education Sriwijaya University (In Collaboration between Sriwijaya University and Utrecht University)
By:
Yenny Anggreini Sarumaha NIM 20102812003
FACULTY OF TEACHER TRAINING AND EDUCATION
SRIWIJAYA UNIVERSITY
ii
APPROVAL PAGE
Research Title : Design Research on Mathematics Education:
Investigating the Development of Indonesian Fifth Grade Students in Learning Percentages
Student Name : Yenny Anggreini Sarumaha Student Number : 20102812003
Study Program : Mathematics Education
Approved by:
Supervisor I,
Dr. Ratu Ilma Indra Putri, M.Si
Supervisor II,
Dr. Yusuf Hartono
Head of
Mathematics Education Department
Prof. Dr. Zulkardi, M.I.Komp., M.Sc NIP 19610420 198603 1 002
Dean of Faculty of Teacher Training and Education
Prof. Dr. Tatang Suhery, M.A., Ph.D NIP 19590412 198403 1 002
iii
DESIGN RESEARCH ON MATHEMATICS EDUCATION:
INVESTIGATING THE DEVELOPMENT OF INDONESIAN FIFTH GRADE STUDENTS IN LEARNING PERCENTAGES
A THESIS
Submitted in Partial Fulfillment of the Requirements for Degree of Master of Science (M.Sc)
In
International Master Program on Mathematics Education (IMPoME) Faculty of Teacher Training and Education Sriwijaya University (In Collaboration between Sriwijaya University and Utrecht University)
By:
Yenny Anggreini Sarumaha NIM 20102812003
This Thesis had been examined on May 15th, 2012
Examination Committee Signature
1. Dr. Ratu Ilma Indra Putri, M.Si ____________________
2. Dr. Yusuf Hartono ____________________
3. Prof. Dr. Zulkardi, M.I.Komp., M.Sc ____________________
4. Dr. Darmawijoyo ____________________
5. Dr. Somakim, M.Pd ____________________
FACULTY OF TEACHER TRAINING AND EDUCATION SRIWIJAYA UNIVERSITY
iv
STATEMENT PAGE
I hereby,
Name : Yenny Anggreini Sarumaha
Place of Birth : Padang
Date of Birth : January 22nd, 1988 Academic Major : Mathematics Education
State that:
1. All the data, information, analyses, and the statements in analyses and conclusions that are presented in this thesis, except from reference source are the results of my observations, researches, analyses, and views with the guidance of my supervisors.
2. The thesis that I had made is original of my mind and had never been presented and proposed to get any other degree from Sriwijaya University or other universities.
This statement was truly made and if in other time that found any fouls in my statement above, I am ready to get any academic sanctions such as cancelation of my degree that I have got through this thesis.
Palembang, May 16th, 2012 The one with the statement,
v
Abstract
Many prior researchers found that percent is hard to teach and hard to learn. It was revealed that many students are confused with the meaning of percent itself. They also cannot see the relation amongst percentages, fractions, decimals, ratios, and proportions. They tend to solve percentage problems using the formal way but become confused in using it when the contexts of problems are changed. For those reasons, a set of instructional activities was designed to help students to find out the meaning of percentages in many situations and to construct a model which help them to solve the percentage problems. This present study is aimed to develop a local instructional theory to support students‘ development of basic understanding of percentage. In the light of it, design research was chosen as an appropriate mean to achieve the goal. It was held in Pusri Primary School Palembang, grade 5 involving 42 students in total and one classroom teacher. In addition, Pendidikan Matematika Realistik Indonesia (PMRI) which was adapted from Realistic Mathematics Education (RME) was deliberately chosen as the approach in the teaching-learning process in the classroom. This study revealed that using some contexts in learning percentages supports students to understand the meaning of percentages itself. By understanding the meaning of percentages in the context, students become easier to find clues how to solve percentage problems. A percentage bar which is served as a model in this study helps students in learning. Some students use it as a tool for reasoning and also as a tool for calculating, since they realize the benchamrk numbers of percent are easy to calculate using the bar. Other students, who usually use the formal way to solve percentage problem, use the bar as another way to prove the result. Besides, they also can use it to figure out how many out of hundred of the percent asked.
vi
RINGKASAN
Yenny Anggreini Sarumaha. Design Research on Mathematics Education: Investigating the Development of Indonesian Fifith Grade Students in Learning Percentages.
Persen adalah salah satu topik yang diajarkan di kelas 5 Sekolah Dasar pada semester kedua di Indonesia. Seyogyanya, topik ini tidak terlepas dari pembahasan mengenai pecahan karena persen sendiri adalah pecahan khusus dengan penyebut 100. Persen juga memiliki kaitan erat dengan desimal dan proporsi atau rasio. Penggunaan persen dalam kehidupan sehari-hari juga tak terhitung banyaknya, misalnya dalam jual beli kita kenal dengan diskon, dalam hal menabung di bank atau membayar angsuran kita kenal dengan konsep bunga, dan lain sebagainya. Namun demikian, beberapa penelitian yang telah dilakukan menunjukkan bahwa banyak ditemukan pada siswa sekolah dan orang dewasa kesalahan dalam penggunaan persen dan perhitungan yang melibatkannya. Lee (1998) dalam penelitiannya menemukan bahwa siswa sering mengalami kesulitan dalam memahami konsep dari persen dan mengaplikasiakannya dalam pemecahan masalah. Reinup (2010) mengemukakan bahwa karena dalam kesehariannya siswa telah diberikan langkah formal bagaimana cara menyelesaikan masalah tentang persen, maka siswa cenderung mengikuti. Hal ini berdampak pada rendahnya kreativitas siswa untuk menemukan pendekatan lain yang bisa digunakan dalam pemecahan masalah.
Untuk itu dirasakan perlu adaya perbaikan agar pemahaman tentang persen dapat dicapai oleh siswa. Salah satu usaha yang bisa dilakukan adalah dengan mengupayakan kegiatan pembelajaran yang terencana dan dapat menjadikannya bermakna bagi siswa. Dalam penelitian ini digunakan pendekatan PMRI yang merupakan adaptasi dari pendekatan RME, (Sembiring, Hoogland, & Dolk, 2010). PMRI memuat tentang penggunaan konteks dan model dalam membantu siswa untuk memahami pelajaran. Konteks yang digunakan dalam penyampaian materi persen ini adalah konteks kegiatan sehari-hari yang dilakukan oleh siswa antara lain, diskon pembelian, komposisi makanan yang tertera pada kemasan, penonton acara pertunjukkan, pendukung olahraga di stadion, dan lain sebagainya. Sedangkan model yang dituju adalah model batang persen. Model adalah suatu alat yang menjembatani dan membantu siswa berkembang dari tahap informal ke tahap formal. Salah satu hal penting dari penggunaan model menurut Van den Heuvel-Panhuizen (2003) adalah model merupakan sebuah jawaban tentang bagaimana siswa-siswa dapat belajar tentang persen.
vii
Pada penelitian ini, untuk membantu jalannya proses pembelajaran di kelas, dirancanglah kegiatan instruksional berikut dengan hipotesis tentang trayek belajar siswa. Untuk memperoleh pemahaman dasar mengenai persen, peneliti merancang 6 kegiatan instruksional. Selain itu, pada pelaksanaannya di kelas, siswa akan lebih banyak bekerja dalam kelompok dan akan ada diskusi kelas setelah selesai menyelesaikan sebuah permasalahan. Siswa tidak diajarkan cara menyelsaikan masalah yang berkaitan dengan persen dan mereka diberi kebebasan memilih cara yang digunakan untuk menyelesaikan permasalahan tersebut. Siswa juga diberikan tes awal dan tes akhir yang akan digunakan sebagai salah satu cara membandingkan pemahaman siswa sebelum dan setelah mengikuti proses pembelajaran.
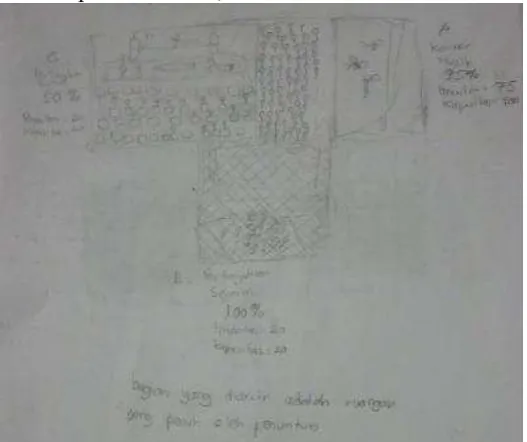
Kegiatan pertama siswa adalah eksplorasi penggunaan persen dalam kehidupan sehari-hari. Siswa dalam kelompoknya diminta membawa dan membuat poster berupa tempelan-tempelan dari produk-produk yang memuat persen, seperti kemasan plastik makanan, minuman, katalog belanja, dan lain-lain. Tidak ada kesulitan yang ditemui siswa dalam pelaksanaannya. Kegiatan kedua saat siswa dihadapkan dengan masalah yang meminta alasan atas jawaban yang diberikan, mereka mengalami sedikit kesulitan. Sebagian besar dari mereka menuliskan jawaban tanpa memberikan penjelasan bagaimana mereka memperoleh jawaban. Hai ini juga menjadi hambatan jalannya diskusi kelas karena siswa banyak yang merasa enggan untuk menyuarakan pendapatnya walaupun mereka mengetahui jawaban yang ditanya. Siswa telah mengenal beberapa nilai persen yang mudah seperti 50 persen, 25 persen, dan 10 persen. Hal ini ditunjukkan dari hasil kegiatan ketiga, dimana siswa diminta menggambarkan nilai persen yang mereka pahami pada sebuah bangun datar. Sebagian siswa bahkan telah mampu melihat adanya hubungan antara persen dan pecahan, seperti menuliskan 25 persen = ¼.
Kegiatan ketiga ini merupakan kegiatan penting dimana siswa selanjutnya menggunakan model berupa persegi panjang yang dikenal dengan batang persen untuk memahami dan menyelesaikan masalah persen. Penelitian ini juga menunjukkan bahwa dengan mengkonstruksi model, kemampuan berfikir siswa memahami materi persen berkembang. Dalam prakteknya pada kegiatan empat dan lima, siswa masih cenderung menggunakan cara formal dalam menyelesaikan masalah yang berkaitan dengan persen. Tapi tidak jarang mereka menemui kesulitan dan kemudian beralih menggunakan batang persen. Sebagian siswa menggunakan batang persen hanya sebagai alat untuk bernalar atau memvisualisasikan nilai persen tertentu. Sebagian siswa lainnya menjadikan batang persen sebagai alat untuk menghitung karena kemudahannya dalam menyelesaikan nilai persen yang mudah. Namun, sebagian siswa lainnya mampu menggunakan batang persen baik sebagai alat untuk bernalar ataupun sebagai alat untuk menghitung sebagaimana yang diharapkan.
viii
“
If people do not believe that mathematics is simple, it is only because they do not realize
how complicated life is”
-John Louis von
Neumann-This thesis is my special dedication to my family – especially my father, my mother, and my brothers – for their love and never ending support.
ix
PREFACE
I am very thankful to Allah SWT for all things happen in my life. This thesis could not be exist is without innumerable help from many people surrounding me. On this paper I would like to say thanks to all people who supported me in doing my study, gave contribution and inspiration in writing this thesis and helped me in finishing my study.
There were Bu Rima, Bu Dwi, and Bu Ela, the teachers in SD Pusri, who gave a lot of contributions during the teaching experiment and all grade 5 students who involved in this study. I am so glad to be supervised by Barbara Ann van Amerom, Dr. Ratu Ilma, and Dr. Yusuf Hartono because they not only gave supervision and assistance in writing this thesis but also gave courage to make decision in doing my research study. Special thanks to Bapak Ahmad Fauzan who who introduced me to PMRI and who gave me recommendations to the PMRI Team as one of the candidates of the IMPoME 2010 scholarship awardees.
The idea of this study was greatly influenced by Marja van den Heuvel-Panhuizen‘s dissertation. It gave big impression for me. Also my discussion with Jaap den Hertog, Frans van Galen, and Dolly van Eerde. Thank you very much. All staffs and lecturers in Utrecht University who inspire me and motivate me to work harder.
I would never join this program if Prof. Robert Sembiring, Prof. Maarten Dolk and the PMRI Team did not launch this program in 2009. It was Bapak Zulkardi, Bapak Darmawijoyo, and all lecturers and staffs in Mathematics Education Department of Universitas Sriwijaya who gave a lot of helps during my study in Palembang.
Last but not least, I would like to thank to all my friends in IMPoME Utrecht University – Universitas Sriwijaya – Universitas Negeri Surabaya for the days we spent together. I hope we can meet again someday.
.
x
2.2The use of model in learning percentages... 6
2.3Realistic Mathematics Education ... 7
2.4Percentages in Indonesian curriculum ... 10
2.5Emergent perspective ... 11
CHAPTER III: METHODOLOGY 3.1Research approach ... 14
3.2Data collection ... 15
3.3Data analysis ... 20
3.4Research subject and the timeline of the research ... 21
CHAPTER IV: HYPOTHETICAL LEARNING TRAJECTORY 5.1Preliminary teaching experiment ... 45
5.2Improvement of hypothetical learning trajectory ... 53
5.3Teaching experiment ... 54
CHAPTER VI: CONCLUSION AND DISCUSSION 6.1 Conclusion ... 71
6.2 Reflection on the important issues ... 74
6.3 Discussion ... 76
6.4 Further study ... 76
xi
xii
LIST OF TABLES
xiii
LIST OF FIGURES
Figure 2.1. Levels of emergent modeling from situational to formal reasoning ... 9
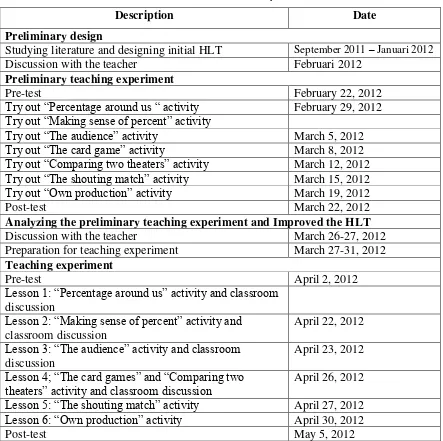
Figure 4.1. Percentage products ... 26
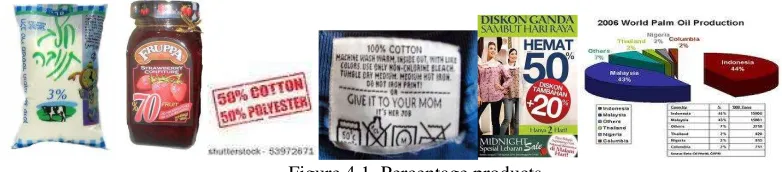
Figure 5.1. Students categorized the products ... 55
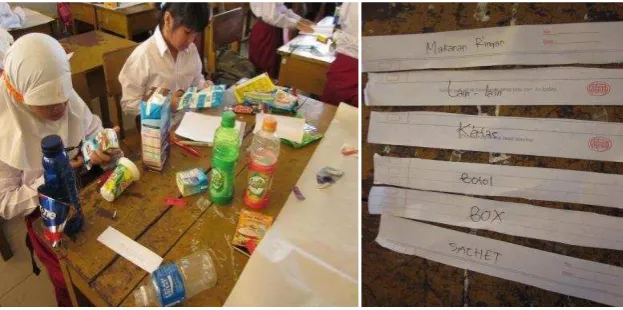
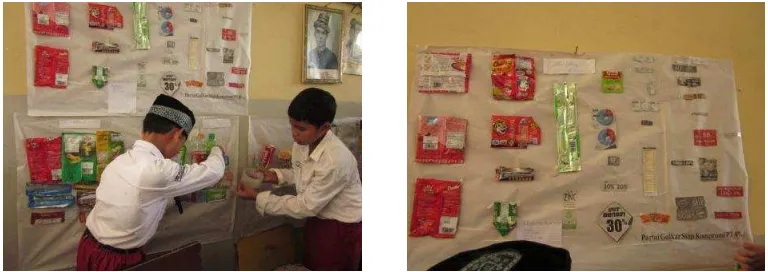
Figure 5.2. Students glued their posters on the wall ... 56
Figure 5.3. Student‘ s worksheet (A) ... 58
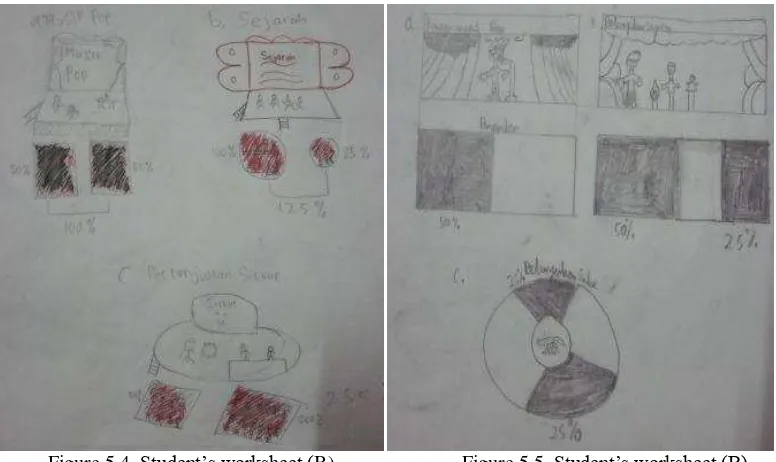
Figure 5.4. Student‘s worksheet (B) ... 59
Figure 5.5. Student‘s worksheet (B) ... 59
Figure 5.6. Students‘ posters ... 61
Figure 5.7. Students‘ worksheet (A) ... 63
Figure 5.8. Students‘ worksheet (B) ... 63
Figure 5.9. Students‘ worksheet (C) ... 64
Figure 5.10. Students‘ answer (A) ... 65
Figure 5.11. Students‘ answer (B) ... 66
Figure 5.12. Students‘ example (A) ... 66
Figure 5.13. Students‘ example (B) ... 66
Figure 5.14. Students‘ example (C) ... 67
Figure 5.15. Students‘ strategies (A) ... 67
Figure 5.16. Students‘ strategies (B1)... 67
Figure 5.17. Students‘ strategies (B2)... 68
xiv
LIST OF APPENDICES
Appendix 1. Teacher Guide ... 80
Appendix 2 The Classroom Observation Scheme. ... 96
Appendix 3. Teacher Interview Scheme ... 98
Appendix 4. Pre-test English version... 99
Appendix 5. Pre-test Indonesian version ... 105
Appendix 6. Rencana Pelaksanaan Pembelajaran ... 109
Appendix 7. Aktivitas Siswa ... 128
1
CHAPTER I INTRODUCTION
Percent is prevalent in our daily life. It is one of the most widely used mathematical concepts. By only reading the newspaper or watching television we can be reminded how abundant the use of percent. It is present in the food we eat (e.g., 10% fat), the clothes we wear (e.g., 100% cotton), the financial transactions we carry out (e.g., 2.5% interest), the things we use (e.g., 80% graphite), the games we play (e.g., 75% hits) and the survey reports that we read (e.g., 30% of the population). Parker and Leinhardt (1995) stated that percent is an interesting, exciting, and even beautiful concept—one that bridges ancient mercantile practices and modern ideas of multiplicative structures and mathematical functions. According to Reys (2007), students understand percent when they can use it in many different ways.
Understanding percentage in fact cannot be separated from fractions, decimals, and proportions. Of course one way to represents proportion is by using percentage. Galen et al. (2008) stated that the relationships between fractions, percentages, decimals, and proportions or ratios can be dealt with in a natural way if we make the context as the central feature in teaching, and give students the chance to explore these contexts in many different ways. Why the relationship is so important here because according to Galen et al. (2008) we can easily change between these forms in everyday situations, which help us to interpret the situation and solve the problem. This relationship also helps us to better understand the numbers.
2
rational numbers and the ways to express ratio and relationships, which can also be expressed using percentages. Students‘ transformation skills are the worst in fraction – percentage transformations, where fractions are used in their classical part-whole sense. The study that was conducted by Lee (1998) resulted that students often find it difficult to conceptualize percent and apply it to solve problems in context. The formal instruction on percent tends to restrict students‘ creativity and flexibility in their approaches to percent problems. His study was not really different from what Reinup did in her study. Both studies provided the concrete exercises for students to solve with the focused on what kind of strategies that students use in solving the different problem. However, the ideas of students‘ understanding about percentages and the relation amongst fractions, decimals, and percentages still need to be revealed.
The study conducted by Parker and Leinhardt (1995) resulted the four reasons why percent is hard to learn. The first reason is because percent is a simple pragmatic expression of ―so many of this for 100 of that‖ propagates many multiple and related meanings. Another
reason is percent has several meanings at the same time. The third reason is percents use an extremely concise linguistic form and the last reason is that percents have been poorly taught such that students have a limited view of the concept as meaning only part of a whole. These reasons indeed related to the teaching and learning process of percentages in the classroom. What have to be considered here is the way how to teach the lesson to students in order to help them attain the insight of learning percentages.
3
essential features of RME is the didactical use of model. One important finding about this model is stated in Van den Heuvel-Panhuizen (2003) as an answer how students can learn percentages. However, this result therefore cannot be seen as a fixed recipe in which students have few options gaining certain insight in learning, but it is a result which the didactical use of models plays a key role. Kachapova & Kachapov (2011) in their study found that a two-way table helped students in solving a word problem about percentages. What is called by a two-way table in their study indeed is what we know as a ratio table. It also serves as a model that helps students in learning percentages.
Nevertheless, those studies also lead to the question about the design of the lesson. How students develop their understanding in learning percentages have to be in the spotlight. This understanding will be developed by the help of a model. In the present study I am going to use Pendidikan Matematika Realistik Indonesia (PMRI) approach which is an adaptation of RME in Indonesian curriculum (Sembiring, Hoogland, & Dolk, 2010) to find out how the model will be constructed from the students. This is also related to the use of contexts in the instructional activities which is relevant with Freudenthal‘s idea that views mathematics as a human activity instead of seeing mathematics as a subject to be transmitted (Freudenthal, 1991). In the light of it the development of students‘ understanding in learning percentages will be one of the main issues.
Considering those issues in teaching and learning percentages, this study aims at developing a grounded theory on percentage, especially for young students age 10 or 11 in 5thgrade. Based on the Indonesian contexts and situations, the researcher aims at developing a local instructional theory to support students‘ development of basic understanding of percentage. The research question of this study is:
4
CHAPTER II
THEORETICAL FRAMEWORK
This chapter provides the theoretical framework that is addressed to construct groundwork of this research study. Literature about percentages is studied to attain the main concepts that are required to solve any problems related to percentage. Moreover, the literature is useful in designing instructional activities in which the main concepts of percentages are taught for children and also in finding how percentage can be connected in daily life.
2.1 Percentage
A key feature of percentage which must be understood in order to have insight into this concept is that a percentage is a relation between two numbers or magnitudes that is expressed by a special ratio, namely ‗so-many-out-of-the-hundred‘ (Van den Heuvel
-Panhuizen, 1996). In learning percentages, students should develop insight into the meaning of percentages through using them, and not solely be given definitions. They must be aware of the fact that percentages are always related to something and cannot be compared without taking this ‗something‘ into account. For example, in order to pass the exam, Lena needed to
answer 50% of the question correctly. However, she was wrong on 12 problems. Should we congratulate her or not?. Since there is no information about the total number of tasks that Lena had to solve in which the percentage is referring, no judgments can be made about Lena‘s result.
De Corte, E., Depaepe, F., Op ‗t Eynde, P & Verschaffel, L, (2005) stated that learning percentages serves different goals, namely computational, conceptual, and application goals. Computational goals are the first goals that should be mastered in which students will
develop their procedural knowledge to compute percentages. It is not enough since these goals are primarily focused on procedures and recall.
5 The third goal is development of skills to apply percentages in all kind of meaningful situations. This goal requires those students‘ procedural (objective I) and conceptual (objective II) knowledge gets interconnected.
There are also some characteristics of percentages which are described by De Corte, E., Depaepe, F., Op ‗t Eynde, P & Verschaffel, L, (2005) that should be discovered by solving appropriate tasks and problems.
1. A percentage expresses a relation between two numbers or quantities by means of a ratio. Students need to aware that percentages are always related to something and have, therefore, no meaning without taking into account.
For example: ―You need 50% correct answers to succeed. Lena solved 12 tasks wrongly. What do you think? Can we congratulate Lena or not?‖
Since the number to which the percentage is referring is missing, no judgment can be made about Lena‘s performance.
2. Percentages describe a fixed situation representing how different kinds of substances are related to each other.
For example: ―Cherry jam which contains 55% of fruit is sold in large (600g) and small pot (300g). Someone forgot to put the percentage of fruit on the small pot. Fill in this missing information. Explain your strategy for finding this percentage. How many grams of fruit does each pot contain? The large one contains?... The small one contains?.. Show how you got your answers.‖
By posing this problem we hope students can overcome the potential misconception that percentages change linearly with the size of the whole.
3. The reduction of adding up of percentages has a non linear character.
For example: ―A whole plus 20% plus 30% is the same as the same whole plus 50%.‖ The decrease or increase of a part behaves asymmetric if it is expressed by percentages. It is caused by the fact that the reference amount changes (in the latter case the reference amount is larger).
4. Percentages can be used to describe two different types of situations. (1) They can describe the substances of a whole. For example: to bake bread we need 68% flour, 30% water, 1% yeast, and 1% butter. (2) They can describe situations about a whole that is increased or decreased with a part.
Considering the goals and the characteristics that have to be considered in the teaching learning percentages, the six instructional activities are designed in such a way. It is more important that students are able to use percentage in a situation in which they are needed. (Van den Heuvel-Panhuizen, 1994).
6
this in this manner, but they have to show an awareness of the fact that percentages are always related to something and that they therefore cannot be compared without taking into account to what they refer (Van den Heuvel-Panhuizen, 1994).
In this study, researcher only focuses on the meaning of percentage as part whole relationship. Researcher only focuses on this meaning because it is the most salient of comparative situations, imaginable for young students in grade 5, and can support students understanding of percentage as relationship based on one-hundred-part whole. In this study, the contextual situations are used as a support in the learning percentage. Those contextual situations are discount, the audience of the performance, the shouting match, and other contextual situations in which percentage play a role.
2.2 The use of model in learning percentages
In learning percentages there are some models that can be used to help students attain the insight of percentage. Models are attributed the role of bridging the gap between the informal understanding connected to the ‗real‘ and imagined reality on the one side, and the
understanding of formal system on the other (Van den Heuvel-Panhuizen, 2003). The most important model for percentages is the bar. Van den Heuvel-Panhuizen (2003), stated that during the process of growing understanding of percentage, the bar gradually changes from a concrete context-connected representation to a more abstract representational model that moreover is going to function as an estimation model, and to model that guides the students in choosing the calculations that have to be made.
7 that it has ―body‖ –area. For children, this part will make them easier to talk in terms of ―the -whole‖ and ―the so-much part‖ of the whole.
Another model that can be used in learning percentages is the double number line. It is a much more abstract model compared with the bar. Working with the model later will lead students to discover the 1% - procedure even though this is not always the easiest way working with this algorithm. Another arithmetic aid in learning percentage is the ratio table. The similarities amongst these three models are they offers the possibility to link numbers and percentages together and they also offers he freedom to make all kinds of interim steps. The difference appears when working with the ratio table, the numbers can be placed in random order. Nevertheless, it gives calculation in more abstract quality, without any support for ―so-much part of the whole‖ – reasoning.
In the present study, some activities are provided to help students construct their own model. The focus of the model that develop during the instructional activities is the percentage bar. 2.3 Realistic Mathematics Education
According to Freudenthal, mathematics should be connected to reality through problem situations. The term ―reality‖ means that the problem situation must be experientially real for
students. In this research, daily situations are set as the contextual problem situations for children to learn percentages.
2.3.1 Five tenets of realistic mathematics education
The process of designing a sequence of instructional activities that starts with experience-based activities in this research was inspired by five tenets for realistic mathematics education defined by Treffers (1987) that are described in the following ways:
1. Phenomenological exploration
8
is experientially real for students. Consequently, this research study employs daily life problems as the contextual situation.
2. Using models and symbols for progressive mathematization
The second tenet of RME is bridging from a concrete level to a more formal level by using models and symbols. Students‘ informal knowledge as the result of experience-based activities needs to be developed into formal knowledge of percentage. The activity shading the area of some shapes is designed to provide opportunity for students in concrete level working in the more formal level in learning percentages.
3. Using students’ own construction
The freedom for students to use their own strategies could direct to the emergence of various solutions that can be used to develop the next learning process. The students‘ strategies in each activity are discussed in the whole class discussion to support students‘ acquisition of
the basic concepts of percentage. The student-made percentage bar serve as the bases for students to realize the best way in modeling percentage problem.
4. Interactivity
The learning process of students is not merely an individual process, but it is also a social process. The learning process of students can be shortened when students communicate their works and thoughts in the social interaction emerging in the classroom. Activity in shading the area of some shapes is the natural situation for social interaction such as students‘
agreement in deciding a shape that can be used to represent percentage. 5. Intertwinement
9
2.3.2 Emergent modeling
The implementation of the second tenet of RME produces a sequence of models that supported what students get from the concepts of percentage.
Emergent modeling is one of the heuristics for realistic mathematics education in which Gravemeijer (1994) describes how models-of a certain situation can become models-for more formal reasoning. The levels of emergent modeling from situational to formal reasoning are shown in the following figure:
4. Formal 3. General 2. Referential 1. Situational
Figure 2.1. Levels of emergent modeling from situational to formal reasoning (Gravemeijer, 1994)
From The Figure 2.1, the implementation of the four levels of emergent modeling in this research is described as follows:
1. Situational level
10
2. Referential level
The use of models and strategies in this level refers to the situation described in the problem or, in other words, referential level is the level of models-of.
A class discussion encourages students to shift from situational level to referential level when students need to make representations (drawings) as the models-of their strategies to show the amount of percent in particular area. This will be developed in the activity shading area. 3. General level
In general level, models-for emerge in which the mathematical focus on strategies dominates over the reference to the contextual problem. Students then gradually move from the percentage bar to the use of double number lines. However, percentage bar also can serve as model for in learning percentage. But if it is compared to double number lines, percentage bar is the concrete one.
4. Formal level
In formal level, reasoning with conventional symbolizations is no longer dependent on the support of models-for mathematics activity. The focus of the discussion moves to solving application situations in many different ways.
2.4 Percentages in the Indonesian Curriculum
11
Standard Competence Basic Competence
5. Using fraction in solving problems 5.1 Converting fraction to percentage and decimal form and vice versa
5.2 Adding and Subtracting many form of fraction 5.3 Multiplying and dividing many form of fraction 5.4 Using fraction in solving proportion and ratio problems.
In this curriculum the topic about percentages is included in the first basic competence, namely changing fractions to percent and decimal forms and vice versa In other words, this topic cannot be separated from learning fractions and decimal. Since the topics related each other, it is not surprising in the reality only short time will be allocated to conduct each topic. This situation leads to the process of learning which directly go to the formal way. Students are taught using the procedure and algorithm that can be used to solve percentage problem without meaning of percentage itself. Considering this fact learning mathematics becomes meaningless if no action taken here. There will be a need to support students‘ development of understanding of percentage in which this research intended to.
2.5 Emergent Perspective
Gravemeijer & Cobb (2006) stated that a key element in the ongoing process of experimentation is the interpretation of both the students‘ reasoning and learning and the means by which that learning is supported and organized. They contend that it is important to be explicit about how one is going about interpreting what is going on in the classroom. Before starting the process of learning, it is conjectured that the students have their own belief about their own roles, the others‘ roles, the teacher‘s roles and the mathematics that
students learn. In this study, during the process of learning, the teacher initiates and develops the social norms that sustain classroom culture characterized by explanation and justification of solution, and argumentation: attempting to make sense of explanation given by others, indicating agreement and disagreement, and questioning alternatives in solutions in which a
12
conflict in interpretation or solution has become apparent (Gravemeijer & Cobb, 2006). The framework used for interpreting classroom discourse and communication is the emergent perspective.
Table 2. An interpretative framework for analyzing individual and collective activity at the classroom level (Gravemeijer & Cobb, 2006)
Social Perspective Psychological Perspective
Classroom social norms Beliefs about our own role, others‘ roles, and the general nature of mathematical activity
Socio-mathematical norms Specifically mathematical beliefs and values Classroom mathematical practices Mathematical conceptions and activity
According to Gravemeijer & Cobb (2006), there are three aspects of emergent perspective that are elaborated. The explanation and discussion of these aspects is relatively brief because the aim is to develop the rationale for the theoretical framework rather than to present detailed analyses of these aspects.
The first aspect of emergent perspective is the social norms that are established in the classroom. Social norms refer to the expected ways of acting and explaining that is established through negotiation between the teacher and students. The examples of social norms are obligations for students to explain and justify solutions in front of the class, to make sense of explanation given by other students, and to give opinion indicating agreement and disagreement.
13
The last social aspect of emergent perspective is classroom mathematical practices. Classroom mathematical practice refers to the normative ways of acting, communicating, symbolizing mathematically that are specific to particular mathematical ideas or concepts. Students interpretation or ideas about percentage, the way they make a visual model of percentage, and the way they work with percentage will be analyzed.
According to the discussion of the framework, the general research question in this study is elaborated into two specific sub questions as follows.
1. How can contexts support student’s understanding of the meaning of percentages?
14
CHAPTER III METHODOLOGY
The issues that will be discussed in this chapter are: (1) design research methodology, (2) data collection, including the preparation phase, preliminary teaching experiment, teaching experiment, post test, and validity and reliability of the data, (3) data analysis, including pre test, preliminary teaching experiment, teaching experiment, and post test.
3.1 Research approach
Gravemeijer & Cobb, (2006) stated that design research is a type of research methods aimed to develop theories about both the process of learning and the means that are designed to support that learning. The main aim of this study is to contribute to an empirically grounded instruction theory for percentages. In the present study, the researcher is interested in how to promote students‘ understanding of percentages. Therefore, a sequence of activities was developed as means to improve educational practices in learning percentages for grade 5 of primary school in Indonesia. To answer the research question and achieve the research goals, this study is a type of research methods, namely design research.
There are three phases of conducting a design experiment which are preparing experiment, experimenting in the classroom, and retrospective analysis (Gravemeijer & Cobb, 2006). We will now describe these three phases of a design research.
1. Preparing for the Experiment
15
(HLT) is dynamic and could be adjusted to the students‘ actual learning during the teaching experiment. The pre-knowledge of the students who were the subjects in the teaching experiment period is useful to be investigated. It is important in determining the starting points of the instructional activities and adjusting the initial HLT.
2. Teaching Experiment
Gravemeijer and Cobb, (2006) affirmed that the purpose of design experiment is both to test and to improve the conjectured local instructional theory that was developed in the preliminary phase. The teaching experiment emphasizes that ideas and conjectures could be adjusted while interpreting students‘ learning process. In the present study, there were two cycles of teaching experiment which was divided into six lessons. The first cycle was a pilot experiment. The goal of the pilot experiment is to adjust and to improve the initial HLT in order to get a better design for the second cycle. It was held in a small group of grade 5 students which consists of 5 students. The second cycle involved 37 students in a classroom. Before doing the teaching experiment, the teacher and the researcher discussed the upcoming activity, and after each lesson, the teacher and the researcher reflected on the whole class performance.
3. Retrospective Analysis
In this phase, all data that have already been gathered from the teaching experiment were analyzed. The result of the retrospective analysis is used to answer the research questions, to draw a conclusion, and to redesign the HLT. In general, the aim of the retrospective analysis is to develop a well considered and empirically grounded local instruction theory.
3.2 Data Collection 3.2.1 Preparation Phase
16
the study, and the learning environment of the class where the study was conducted. There were some sorts of data that had been collected as following.
1. Classroom observation
We conducted classroom observations which were aimed to get the feeling how mathematics lessons are going on in the class. It also made students become familiar with the researcher before the experiment in order to avoid the feeling of insecure or strange. The researcher sat on the back of the classroom and observed the whole mathematics lesson. Notes had been taken and there had been informal interviews with the students when they made their task. The classroom observation scheme can be seen on Appendix 2.
2. Interview with the teacher
An interview had been held with the teacher before the experiment to get more sense of how mathematics classroom is going to be taught. There were some questions about the teacher‘s educational background, her experience with Pendidikan Matematika Realistik Indonesia (PMRI) and the topic that she has taught, and some information related to the students that cannot be gained from observation. The interview scheme can be seen on Appendix 3. There were also some questions later on based on the findings from the classroom observations. The researcher used recording tools to record the interview.
3. Studying the documents needed
To know more how mathematics has been taught in the classroom, researcher studied the text book, worksheet book, and other documents that used in learning mathematics
4. Pre-test
A written pre-test (see Appendix 5) were given to the 5 students who participated in the pilot experiment and to the 37 students who participated in the teaching experiment. This written pre-test had been followed by interviews with some students related to their answers.
17
An interview had been conducted with some students after the pre-test in order to get more information about their answers of the questions on the test. Five students in the pilot experiment and four students from the teaching experiment class had been interviewed. These four students were chosen based on teacher‘s suggestions, and they were the members of a focused group on the teaching experiment phase. The researcher recorded the entire interview using the audio recorder with the help of her colleague.
3.2.2 Preliminary teaching experiment (first cycle)
The preliminary teaching experiment is a bridge between the preliminary design and the teaching experiment phase. This preliminary teaching experiment was held in a small group of grade 5 students which consists of 5 students in six lessons. These students were selected by considering the teacher‘s suggestions and they were not the member of the class where the teaching experiment (second cycle) phase had been conducted. The researcher in this phase had a role as a teacher and the entire learning activities had been recorded using a video camera and is observed by taking notes. Students‘ written works from all six instructional activities were also collected during this preliminary teaching experiment. The purposes of the preliminary teaching experiment activities were:
1. Investigating pre-knowledge of students
Besides giving the written pre-test to the students in the pilot experiment, the preliminary teaching experiment also aimed to give the information about the pre-knowledge of the students. Finding out this pre-knowledge of the students and whole group performance during this activity was important for the starting point of the instructional activities and for adjusting the initial HLT.
18
The main objective of the preliminary teaching experiment is collecting data to try out the initial HLT. The initial HLT was tried out and the observations of students‘ actual learning process were employed to make adjustments to the HLT.
3.2.3 Teaching experiment (second cycle)
Data collection in the teaching experiment phase is aiming at trying out the HLT that is already improved based on the result of the preliminary teaching experiment. Since the classroom teacher conducted the learning process, researcher and the teacher design Lesson Plans for each meeting (see Appendix 6) beforehand. There were some types of data as following will be collected.
1. Pre-test
The written pre-test had been given to 37 students who were the subject of the study at the beginning of the lesson. The written pre-test that was used in this phase was the new version of the pre-test after it had been adjusted, if necessary, based on the result of the pre-test in the Preliminary Teaching Experiment (first cycle).
2. Classroom observation
One class of fifth graders which consisted of 37 students was the subject of this present study. This phase also involved one mathematics teacher and one researcher‘s colleague. Six instructional activities that had already improved were tried out with the whole class. The focus on the observation was the 4 students who already been chosen beforehand based on teacher‘s suggestions. These students were set as a group. The researcher focused on doing
the observation while the teacher of the class did the teaching.
19
interesting moments had been written down on the notes based on the time showed on the video camera.
3. Group observation
The interaction within focus group was observed. Using the video camera which was located near the focus group, it was easy to make adjustment in order to get the clear video of the interactions within the group. There was also the informal interview or short talks with the students in the focus group in order to get more information about their works. The written field notes were also taken during the observation.
4. Students‘ written work
Written works of the 4 students in the focus group from all six instructional activities had been collected. The researcher with the help of her colleague collected posters and worksheet from the students.
3.2.4 Post-test
The post-test aims at getting information about what students have learnt during the preliminary teaching experiment (first cycle) and the teaching experiment (second cycle). This test was the written test that had been held after the last activity (see Appendix 8). The post-test had been given to the five students who participated in the preliminary teaching experiment and to whole class in the teaching experiment. After giving the written post-test, the researcher with the help of her colleague held an interview session with all students in the preliminary teaching experiment and four students in the focus group. This interview was aimed as a justification for students‘ result in the post-test and their reasoning in answering the problems given.
3.2.5 Validity and Reliability
20
written work, students‘ written test, and students‘ reflection. The entire learning activities were recorded using a video recording and all written works from the focused groups were also collected. These various kinds of data that were related to the students‘ learning process had been used as a base of data triangulation that in turn contributed to the internal validity of the present study. The HLT that was compared with the actual learning in the teaching experiment also contributed to the internal validity of the present study. We contributed to the internal reliability of the study by registration the data from the video camera.
3.3 Data analysis 3.3.1 Pre-test
The written pre-test was collected from five students in the first cycle and students in the second cycle of teaching experiment. Students‘ strategies in answering the problems had been examined by the researcher and her colleague. The written pre-test from the students in the first cycle by considering the interview session gave the information about the pre-knowledge of students in learning percentages. This had been the starting point in conducting the preliminary teaching experiment and it gave information which was related to the initial HLT. Moreover, the improvement of the problem in the pre-test which had been given in the first cycle was used in the second cycle to improve the validity of the data and the reliability of the test. The written pre-test from the students in the second cycle and the interview session gave more information of what students have already known and what they have not known about percentages. The result had also been the consideration of the focus group later on and also been the starting point in conducting the teaching experiment.
3.3.2 Preliminary Teaching Experiment (first cycle)
21
notes. The transcripts of the interesting moments had also been provided. The analysis of the preliminary teaching experiment had been done by comparing the HLT with the actual learning taking place. The result of the analysis had been used to improve the HLT that had been used in the second cycle.
3.3.3 Teaching Experiment
In this phase, data of classroom observations, group observations and students‘ written work had been collected and had been analyzed by the researcher and her colleague. The video recordings had been treated in the same way as it was in the preliminary teaching experiment phase. By considering the written field notes and students‘ written work, the actual learning had been compared with the improved HLT. The result of the analysis had been done in order to get information that can be used to answer the research question, to draw conclusion, and redesign the HLT.
3.3.4 Post-test
The written post-test had been analyzed by examining the result of the students‘ written post -test and the interview results related to the strategies and students‘ reasoning in answering the problems. The result of the analysis had been compared with the result of the students‘ written pre-test. The purpose of the comparing was to see what students have learnt during the experiment. The result of the analysis contributed to the conclusions of the present study. 3.4 Research subject and the timeline of the research
22
Table 3. Timeline research study
Description Date
Preliminary design
Studying literature and designing initial HLT September 2011 – Januari 2012 Discussion with the teacher Februari 2012
Preliminary teaching experiment
Pre-test February 22, 2012
Try out ―Percentage around us ― activity February 29, 2012 Try out ―Makingsense of percent‖ activity
Try out ―The audience‖ activity March 5, 2012
Try out ―The card game‖ activity March 8, 2012
Try out ―Comparing two theaters‖ activity March 12, 2012 Try out ―The shouting match‖ activity March 15, 2012
Try out ―Own production‖ activity March 19, 2012
Post-test March 22, 2012
Analyzing the preliminary teaching experiment and Improved the HLT Discussion with the teacher March 26-27, 2012 Preparation for teaching experiment March 27-31, 2012 Teaching experiment
Pre-test April 2, 2012
Lesson 1: ―Percentage around us‖ activity and classroom discussion
Lesson 2: ―Making sense of percent‖ activity and classroom discussion
April 22, 2012 Lesson 3: ―The audience‖ activity and classroom
discussion
April 23, 2012 Lesson 4; ―The card games‖ and ―Comparing two
theaters‖ activity and classroom discussion April 26, 2012 Lesson 5: ―The shouting match‖ activity April 27, 2012
Lesson 6: ―Own production‖ activity April 30, 2012
23
CHAPTER IV
HYPOTHETICAL LEARNING TRAJECTORY
Introduction
Hypothetical learning trajectory served as a term to identify and to describe relevant aspects associated with a mathematics lesson plan, including: a description of the students‘ mathematical goals, starting position (what students have already learnt or their informal knowledge), the mathematical activities (including the tasks or problems, that students work on to achieve the goals), and a hypothetical path that describes the students learning process. Therefore, in this chapter I would like to describe the starting point of the students, the learning goals, activities that allow me to reach the goals and the conjectures of students‘ thinking in the HLT.
My departure point in this study is students‘ current knowledge and ability. Most students in grade 5 indeed are familiar with newspaper or television. Only by reading the newspaper or watching television to be reminded that percent is one of the most widely used mathematical concepts. However, Reys, et al (2007) stated that incorrect usage of percent is common among secondary students and adults. Flagrant errors abound, suggesting that often the most basic ideas are unclear.
24
into this concept – is that a percentage is a relation between two numbers or magnitudes that is expressed by a special ratio, namely, ‗so-many-out-of-the-hundred‘.
This present research uses many daily life contexts such as discount, theater buildings, and some other contexts in which percentage plays an important role. As the starting point, this study designs an activity to assess informal knowledge of Students on percentage. In Realistic Mathematics Education where teaching is built on the informal knowledge of the students, the teaching of percentage could start with assessing what the students already know about percentage (Van den Heuvel-Panhuizen, 1994). After that, to give students opportunity to explore the meaning of percentage, some contexts related to part whole relationship are elaborated.
In this HLT, there are several learning goals expected to be reached by the students during the series of lessons in three weeks period. To reach the goals formulated, we designed a sequence of instructional learning for percentages which consists of six activities, which are elaborated as follows.
General starting point
In the Indonesian curriculum, five grade students of primary schools in the second semester have already learnt about fractions, decimals, and have already had experienced working with the ratio and proportion problems.
1. Students start to learn about fractions from the second semester of grade three ages 8-9. They learn about the simplest fraction – unit fractions and start to make visualization of them. In the second semester of grade four ages 9-10, students continue their learning about fractions including more complex fractions and their visualizations. They also learn to do operation with fraction such as addition and subtraction operation.
25
3. Students have learnt to transform fraction into decimals and vice versa in the second semester of grade four. They have experienced solving some problems which includes fractions and decimals problems.
4. Students have experienced solving some problems-application problems of fraction and decimals which related to the ratio and proportions.
The topic about percentages is a new topic for them in the beginning of the second semester after they have learnt all those topics before.
The first activity
a. Activity: Percentage around us
b. Pre knowledge: Students have ever heard the word ―percent‖, and they have ever seen in daily life.
c. Mathematical idea: Exploring the informal knowledge of percentages d. Learning goals:
Knowledge
Students recognize the use of percents in some situations.
Students identify and list some situations in daily life that use percentages. Students recognize percent means so many out of a hundred.
Skill
Students demonstrate how to make a categorization of the use of percentages in certain ways by making poster.
Attitude
Students express their point of view of some situations which need the use of percentage and why it is needed.
26 Knowledge
Informal knowledge:
- Students have seen some situations using percentages. Formal knowledge:
- Students have already learnt about fractions and decimals and have experience working with ratio and proportion.
- Students have already learnt about basic operations in fractions and decimals, such as addition, subtractions, multiplications, and divisions.
Skills
- Students are able to demonstrate their ability to do calculation using fractions and decimals.
Attitude
- Students show consideration where they could use fractions or decimals in solving problems.
f. Classroom activity:
Students are asked to make categorization together in their group of the percentage product that they have already found.
Some examples of the use of percents in daily life that can be shown to the class as a part of discussion,
Figure 4.1. Percentage products
27
point of view of what their reason is making categorization in such a way and give comments about the others products.
Students perform the categorization by making a poster in a big paper. They probably stick those products in order thoroughly, or just stick only one product of each situation as an example.
g. Conjecture of students‘ thinking:
Students recognize the use of percentages in some situations and list those situations, for example on the back of plastic package of instant noodle or chocolate bag, on the bottle of jam or milk. Students categorize the situations in certain ways. The way is determined by their discussion in group. For example they will categorize the products based on the context what the products show about, or another group will decided to categorize based on the number of percents stated, less than 50 percent and more than 50%.
Students categorize their findings based on their discussion in their own group. Probably some groups will list it and categorize based on the contexts that used, based on the number – less than or larger than 50%, based on the model or representation of the percentage – using a figure, only numbers, and etc. For example the data of vote from the newspaper is presented by the use of pie chart which has some colors and each color stated the different number of percents, on the brochure of department store the discount only represented by number – 20%, 50%, and etc.
28
h. Class discussion:
After students walk around and try to find any similarities and differences between their posters and other posters, teacher holds whole class discussion. Teacher then asks students what kind of products that show the use of percent after sightseeing they have done. Here, teacher also asks students whether they know the meaning of the symbol ―%‖.
Another informal knowledge that can be appeared from students is the use of percentages in the discount context. What about if the price is 90% discount, what it means for the customer and also for the seller. This kind of question aims to see whether students realize that percentage close to 100 means almost everything and percentage close to 0 means almost nothing. This also digs students‘ daily activity when they go with their parent to the supermarket and get discount as an informal knowledge that they have. The idea that will be attained from this activity is percent means so many out of hundred. Another starting points as the formal knowledge that have been attained by Students before joining this lesson is the use of fractions and decimals. They later will be asked the form of percents stated in fractions or decimals, and so on.
Students show consideration of why their groups make such a kind of categorization and express point of view to other students‘ work. They will give comments on their friends‘ work and compare it with their own work. Another respond will probably come by suggestions why this or that categorization is the best one.
In general, the discussion will lead into some points.
- the knowledge of situations (discounts, fats, oil productions, etc-depend on students‘ products)
- the knowledge of different numbers (10%, 50%, and etc). This is also related to the fractions or even decimals forms that can be shown by the percentage given.
29
Whole class discussion is intended to find out the informal knowledge of percentage that students have. This is the goal that would be attained by the teacher after conducting the first activity. What students have known about percentages and the context in which students are familiar with will be the next attention for teacher and researcher.
The second activity
a. Activity: Making sense of percent b. Starting point:
Knowledge
- Students know the use of percent in daily life.
- Students recognize percent means so many out of hundred Attitude
- Students can express their point of view of some situations which need the use of percentage and why it is needed
c. Mathematical idea:
- Percent means so-many-out-of-hundred - Percentage describes part whole relationship - Visual representation of percents, as in a pie chart
- Positive and negative growth described by means of percent.
d. Leaning goal: Knowledge
- Students develop the meaning of percent as so many out of hundred in some situations - Students understand the characteristics of percents, as follow
According to De Corte, E., Depaepe, F., ‗T Eynde, P., & Vershaffel, L. (2005), there are
30
- A percentage expresses a relation between two numbers or quantities by means of a ratio. Students need to aware that percentages are always related to something and have, therefore, no meaning without taking into account.
- Percentages describe a fixed situation representing how different kinds of substances are related to each other.
- The reduction of adding up of percentages has a non linear character - Percentages can be used to describe two different types of situations.
Skills
- Students can determine percents given the whole and a part Attitude
- Students can express their point of view in answering the problems given. e. Classroom activity:
These problems has been taken from the book ―Per Sense‖ by Holt, Rinehart, and Winston
(2003) and adapted into Indonesian contexts. 1. The twin discount
After finishing their purchases at the book store, twins Lyla and Ana taked about their books price. Ana said, ―We both got a 10 percent discount, yet we did not get the same rupiah amount. I saved Rp4000, and you save only Rp1000.‖
―Oh,‖ Lyla said, ―I can live with it‖.
Is it possible to get the same percent discount and not get the same amount of money? Explain your answer.
2. The Best Price Ever
A store advertised, ―Best price ever! 40 percent discount on all items!‖
Is it really the best price? The manager of the store says yes, but a customer says no. Do you agree with the manager or the customer? Explain why.
31
The student council president was explaining his budget plan: ―This pie represents the school budget: 50 percent of the money goes for books, 25 percent for lunch improvements, and 35 percent for the student council president‖
―Wait!‖ said the treasurer. ―That adds up to 110 percent!‖
Is there a problem with the budget? Explain.
4. The Discount Personal Radio
Lina: ―Win, look here. There is a 25 percent discount on this Rp80.000 personal stereo. You know, it‘s the one I wanted to buy. I need only Rp60.000 now.‖
Win: ―You need only Rp60.000? That doesn‘t seem right to me‖
If you were Lina, how would you explain your answer to Win? 5. The Price War
Two shopkeepers are comparing their prices, Jamie‘s store sells a phone for Rp200.000. Mike‘s store sells the same phone for Rp400.000. Jamie says, ―Your store price is 100 percent more expensive!‖
―That‘s not true,‖ says Mike. ―Your store price is only 50 percent less.‖
Who is right?
f. Conjecture of students‘ thinking: Problem 1
Dark blue: School budget Blue: Lunch
32
This problem deals with the relative nature of percent. Ana may have gotten a Rp40.000 pair of pants for Rp36.000, while Lyla may have purchase a Rp10.000 T-shirt for Rp9.000. Students do not have to find these amounts, but some may come up with them.
Answer: Yes, it is possible. A 10 percent discount on a higher-priced item represents a large rupiah amount saved than the rupiah amount saved with a 10 percent discount on a lower-priced item. The only instance in which a 10 percent discount represents the same rupiah amount saved is when both items have the same original price.
If students were able to understand this problem, I probably will ask following question: Would it work the other way around? Can two people get the same amount of discount and
not the same percent discount?
Answer: Yes. For example, suppose Ana buys an Rp800.000 tape. With a 50 percent discount, she saves Rp400.000. If Lyla buys a Rp1.000.000 tape with a 40 percent discount, she also saves Rp400.000.
Problem 2
This story emphasizes the relative nature of percent. It is possible that a 20 percent discount will result in a better bargain than a 40 percent discount depending on the base price of the item and various factors such as markup and product quality.
Answer will vary. Some students may agree with the manager, saying that it is very possible that a 40 percent discount allows for the best prices he has ever offered. Other students may agree with the customer, saying that the customer may have seen identical items on sale at a different store. Some students may say that stores offering a 40 percent discount do not have the lowest prices since stores offering a 100 percent discount would have even better price. Problem 3
33
for books and 25 percent each for the lunch improvements and the student council (not just the president).
The key point implied in the story concerns the identification of 100 percent as the maximum. Find out how many students consider this concept to be self-evident.
In addition, considering the pie chart given, students probably relate it to the fraction or decimal forms. This is can be strategy to make justification of their answers.
Problem 4
Explanation will vary. One possibility follows:
The original price of the stereo is Rp80.000. It is on sale at a 25 percent discount. Some Students know that 25 percent equals one-quarter. One-quarter of Rp80.000 is Rp20.000,00, so, after subtracting Rp20.000 from Rp80.000 to find the sale price.
Some Students may use a different strategy here: determine the sale price as ¾ of the regular price.
Problem 5
This problem is an example of the relative nature of percent. Percents are only understandable when compared to some base value.
Answer: Both shopkeepers are right. Jamie is correct in saying that Mike‘s price of
Rp400.000 is 100 percent higher than her price of Rp200.000. Mike is also correct in saying that Jamie‘s price of Rp200.000 is 50 percent less than his price of Rp400.000. The two
statements are equivalent g. Classroom discussion:
34
responses are three responses. Before they move to the next problems, teacher will ask students to conclude the result of the discussion of the first problem.
The third activity
1. Activity: The audience 2. Starting Point:
Knowledge
- Students are familiar of some situations which included percent - Students understand percents as so many out of hundred
- Students understand the characteristics of percent. Skill
- Students are able to determine percent given the whole and a part Attitude
- Students show consideration working with percents based on their characteristics 3. Mathematical ideas:
- Percent means so many out of hundred - Percentages describe part whole relationship.
- Percents that are relatively easy to estimate are known as benchmark percents 4. Learning goals:
Knowledge
- Students are able to estimate percents - Students construct a visual model of percent
- Students recognize the relationship between a fraction and a percent. Skill