ISSN 1346‐8901
PREFACE
Concerning Indonesia’s human resource development, Indonesia Student Association in Hokkaido (PPI Hokkaido) establishes a mission to support the Indonesian students who are studying in excellent universities in Hokkaido, Japan. Simultaneously, PPI Hokkaido encourages Indonesian students to give real contribution and get involved actively in Indonesia’s development. In addition PPI Hokkaido annually holds a scientific meeting among Indonesian students in Hokkaido in order to increase the ability on problem%solving by gaining various knowledge from various field of studies, and to formulate an integrated approach from these various field of studies to offer an innovative solution for Indonesia’s development.
This year PPI%H held this scientific meeting for the eighth time, with title “The 8th Hokkaido
Indonesian Association Scientific Meeting (HISAS 8)”. Adopting theme Multi Disciplinary
Scientists as Indonesia Resources towards Society Welfare Equality and Environmental
Sustainability, newly acquired knowledge and proposed solutions on threat and challenges of
Indonesian mega diversity were presented and discussed. Together with other important findings from engineering view this meeting showed that the multi disciplinary studies of Indonesian students in Hokkaido will give multiple benefit not only for self%development, but also for the social, welfare and environmental sustainability of Indonesia.
Appreciation goes to all of speakers for their contribution and to all of the organizing committees on their hard work for the success of this meeting. Sincere acknowledgments are extended to Indonesian Embassy for Japan, Hokkaido University and Hokkaido Gas Company (Kita Gas) for their support on this meeting. We do hope that results and findings discovered and gained from this meeting as well as the offered solutions can be implemented well, and harmonized with Indonesian government and policy to meet the Indonesian future challenges, not only to answer the environmental issues but also for developing the human building capacity in Indonesia.
Sapporo, 27th November 2010
Organizing Committee of HISAS 8 Chairman,
CONTENT
Preface ... i
Content ... ii
List of Organizing Committee ... iii
Biodiversity of Bagworm (Lepidoptera:Psychidae) on Ornamental Plant in South
Sumatera, Indonesia, Yulia Pujiastuti... 1
Survival of Pathogenic Bacteria in Yoghurt And Kefir During Fermentation Process And
Cold Storage, E. Taufik, R.R.A. Maheswari, I. Sudirman, Z. Wulandari, T. Pratiwi, A. Paramita
and T. Syaifulina ... 8
Temperature and salinity control on ore mineral deposition: fluid inclusion study,
E. T. Yuningsih and H. Matsueda ... 17
Numerical Simulation of The 1883 Krakatau Tsunami Propagation,
Aditya Riadi Gusman, Hamzah Latief, and Haris Sunendar ... 24
Earthquake%Resistant Characteristics of Indonesian Traditional Timber Houses,
Ali Awaludin ... 35
The Effect of Contact Angle Polydispersity on Capillary Behavior in Porous Media,
Esti Puspitaningrumand Shusaku Harada ... 37
Indonesian Traditional Herbs For Diabetes,
Maria D.P T. Gunawan Puteri, Tomohiro Ieyama, Stella Kristanti and Jun Kawabata ……… 47
Recent Peat Fire Trend in The Developed Peat Swamp Forest of Mega Rice Project Area,
List of Organizing Committee
Advisory board : Chairman of Indonesian Student Association of Hokkaido
Chairman of Indonesian Student Association of Sapporo
Chairman : Erianto Indra Putra, Ph.D
Vice Chairman : Gun Gun Hidayat (ex officio)
Refi Ikhtiari (ex officio)
Secretary : Aditya Gusman
Treasurer : Arya Utami
Paper Coordinator : Ali Sobirin
Rudy Syahputra Ixchel Mandagi Anastasia Setiawan
Equipment : Eko Siswoyo
Heri Kurniawan
Transportation : Hari Setiapraja
Cholil
Documentation : Erwin Suwendi
Euis Tintin Yuningsih
Food Supplies : Esti Puspitaningrum
Indun Puspita Eni Sugiarti
Proposal & Program : Surya Kencana Joe
Budi Hasiholan Teddy Eka Putra Mutiara Sidharta
Information and Website : Toto Sudiro
Public Relation : Gun Gun Hidayat
Maria Stefanie Dwiyanti
Editorial Board : Ali Awaludin, Ph.D
BIODIVERSITY OF BAGWORM (LEPIDOPTERA:PSYCHIDAE) ON
ORNAMENTAL PLANT IN SOUTH SUMATERA, INDONESIA
Yulia Pujiastuti
PS Agro%ecotechnology, Faculty of Agriculture Sriwijaya University
Jln. Palembang%Prabumulih Km.32 Kampus Inderalaya Ogan Ilir South Sumatera e%mail: [email protected]
ABSTRACT: The purpose of research was to investigate biodiversity, population of
bagworm and their parasites in South Sumatera, Indonesia. Survey was conducted in rainy and dry seasons, from October 2008 to August 2009. The method used was purposive sampling method, with ornamental plants grown in home yard, public garden and garden flower’s seller as the targets. The observation covered: species of bagworm, number of bagworm exist on each ornamental plant, position of bagworm, form of bagworm’s case, level of parasitization of bagworm and information of bagworm’s control. Identification of
bagworm species refered to Kalshoven (1981), Mitchell et al. (2001), and related articles
about bagworm. Nine species of ornamental plants, i.e. Rose (Rosa sp), Orchid (Dendrabium
anosmum), Asoka (Ixora spp.), Bougenvillia (Bougenvillia spectabilis), Hibiscus (Hibiscus
rosasinensis), Euphorbia (Euphorbia milli), Palmae (Hyophorbe lagenicaulis ), Roselle
(Hibiscus sabdariffa), and Alamanda (Allamanda cathartica) were observed. All sampled
plant species were grown in home yards, five species (rose, bougenvillia, hibiscus, asoka, palmae, and alamanda) were planted in public parks, and all ornamental plants %except roselle% were found in garden flower’s seller. The species of bagworm associated with those
ornamental plants were identified as Pagodiella hekmeyeri Heyl, Clania variegata Sn,
Chaliodes kondonis Sn, Oiketicus abotti Templ, Pteroma plagiophles Hps, Mahasena corbetti
Tams, and Clania minuscula Joannis. Population of Pteroma plagiophles was the highest both
in rainy and dry seasons. Rose, bougenvillia and alamanda were attacked by three of bagworm species, hibiscus and euphorbia were attacked by four species of bagworm. Orchid, palmae, asoka and roselle were attacked by five species of bagworm. Position of bagworm in ornamental plants varied in parts of the tree such as leaves, trunk, branch and flower. Bagworms were easily identified by the form of their cases. Each species had its own type of
case, such as Chalioides kondonis with its cone%shape case. Level of parasitization was low
(0.00 – 18.54 percent). The rank of bagworm’s number and species found was as follows: home yards, public parks and flower sellers. Controlling of the bagworms was done by mechanical hand picking. No chemical control was applied on these insects.
: bagworms, ornamental plants, insect pests
1. BACKGROUND
Many species of insects attack ornamental plants, of which bagworm is a very important pest due to its specific type of attack symptom (Kalshoven, 1981). Not only on leaves this insects feed, but also on stem, branch and flowers. Bagworms usually begin feeding at the top of the tree. When small, the caterpillars feed in the layers of the leaf tissue, creating light patches on leaves. As they age, they consume entire needles or leaves. A severe infestation may defoliate plants, which can kill branches or entire plants. A healthy deciduous tree or shrub that has been defoliated usually produces a new flush of leaves and survives. However, a defoliated evergreen cannot push out an additional set of leaves and may die. As soon as the first showers signal the beginning of the rains the eggs hatch and hundreds of tiny caterpillars disperse from the mother bag. These caterpillars are naked to begin with but witin a few hours they have gathered enough leaf material for a small cone that can cover them. The material is taken from epidermis of the leaf but the damage is hardly visible. At this stage the cones are whitish or pale green. The attack is first noticed as small spots, scattered over the mopane leaves. The spots are about 5 mm in diameter and they eventually turn red%brown. Only the epidermis is eaten so there are no holes through the leaf. The small caterpillars can be found in small cone%shaped bags made of green leaf material. The caterpillars spend the rest of their life in such bags that just are expanded when the caterpillars grow bigger. They can move easily by strecthing their heads out through an opening in the top of the bag and pull the bag to a new place on the leaf. In particular it is estimated a modified Economic Injury Level
(EIL) for the bagworm, Thyridopteryx ephemeraeformis (Haworth), attacking American
arborvitae, Thuja occidentalis under retail nursery conditions. Under these circumstances, the
Economic Injured Level (EIL) was found to be only about four first instar larvae per 4 ft tree
(Raupp et al., 1989). In Indonesia thousands of sengon (Albizia) tree in Tambakroto, Kajen,
Pekalongan District, severely attacked by bagworm. The farmers lossed the yield of those tree, and it decreased farmers’ income because of bad qualified of the albizia wood (Antara News Agency, May 29, 2009). In the world, it is known 600 species of bagworm, but in Indonesia there is no report how many of species exist. In Sapporo, Japan, there is no report about bagworm living in this area (Kinota, 2006). In Western Japan, data reported by Nishida
(1983), there were two species bagworm i.e. Eumeta japonica dan Eumeta minuscula (now
namely Clania variegatta) are important pests of shade and ornamental trees and
shrubs.There was no data reported on ornamental plants due to bagworm attack especially in South Sumatera. Therefore, this paper will report the results of research about bagworm on ornamental plants in South Sumatera.
2. MATERIALS AND METHOD
The research was conducted in two districts in South Sumatera i.e. Ogan Ilir and Palembang, using purposive sampling method in rainy and dry season (October 2008 % August 2009). Observations were held in home yard’s garden, public garden and garden flower’s seller. The
target ornamental plants were Rose (Rosa sp), Orchid (Dendrabium anosmum), Asoka (Ixora
spp.), Bougenvillia (Bougenvillia spectabilis), Hibiscus (Hibiscus rosasinensis), Euphorbia
(Euphorbia milli), Palmae (Hyophorbe lagenicaulis ), Roselle (Hibiscus sabdariffa), and
Alamanda (Allamanda cathartica). Observation was covered: species of bagworm, number of
3. RESULTS AND DISSCUSION
3.1 Biodiversity Species of bagworm
The observations conducted in dry and rainy seasons, found 944 individues of bagworm,
identified as 7 species of bagworm: Pagodiella hekmeyeri Heyl, Clania variegata Sn,
Chaliodes kondonis Sn, Oiketicus abotti Templ, Pteroma plagiophles Hps, Mahasena corbetti
Tams, dan Clania minuscula Joannis. Number of each species of bagworm was shown in
Table 1. The highest number of bagworm was Pteroma plagiophles Hps, both in rainy and
dry season. This species was also found in several ornamental plants, it seemed that P.
plagiphles was polyphagous insect. It was also reported by Jar and Sarma (2008) P.
plagiophles was a cosmoplitan and polyhagous insect in India. Observation done in garden’s
house hold, public garden and garden flower’s seller showed that symptom of bagworm attack was losses of epidermis part of leave, forming holes in many places. Leave will falling down easily and plants will loss the leaves.
Table 1. Biodiversity of bagworm on ornamental plants in South Sumatera in rainy and dry seasons
Amount of individues
No Host plant Species of bagworm
3.2 Number of bagworm observed
Number individues sampled were different between rainy season and dry season. It can be shown in Figure 1. In general, number of individues found in dry season much higher rather than in rainy season. It was predicted that suitable micro%climate will cause the reproduction process happened without any constraints. Mating occured between male and female and a lot of eggs (100%300 eggs) produced by females in her own pocket. Thus, the bagworm population grow faster in dry season than rainy season. When it was raining, rain’s drop physically will effect the first instar of bagworm due to uncover body of those larvae.
Fig. 1 Number of indvidues of each species of bagworm found in rainy and dry season in ornamental plants in South Sumatera, Indonesia
3.3 Biodiversity of ornamental plants as bagworm host
All target ornamental plant were attacked by bagworm in various instar. This report did not note specific instar attack, but interestingly, bagworm were found not only in young plant but
also some years old plant. It is also noted that larvae found on leave (Phaodiella hekmeyeri
and Oiketicus abboti) and on stem or branch (C. kondonis). The result also noted in a torny
ornamental plant such as rose and euphorbia, the bagworm still alive and attack those plants. They make a bag from any dry leaves and compiled in a specific form. Bagworm form were
specific in each species (Rhainds et al., 2009).
Bagworms were identified polyphagous and cosmopolitant insect. Table 2 showed 2 species
of bagworms are polyphagous bagworms, namely Oiketicus abotti and Pteroma plagiophles.
Both are attacking Rose (Rosa sp.) Orchid (Dendrabium anosmum), Bougenvillia
(Bougenvillia spectabilis), Palmae (Hyophorbe lagenicaulis), Hibiscus (Hibiscus
rosasinensis), Asoka (Ixora spp.), Roselle (Hibiscus sabdariffa), and Euphorbia (Euphorbia
Table 2. List of ornamental plants as the hosts of bagworm
No Species of bagworm Species of host plants
1 Chaliodes kondonis Sn 1. Orchid (Dendrabium anosmum)
2. Palmae (Hyophorbe lagenicaulis )
3. Hibiscus (Hibiscus rosasinensis)
4. Asoka (Ixora spp.),
5. Alamanda (Allamanda cathartica)
6. Euphorbia (Euphorbia milli)
2 Clania minuscula Joannis 1.Palmae (Hyophorbe lagenicaulis )
2.Asoka (Ixora spp.)
4 Mahasena corbetti Tams 1.Orchid (Dendrabium anosmum)
2.Bougenvillia (Bougenvilliaspectabilis)
3.4 Position of bagworm on ornamental plants and form of bagworm’s case
In general bagworms attached their case on leaves. In this observation, four species (C.
kondonis, C. variegata, O. abotti, and P. plagiophles) attached also on bark or stem of plants.
C.variegatta attached also on flower of rose. Larvae took out its head from its case and feed
in the layers of the leaf tissue, creating light patches on leaves. Larvae attached on stem and eat on bark of stem. Therefore they made their case from this part of trees. This position was very important to describe economically importance of a species. On albizia tree, the bagworm attach on bark and eat on it, consequently this part was severely damaged. Albizia’s grower could not harvest the wood of albizia, therefore they could not get economically benefit (Antara News Agency, May 29, 2009).
There were many forms of bagworm’s case. Each species had its own type of case, such as
shaped bag, hanging by a rope from materials spun with its saliva. Some species make their case from pieces of foliage made based on the part of plant they live in. Forming of their cases can be determined their species.
3.5 Species and number of individues based on location they found
Observation of bagworms was conducted in three locations, i.e. home yards, public gardens and flower’s seller. More than 50 percent of bagworms (55.83%) was found in homeyards, 29.24 percent in public gardens and 14.83 percent in flower’s seller. This fact also showed that home yards owner did not take care the garden well, while in public parks, eventhough there were some officers did their job, the amount of bagworms found was higher than in flower’s seller. The seller took care their ornamental plants very well because of their economically important commodities.
Table 3. Number of bagworm individues found in different locations
Number of individues
No Species of bagworm
Home yards Public parks Flower’s sellers
1 Chaliodes kondonis Sn 105 52 15 Identification of parasitoid were on going. The result showed (Table 3) level of parasitization
was ranged from 0.00 to 18.54 persen. The most parasitized bagworm was Mahasena corbetti
(18.54 percent), and Pteroma plagiophles (13.69 percent). The level of parasitization was
very low compare with thus on Eumeta variegata bagworm. This insect was an important
insect pest on orchard and street trees in southwestern part of Japan. Newly invaded tachinid
fly, Nealsomyia rufella reported as parasitised E.variegatta (Sawada and Arakawa, 2002).
Level of parasitization on E. variegata bagworm by tachinid flies Nealsomyia rufella reached
96.4 percent. The percentage of parasitism ranged from 0 to 96.4% in each collection site, having a tendency to be higher in the urban area in the central part of Kochi.
Table 4. Level of parasitization of bagworm
3.7 Bagworm control
In the part of observation, bagworm control was asked to the owner of ornamental plants in home yards, officer in public parks and owner of flower’s seller. The questions were about wheteher they knew about bagworms presence and how to control them. Out of 25 people who asked about the bagworms presence, 17 persons (68 percent) answered that they knew about bagworms and the rest (8 persons / 32 percent) said they did not understand what bagworms were. Among the people who knew bagworms, they controlled the bagworm directly by hand picking (13 persons / 76.45 percent) and the rest (4 persons / 23.55 percent) said they did not do anything. When they were asked whether they used chemical insecticides, they said that they never used for controlling bagworm.
4. CONCLUSIONS
All sampled plants were attacked by bagworm. Species of bagworm found in ornamental
plants identified as Pagodiella hekmeyeri Heyl, Clania variegata Sn, Chaliodes kondonis Sn,
Oiketicus abotti Templ, Pteroma plagiophles Hps, Mahasena corbetti Tams, dan Clania
minuscula Joannis. Pteroma plagiophles was the highest number found in all ornamental
plants. Each species had its own type of case Level of parasitisation was low (0.00 – 18.54 percent). The rank of bagworm’s number and species found was as follows: home yards, public parks and flower seller. Controlling of the bagworms was done by mechanical hand picking. No chemical control was applied on these insects.
ACKNOWLEDGMENTS
The writer thanked to Ekasri Murniati and Merryska Gita Jayanti for supporting some data of bagworm species in some areas.
REFERENCES
Antara News Agency, 29 Mei 2009. Hama ulat kantong menyerang tanaman sengon(albizia). (in Indonesian)
Raupp, M. J., J. A. Davidson, C. S. Koehler, C. S. Sadof and K. Reichelderfer., 1989. Economic and Aesthetic Injury Levels and Thresholds for Insect Pests of Ornamental
Plants. The Florida Entomologist, Vol. 72, No. 3 (Sep., 1989), pp. 403%407.
Jha, L.K. and Sarma, P.K. 2008. Agroforestry. Indian Perspective. APH Publishing Corporation. New Delhi. 341 p.
Kalshoven, L.G.E. 1981. The Pests of Crops in Indonesia. Revised and translated by P.A. Van deer Laan. PT. Ichtiar Baru%Van Hoeve, Jakarta
Kinota,K. 2006. Common insect in Sapporo (in Japanese). Hokkaido Daigaku Aifud Press. 413 p.
Nishida, E. 1983. Biologies and parasite complexes of two bagworms, Eumeta japonica and
Eumeta minuscula (Lepidoptera: Psychidae) in Japan. Kontyu, Tokyo, 51 (3):394%441
Rhainds, M., Donald Davis, and PeterW. Price. 2009. Bionomics of Bagworms (Lepidoptera: Psychidae). Annu. Rev. Entomol. 2009. 54:209–216.
Sawada, Y. and Arakawa, R. 2002. Field Parasitism of Bagworm, Eumeta variegata
(Lepidoptera: Psychidae) by the Newly Invaded Parasitic Fly, Nealsomyia rufella
(Diptera: Tachinidae) in Kochi Prefecture, Japan. Japanese Journal of Entomology New
SURVIVAL OF PATHOGENIC BACTERIA IN YOGHURT AND KEFIR
DURING FERMENTATION PROCESS AND COLD STORAGE
E. Taufik1,3*, R.R.A. Maheswari1, I. Sudirman2, Z. Wulandari1, T. Pratiwi1, A. Paramita1 and
T. Syaifulina1
1/*Department of Animal Production Science and Technology, Faculty of Animal Science, Bogor Agricultural
University, Indonesia. Jl. Agatis Kampus IPB Darmaga, Bogor INDONESIA 16680 E%mail: [email protected]
2 Department of Animal Disease and Veterinary Public Health, Faculty of Veterinary Medicine, Bogor
Agricultural University, Indonesia. Jl. Agatis Kampus IPB Darmaga, Bogor INDONESIA 16680
3Graduate School of Animal and Food Hygiene, Obihiro University of Agriculture and Veterinary Medicine.
Hokkaido, Obihiro, Inada Cho Nishi 2%11, JAPAN 080%0855
Abstract: Fermentation has been used as primary mechanism in preserving and increasing
safety of milk products. Consequently, fermented milk products are generally considered as safe product. The contamination of pathogenic bacteria into the milk may occur in the farm or during handling and processing of the milk products. The contamination source might be originated from the environment, mammary gland, utensils, and workers. Thus, the quality of starter culture which is used in the production of fermented milk play an important role. Therefore the objective of this experiment is to study the antagonistic activity of yoghurt and
kefir starter culture on the survival of Staphylococcus aureus (SA) KT07 and Escherichia coli
(EC) KT07 as indicator of pathogenic bacteria during 24 hours of fermentation and 11 days of cold storage (5±2°C). The experiment was done by addition of pathogenic bacteria into the yoghurt (YT), probiotic yoghurt (YP), and kefir (Kf). The starter bacteria that used in this
experiment were Streptococcus thermophilus (ST) RM01 + Lactobacillus bulgaricus (LB)
RM01 for YT; ST RM01 + LB RM01 + Bifidobacterium longum (BL) RM01 for YP; and
bulk starter of kefir grain for Kf. The examined variables were pH, titratable acidity,
population of lactic acid bacteria (LAB) and pathogenic bacteria. The variables were measured every 4 hours for 24 hours fermentation and every 2 days during cold storage for 11 days. The results showed that the number of lactic acid bacteria (LAB) in the fermented milks with SA KT07 as testing bacteria increased after 4 hours fermentation process until the end of cold storage. Whereas in the fermented milks with EC KT07 as testing bacteria, the population of LAB increased during fermentation but decreased after 24 hours and sharply decreased until the end of cold storage. The viable count of SA KT07 increased by 8.92% for YT; 6.16% for YP, and 26.42% for Kf during fermentation, and continued to increase until the end of cold storage except in YP. Viable count of EC KT07 also increased during fermentation and reduced sharply to 1.90 log cfu/ml for YT and 0.70 log cfu/ml for YP at the end of cold storage. Based on the results of this experiment, it can be concluded that probiotic yoghurt had better bacteriostatic activity toward testing bacteria among treatments. The results moreover showed that fermented milk products may have potential risk to the consumer health if the manufacturing process is not free from bacterial contamination.
antagonistic activity, yoghurt, kefir, survival, Staphylococcus aureus, Escherichia coli
1. INTRODUCTION
1.1 Background
of bacterial origin, with at least 21 milkborne or potentially milkborne diseases currently being recognized. Pathogens that have been involved in foodborne outbreaks associated with
the consumption of milk include Listeria monocytogenes, Salmonella, Campylo
bacter, Staphylococcus aureus, B. cereus and Cl. botulinum. The presence of these
pathogenic bacteria in milk emerged as major public health concerns (Chye et al., 2004).
The consumer demand on milk products such as pasteurized milk and fermented milk products, were constantly increasing. Product diversifications and direct marketing strategy were just example on how the producers try to cope with this situation. Many small scale fermented milk producers were also established and sell their products directly to the consumers. The food safety status of their products is one of the most sensitive issues that should be concerned in terms of consumer’s health protection.
1.3 Formulation of the Problem
Due to its intrinsic characteristics such as organic acids contents and the availability of lactic acid bacteria as starter culture, the fermented milk products are considered to be safe to consume. In the other word, it has GRAS (Generally Recognized As Safe) status. The organic acids produced by lactic acid bacteria have the ability to inhibit or kill pathogenic bacteria, but this ability is determined by the quality of starter culture and the contamination degree of the raw material. The problem is then raising, if the raw material is heavily contaminated either from premises in the farm, during the production process such as incompleted fermentation process or contamination from worker or utensils; how far those pathogenic bacteria can survive during the processing and storage? Can we still consider the fermented milk products as safe food? Therefore, the study on the survival of pathogenic bacteria during
fermentation process and cold storage is ofcentral importance.
2. OBJECTIVE
To investigate the antagonistic activity of yoghurt and kefir starter culture on the survival of
Staphylococcus aureus (SA) KT07 (Gram positive) and Escherichia coli (EC) KT07 (Gram
negative) as indicator of pathogenic bacteria during 24 hours of fermentation and 11 days of cold storage (5±2°C).
collection of Division of Dairy Science, Department of Animal Production Science and Technology, Faculty of Animal Science of Bogor Agricultural University. Whereas the
pathogen isolates of Staphylococcus aureus KT07 and E.coli KT07 were isolated from raw
goat milk by Taufik (2007). The chemicals that used were MRSA (de Mann Rogosa Sharpe
Agar), BPA (Baird Parker Agar) with egg yolk tellurite, E/C Petrifilm, EMBA (Eosin
Methylene Blue Agar), BHIB (Brain Heart Infusion Broth), sterile standard liquid of NaCl,
0.5 McFarland standard, alcohol, buffer solution of pH 4 and 7, PP (Phenopthalein) 1%,
3.2 Methods
3.2.1 Fermented milk
The process of yoghurt making was based on the method explained by Tamime et al, (1999). Two types of yoghurt were produced i.e. yoghurt type I (YT) and type II (YP). Each type
contained 5% of culture starter, L. bulgaricus (LB) RM01 and S. Thermophilus (ST) RM01
were used in type I yoghurt and LB RM01 and ST RM01 plus Bifidobacterium longum (BL)
RM01 were used in type II yoghurt.
Kefir (Kf) was made by modification of method reported by Gulmez et al, (2003). The starter culture of bulk kefir grain was added in the same concentration with yoghurt starter culture
(5%). The indicator pathogenic bacteria in about 106 cfu/ml (6 log cfu/ml) were added to each
fermented milk type along with the starter bacteria. Incubation was done for 24 hours at 37oC
for yoghurt and 28oC for kefir.
3.2.2 Pathogenic Bacteria
The pathogenic bacteria which were used as indicator or testing bacteria represented Gram
positive and negative bacteria. Staphylococcus aureus (SA) KT07 (Gram positive) and
Escherichia coli (EC) KT07 (Gram negative) originated from goat milk isolated by Taufik
(2007) were used in this experiment.
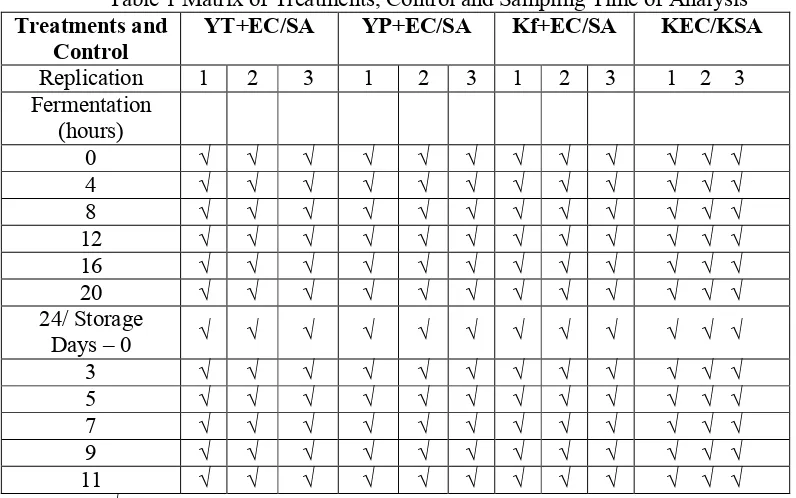
3.2.3 Sampling Strategy
Fermented milks added with testing bacteria as the treatment i.e. YT+EC/SA, YP+EC/SA and
Kf+EC/SA were made as suggested by Estrada et al. (2005). Two bottles of sterile milk
mixed with each testing pathogenic bacteria were made as positive control (KSA KT07 and KEC KT).
Table 1 Matrix of Treatments, Control and Sampling Time of Analysis Treatments and
Control
YT+EC/SA YP+EC/SA Kf+EC/SA KEC/KSA
3.2.4 Examined Variables
3.2.4.1 pH Valueand titratable acidity were measured according to Nielsen (2003).
3.2.4.2 Microbiological Analysis a. Total Lactic Acid Bacteria
Method from Djenane et al. (2005) was followed for counting total lactic acid
bacteria
b. Total (SA) KT07
Surface inoculation method was used to count population of SA KT07, this method was carried out based on ISO 6888%1 (ISO, 1999).
c. Total (EC) KT07
Total population of EC KT07 was counted based on 3M™ Petrifilm™
E.coli/Coliform Count Plates method (PetrifimTM, 2005).
4. RESULTS AND DISCUSSION
The effect of lactic acid bacteria as starter culture of yoghurt (YT), probiotic yoghurt (YP)
and kefir (Kf) on the survival of pathogenic bacteria Stapylococcus aureus (SA) KT07 and
Eschericia coli (EC) KT07, as well as on pH value and titratable acidity (TAT) during 24
hours of fermentation and 11 days of cold storage 5±2°C is discussed in the following subtitles.
4.1 For (SA) KT07
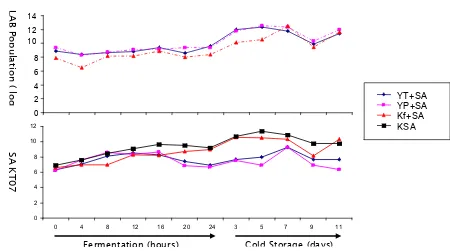
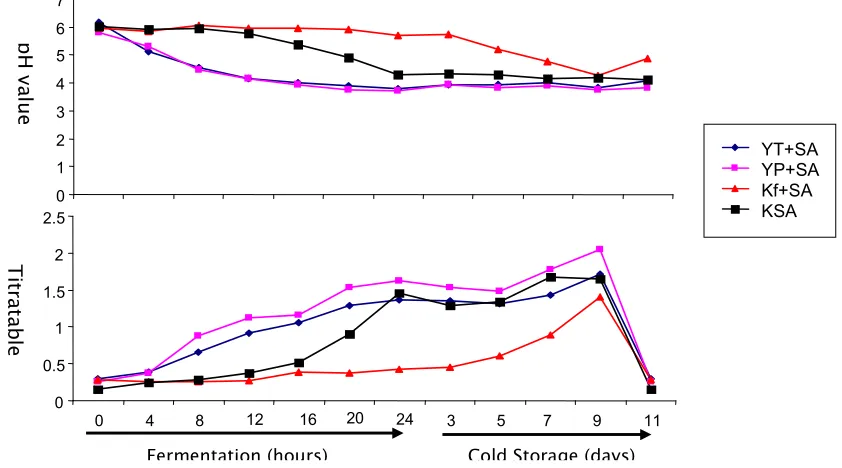
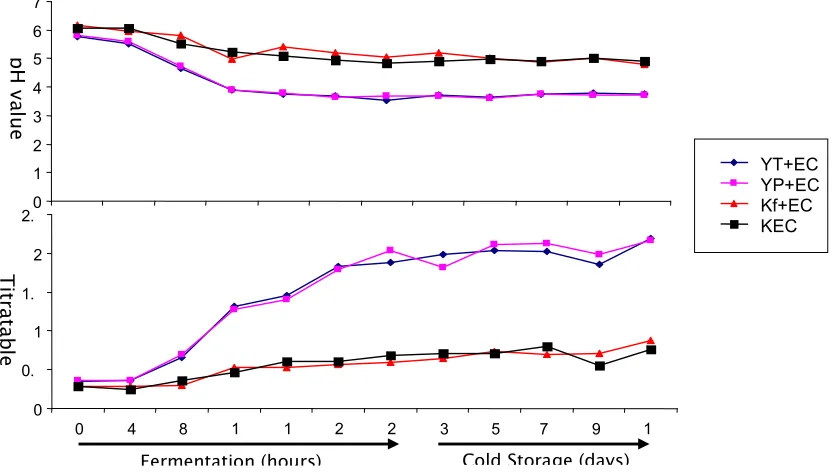
Figure 2 pH and Titratable Acidity (TAT) Value of Each Fermented Milk Product and Control with SA KT07 as The Testing Bacteria During Fermentation Process and Cold Storage
Figure 1 shows that from the beginning of fermentation process until 24 hours (the end of fermentation process), the SA population in all fermented milks were tend to increase. Whilst the population of LAB were tend to be constant though the number of population of LAB was relatively higher than SA. The number of SA population at the end of fermentation in all fermented milks were still remain high (6 – 8 log cfu/ml). Those range of number of SA in the fermented milk posses high risk to the consumer health, since it is still within infective dose. YP had the lowest number of SA at the end of fermentation process among all fermented milks.
The SA and LAB growth pattern in the storage time was relatively similar. The probiotic yoghurt (YP) still had the highest LAB population but lowest pathogenic bacteria (SA) population among other fermented milks. However, the number of pathogenic bacteria (SA) at
the end of storage (day 11th) still remain high (above 6 log cfu/ml). The number of SA at the
end of cold storage was about in the same number with the beginning of fermentation for YP and higher for other samples. It means that the fermented milk products, either at the end of fermentation process (24 h) as well as after 11 days of cold storage had relatively high risk for consumer health in regard to the pathogenic bacterial load (SA) contained in the products.
pH value for each treatment and control during fermentation process tended to decrease and continued in relatively in constant pattern during storage except for the control (Figure 2). pH value of fermented milk i.e. YT+SA, YP+SA and Kf+SA at the end of fermentation process (24 h) were 3.79; 3.73; and 5.70 respectively. As the pH measure the concentration of H in the solution, the titratable acidity (TA) value showed the degree of acidity. Therefore the value of pH and TA are opposite of each other as it shown in the Figure 2.
!
"
The decreasing of pH value was related with the metabolism of lactose into lactic acid and other organic acids by the activity of lactic acid bacteria. Although the pH decreased, the pH value at the end of fermentation process (24 h) as well as at the end of cold storage for YT+SA, YP+SA, KYT and KYP was in accordance with standard pH value for yoghurt
according to Jay et al. (2005) which is in the range of 3.65 – 4.4.
4.2 For (EC) KT07
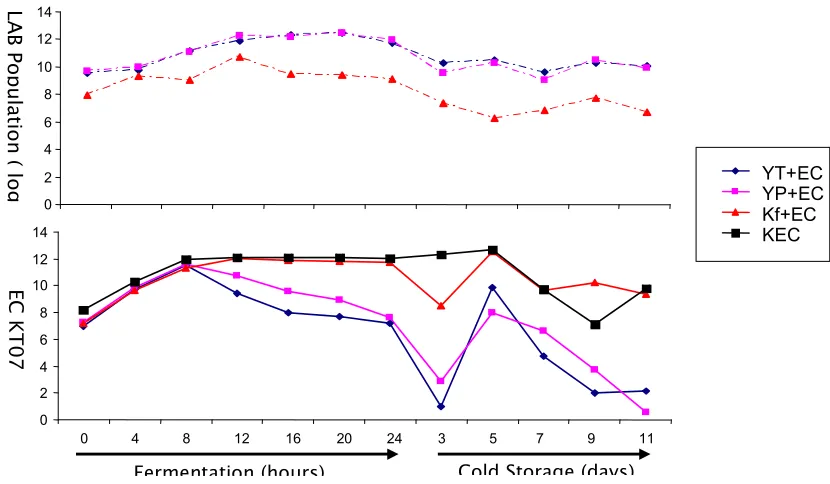
Figure 3 LAB and EC KT07 Population of Each Fermented Milk Product and Control During Fermentation Process and Cold Storage
Population of LAB and EC KT07 of each fermented milk product and control during fermentation process and cold storage is shown in Figure 3. LAB population for YT+EC increased from 9.58 log cfu/ml at starting point of fermentation process (0 h) to 11.74 log cfu/ml at the end of fermentation process (24 h). Population of LAB from YP+EC treatment
also increased from 9.72 log cfu/ml at early fermentation (0 h) to 11.95 logcfu/ml at the end
of fermentation process (24 h). Whereas the population of LAB for Kf+EC also increased from 7.97 log cfu/ml at early fermentation to 9.10 log cfu/ml at the end of fermentation. In regard to LAB population, YP+EC had higher content of LAB compared to YT+EC treatment. This was due to the number of LAB cells itself, where YP + EC starter had more LAB strain compared to others.
Based on the number of LAB at the end of fermentation process, the yogurt group of treament (YT and YP) had shown best microbiological quality referring to the standard according to
Jay et al. (2005) which stated that new fresh yoghurt must contain LAB in about 109 cfu/g.
LAB population tended to decrease during cold storage, the decrease of LAB population in all treatments from day 0 to day 3 was likely to be associated with the growth phase of bacteria. Within that time period, the growth phase of bacteria has passed the stationary phase and start to enter declining phase. Another factor that affect on the decrease of LAB population was the acid accumulation as the result of fermentation process. The accumulated acid can inhibit the
growth of bacteria as the pH value become decreased (Figure 4). Population of LAB at the end of cold storage for all treatments and control still in accordance with standard of fermented milk. The number of LAB contained in the fermented milk should be at least
107colony/ml (Kurmann et al., 1992). The differences among treatments and control on the
population of LAB reflected the characteristics of each group of starter bacteria.
Figure 4 pH and Titratable Acidity (TAT) Value of Each Fermented Milk Product and Control with EC KT07 as The Testing Bacteria During Fermentation Process and Cold Storage
EC KT07 bacteria can survive in all treatments and grew in high number. The high increasing of EC KT07 population showed by Kf+EC, started from 6.95 log cfu/ml at early fermentation grew into 11.49 log cfu/ml at the end of fermentation process (24 h). This increasing of EC KT07 in Kf+EC was likely to be associated with pH and TAT value (Figure 4) which was also affected by LAB activity. The acid production of Kf+EC starter bacteria was very slow resulted in high pH value as compared to other treatments. This condition supported EC KT07 to grow in optimum condition, because the final pH value (5.4) of Kf+EC was above the minimum pH value requirement for EC bacteria to grow. The minimum pH value for EC bacteria to grow is around 4.4 (Blackburn et al., 2003).
5. CONCLUSIONS
1. Probiotic yoghurt had better bacteriostatic/antagonistic activity toward testing bacteria among treatments.
2. High level pre%fermentation contamination of the fermented milk products posses high risk to the consumer health status, either at the end of fermentation or after cold storage.
3. Fermented milk products which are widely recognized as safe product due to its low pH and LAB content will posses potential risk for the consumer’s health if the contamination occur during processing and storage.
"
#
ACKNOWLEDGEMENTS
We would like to express our gratitude to the management of PHK A2 Program of Department of Animal Production Science and Technology, Faculty of Animal Science, Bogor Agricultural University for granting us the financial support of this study. Sincere gratitude also goes to all technicians and supporting staffs who helped us throughout the study.
REFERENCES
Blackburn, CW, McClure PJ. (2003) Foodborne Pathogens (Hazards, Risk Analysis and Control). Woodhead Publishing Limited, Cambridge, England.
Chye FK, Abdullah A, Ayob MK. (2004) Bacteriological quality and safety of raw milk in Malaysia. Food Microbiol 21: 535%541
Djenane D, Martínez L, Blanco D, Yangüela J, Beltrán JA, Roncalés P. (2005) Effect of lactic
acid bacteria on extention of shelf life and growth of Listeria monocytogenes in beef
steaks stored in CO2%rich atmosphere. Brazilian J Microbiol 36: 405%412
Estrada AZ, de la Garza LM, Mendoza MS, Lopez EMS, Kerstupp SF, Merino AL. (2005)
Survival of Brucella abortus in milk fermented with a yoghurt starter culture. Rev Lat
Microbiol 47 (3%4): 88%91
Gulmez M, and Guven A. (2003) Survival of Escherichia coli 0157:H7, Listeria
monocytogenes 4b and Yersinia enterocolitica 03 in ayran and modified kefir as pre%
and postfermentation contaminant. Vet Med % Czech 48 (5): 126%132
[ISO] International Organization for Standardization 6888%1. (1999) International Standard: Microbiology of food and animal feeding stuffs % horizontal method for the enumeration of coagulase%positive staphylococci (Staphylococcus aureus and other species). Part 2: Technique using Baird Parker agar medium. International Organization for Standardization. Geneve.
Jay JM, Loessner MJ, Golden GA. (2005) Modern Food Microbiology. 7th ed. Springer. New
York.
Kurmann JA, Rasic JL, Kroger M. (1992) Encyclopedia of Fermented Fresh Milk Products: An International Inventory of Fermented Milk, Cream, Buttermilk, Whey and Related Products. Van Nostrand Reinhold. New York.
Nielsen S.S. (2003) Food Analysis. 3th Ed. Kluwer Academic/Plenum Publisher, New York.
PetrifimTM. (2005) E. coli and Coliform Count Plates Interpretation Guide. Microbiology
Products. 3M Health Care Limited. USA.
Tamime AY, Robinson RK. (1999) Yogurt Science and Technology. 2nd ed. Woodhead
Publishing Limited. England.
TEMPERATURE AND SALINITY CONTROL
ON ORE MINERAL DEPOSITION: FLUID INCLUSION STUDY
E. T. Yuningsih1 and H. Matsueda2
1Graduate School of Science, Resource Geology Group, Hokkaido University Japan
Hokkaido University Mueseum, Hokkaido University, Japan
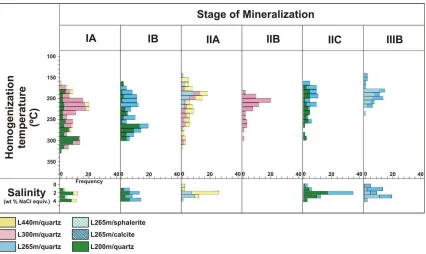
ABSTRACT : Microthermometric study of fluid inclusion was carried out on the samples
from the epithermal gold%silver%basemetal mineralization of Arinem vein system located at Western Java Indonesia from different levels, stages and minerals types such as quartz, sphalerite and calcite. The freezing and heating measurements were conducted on primary fluid inclusions trapped in those minerals. The inclusions especially primary ones were large enough to study, aqueous, consisting of two phases (liquid and vapor) at room temperature. Three type of fluid inclusion are recognized such as: two%phase primary – pseudosecondary liquid%rich fluid inclusion; two%phase primary – pseudosecondary vapor%rich fluid inclusion; two%phase secondary fluid inclusion.
The results of primary fluid inclusion measurement in quartz from different levels indicate that homogenization temperatures ranges are 156.9º%325.1°C, whereas the temperature of fluid inclusion from sphalerite and calcite are ranges 152.7º%218.0ºC and 140.4º%217.1ºC, respectively. The salinities of inclusion in quartz, sphalerite and calcite determined by final freezing point measurement are less than 4.34 wt % NaCl equiv.. So far, Raman spectroscopic
analyses of CO2, N2, H2S and CH4 performed on selected fluid inclusions detected no volatile
component other than H2O. Temperature versus depth profiles for fluid inclusions with
evidence of boiling indicate that the paleowater table was located about 235m above the present erosion level during deposition of the main%stage quartz.
: fluid inclusion, microthermometry, quartz, salinity, temperature
1. INTRODUCTION
Fluid inclusion is a tiny cavity in mineral, 1 to 100 of micrometers in diameter, containing liquid and/or gas, formed by the entrapment in crystal irregularities of fluid, commonly that from which the rock crystallized. Fluid inclusion has provided much information in the study of ore deposit including in the immediate problems of mineral exploration and also understanding the physical and chemical enviroment of ore deposition. Fluid inclusion is applicable for geothermometry as a result of differential shrinkage of the host mineral and the inclusion fluid on cooling from the temperature of trapping to that of observation (Roedder, 1984).
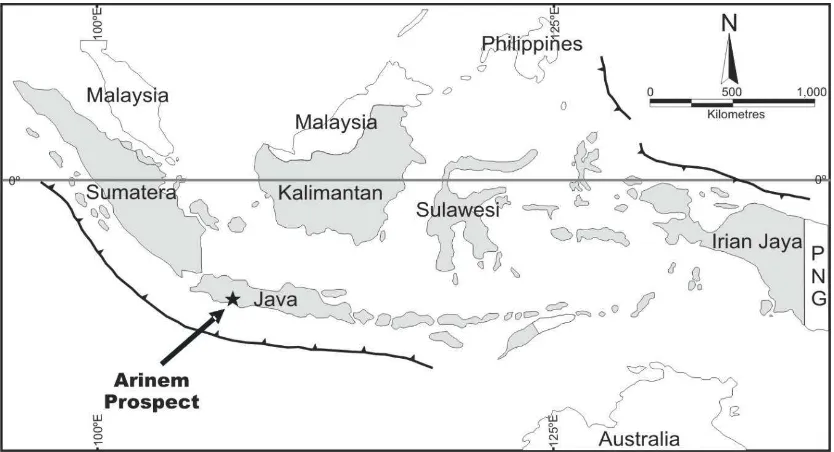
Microthermometric study was carried out on the samples from the epithermal gold%silver% basemetal mineralization of Arinem vein system located at Western Java Indonesia (Fig. 1). The proposed of this study are to understand the characteristic of the fluid inclusion trapped, and to determine the physical and chemical environments of ore mineral deposition.
Fig. 1 Map of the Indonesia region indicates the location of the Arinem prospect shows by black arrow.
2. REGIONAL GEOLOGY
The Indonesia archipelago has been formed by three major crustal elements: the Asian Plate, the Indian%Australia Plate and the Pacific Plate. In the tectonic framework distinction is made between West Indonesia and East Indonesia. West Indonesia is situated in the zone of subduction of the Indian%Australian Plate under the Asian Plate. At the surface this junction is expressed by the forming of an island arc, namely the Sunda%Banda arc extending from North Sumatra to the Banda Island (Carlile et al, 1994; Bemmelen, 1949). The plate movement probably started in the Early Creataceous and subduction occurred at least since the Late Cretaceous and at present active subduction is taking place in the south of Java (Clements et al, 2007; Martodjojo, 1982).
The subduction occurred at Late Oligocene to Early%Middle Miocene resulted volcanic and magmatism activities was ended by quartz diorite intrusion at late of Middle Miocene caused of propilitization alteration of Jampang Formation at some places and resulted the important mineralization process (Corbett et al, 1998; Marcoux & Milesi, 1994). Volcanic rock consists of andesitic tuff, tuffaceous breccia and lava with Late Oligocene – Middle Miocene age of
young volcanic groups (Alzwar et. al, 1992) of Tertiary and Quaternary age are widely distributed and cover most of the area.
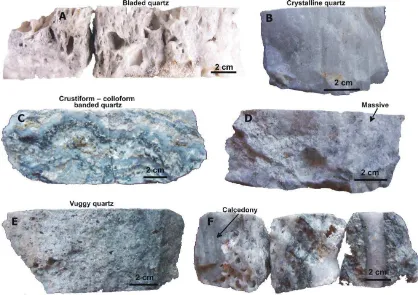
The Arinem vein system comprises three groups of mineralized quartz veins, named as the Arinem, Bantarhuni and Halimun veins (Antam, 1993). The main vein Arinem is composed mainly of quartz, calcite, sericite and other clay minerals, with variable amount of manganese oxide and limonite and with very rich amount of sulfides. The colorless, white, pale grey, brownish%reddish white, and brownish black fine%coarse grained quartz is observed, due to the content of dominant minerals. Quartz textures of colloform, crustiform, comb, vuggy, massive, brecciated, bladed quartz, and calcedonic are clearly observed and some are presented in Fig. 2.
Fig. 2. Hand specimens of Arinem quartz vein from core samples. (A) vuggy and bladed quartz textures of substage IA/L%60m, (B) barren coarse%grained crystalline quartz of substage IIIB/L275m, (C) banding quartz% sulfide of substage IC/L440m, (D) barren massive quartz texture of substage IIIA/L265m, (E) vuggy crystalline quartz of substage IA/L440m, (F) chalcedonic and crystalline barren quartz/substage IIIB cut vuggy crystalline quartz vein of substage IA/L425m.
3. MATERIALS AND METHODS
This study is based mainly on samples collected from exploration drill holes (drilled by PT. Antam Tbk.). These drill holes provide samples at intervals over a strike length of up to 2000m and depth extend of 575m and thus present an opportunity to investigate. Fluid inclusions examined came from four different levels (L440m, L300m, L265m and L200m) in order to document the ranges of fluid compositions and temperatures during the three stages of mineralization and to investigate their variations in time and space. The horizontal extent of sample localities is more than 1km and the vertical interval is approximately 240m.
Double polished plates were prepared on 200]m thickness, apart of quartz at stage III most of the quartz samples were selected for their basemetal sulfide content with the aim of studying fluid inclusions that were associated with deposition of sulfides ± gold and silver. Microthermometric analysis was performed on a Linkam THMSG 600 system attached to a Nikon transmitted%light microscope.
Heating rates was maintained near 2°C/min for measurement of homogenization temperature
(Th) and 0.5°C/min for measurement of ice melting temperature (Tm). Precision is calculate as
±0.1°C in the temperature range of the observed phase changes. Accuracy between −60 and −10°C is estimated in the order of ±0.2°C, whereas between −10 and +30°C and above +200°C is placed at ±0.5 and ±2°C, respectively. Instrumental calibration was done using
synthetic pure H2O (0°C), Dodecamethylene glycol (82.0°C), Benzanilide (163.0°C), Sodium
nitrate (306.8°C), n%tridecane (%5.5°C), n%dodecane (%9.6°C), chlorobezene (%45.6°C), and chloroform (%63.4°C) inclusion standards. Salinity estimates were determined from the final melting temperatures of ice, utilizing the equation proposed by Bodnar (1993).
4. RESULTS
Fluid inclusions (595 primary inclusions) were examined in 13 samples (11 quartz, 1 sphalerite, and 1 calcite). The fluid inclusion data came from medium%coarse grained quartz associated with sulphide and this quartz is referred to as main%stage quartz. Sphalerite is mainly dark – pale colour and crowded with chalcopyrite inclusion and primary fluid inclusions were analyzed in only one sample (BCAN 2A%15/L265m) of stage II mineralization. Fluid inclusion obtained from calcite came from stage III, respectively.
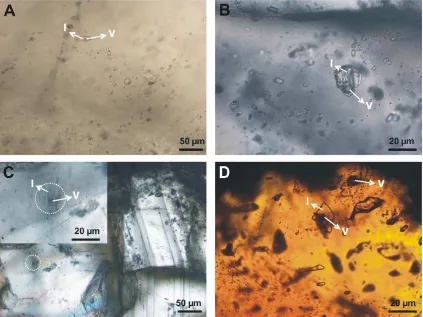
Three types of fluid inclusion are recognized: two%phase primary – pseudo%secondary liquid% rich fluid inclusion; two%phase primary – pseudo%secondary vapor%rich fluid inclusion and two%phase secondary fluid inclusion. The inclusions were considered primary or pseudo% secondary, as they were formed isolated within the crystals, in planar arrays outlining growth
Fig. 3. Photomicrograph of fluid inclusions trapped in quartz, calcite and sphalerite, samples from L265m and L440m of the Arinem quartz vein. (A) group of two phase liquid%rich fluid inclusion as cluster and distributed along the trail in coarse%grain quartz with variable vapor%liquid ratios/substage IIA/L440m, (B) isolated liquid%rich primary fluid inclusion in quartz/substage IB//L265m, (C) isolated two phase liquid%rich primary fluid inclusion trapped in calcite/substage IIIB/L265m, (D) two phase liquid%rich primary fluid inclusion coexists with vapor%rich fluid inclusion trapped in sphalerite /substage IIA/L265m.
According to the criteria of Roedder (1984), the heating and freezing measurements were conducted on primary fluid inclusions trapped in quartz, sphalerite and calcite. The primary inclusion was large enough to study, aqueous, mostly consisting of two phases (liquid and vapor) at room temperature. Type L%V inclusions being dominant in most inclusions (avg >70 vol. %). However, the vapor bubble occupies up to ~90 vol. % of some inclusions. L%V inclusions occur in clear, smoky, and milky quartz, in medium% and coarse%grained calcite, and in substage IIA of sphalerite. Although some of the fluid inclusions were necked down, the ones used in the microthermometric study ranged from 5 to 40]m in length and were classified according to the nomenclature of Roedder (1984).
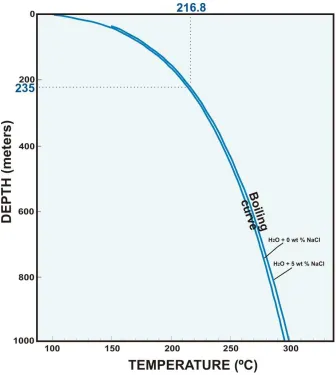
from substage IIA and IIIB give a result of 152.7%218.0ºC and 140.4%217.1ºC, respectively (Table 1). However, quartz sample from L200m of stage I mineralization shows evidence of boiling since this sample contains both gas%rich and liquid%rich inclusions along the same growth band. The filling temperatures of these two types of inclusions range from 216.8% 247.3ºC. These data were interpreted to indicate that actual boiling took place at 216.8ºC whereas higher filling temperatures resulting from the trapping of various liquid : vapor proportions.
Ice melting temperatures range from %2.6 to (%0.1)ºC, with distribution of apparent salinity in all stages and level of mineralization vein body. During freezing of inclusion measurement,
no unusual solid phase such as CO2 hydrate was observed in all samples. Fluid inclusion
assemblages from main stages I and II from all level, commonly show a narrow range in Tm values (0.18 to 4.34 wt % NaCl equiv.). This is also marked in fluid inclusion assemblages from late stage (stage III) of barren quartz. The salinity determined from quartz is in average 1.95 wt% NaCl equiv., 2.64 wt% NaCl equiv from sphalerite and 2.1 wt% NaCl from calcite, respectively (Table 1).
Table 1 Range of fluid inclusion homogenization temperatures and salinity every stage of Arinem vein mineralization
Raman spectroscopic analyses of CO2, N2, H2S and CH4, performed on selected fluid
inclusions detected no volatile component other than H2O. Temperature versus depth profiles
summarized by Hass (1971) it was obtained a fluid pressure of 21.7 bars with an average fluid
density of 0.861 g/cm3 of 2 wt % NaCl equiv. fluid at 216.8ºC.
Fig. 4 Possible boiling point with depth curves for water with 0 and 5 wt % NaCl equiv. (Hass, 1971). dashed line showing evidence for trapping of a boiling fluid occurred in substage IA of Arinem vein.
5. CONCLUSIONS
ACKNOWLEDGEMENTS
The first author wish to thank Antam Tbk for support to access to data and samples during the field investigation and to acknowledge the contribution of the large member of geologic staff who have worked on the Papandayan exploration program.
REFERENCES
Alzwar, M., Akbar, N., Bachri, S. (1992) Systematic geological map, Indonesia, quadrangle Garut 1208%6 & Pameungpeuk 1208%3, scale 1 : 100.000. Geological research and development centre., 1 sheet.
Bodnar, R. J. (1993) Revised equation and table for determining the freezing%point depression
of H2O%NaCl solution. Geochimica et Cosmochimica Acta., vol.57, p683%684.
Carlile, J. C. and Mitchell, A. H. G. (1994) Magmatic arcs and associated gold and copper mineralization in Indonesia. Geochemical Exploration., vol.50, p91%142.
Clement, B and Hall R. (2007) Creataceous to Late Miocene Stratigraphic and Tectonic
Evolution of West Java. Indonesia Petroleum Association., 31st Annual Convention and
Exhibition, IPA07%G%037.
Corbett, G J. and Leach, T M. (1998) Southwest Pacific Rim gold%copper systems: structure, alteration, and mineralization. Society of Economic Geologists., Special Publication, vol.6, p69%82.
Antam (1993) Gold%silver deposit exploration report DMP, Mt. Papandayan area, Garut regency, West Java province (KP.DDU. 866/Jabar). Unpubl. report (in Indonesian)., 68p.
Haas, J. L. (1971) The effect of salinity on the maximum thermal gradient of a hydrothermal system at hydrostatic pressure. Economic Geology., vol.66, p940%946.
Marcoux, E. and Milesi, J. P. (1994) Epithermal gold deposit in West Java, Indonesia: Geology, age and crustal source. Geochemical Exploration., vol.50, p393%408.
Martodjojo, S. (1982) Evolution of Bogor Basin, West Java. Unpubl. PhD thesis ITB., 412p. Roedder, E. (1984) Fluid Inclusions: Reviews in Mineralogy. Mineralogical Society of
America., vol.12, 644p.
NUMERICAL SIMULATION OF THE 1883 KRAKATAU TSUNAMI
PROPAGATION
Aditya Riadi Gusman1,2, Hamzah Latief2, and Haris Sunendar2
1Institute of Seismology and Volcanology, Hokkaido University, Kita 10 Nishi 8 Kita%ku, Sapporo, Japan
E%mail: [email protected]
2Department of Oceanography, Bandung Institute of Technology, Ganesha 10 Bandung, Indonesia
ABSTRACT: Tsunamis that were generated by the eruption of Krakatau volcano August 27,
1883 devastated the coastal area around Sunda Strait. This study assumed the collapsing Krakatau caldera as the generating force for tsunami numerical simulation.We simulated source models of the tsunami based on the estimated dimension of the collapsed caldera. The source model that used bathymetry data to estimate the collapsed caldera can explain well the observed tsunami run%up. Whereas the source model of a cylinder shaped caldera can explain well the observed tsunami arrival time. The caldera models are able to give good explanations of the tsunami arrival time and tsunami run%up.
1. INTRODUCTION
Indonesia is among countries that located near the subduction zones. The Indo%Australia plate is subducting beneath the Sunda plate, the boundary between these plates called the Sunda trench stretches from the Andaman Islands to the north%west until Sumba Island to the east. Great earthquakes in Indonesia are ruptured on the Sunda subduction zone and most of these earthquakes generated large tsunamis. From 106 tsunami events, 90% were generated by earthquakes, 9% were generated by volcanic eruptions, and 1% was generated by landslides (Latief et al., 2000). Tsunami that flooded a coastal area can reach a location from few hundreds of meters to kilometers from shoreline. The ground level at the inundation boundary of a tsunami called the run%up can reach up to tens of meters from sea level.
Among the tsunamis that were generated by volcanic eruptions in Indonesia, the tsunami generated by the 1883 Krakatau eruption has beenwell recordedbyhistory. The Krakatau volcano has a long record of volcanic activities. The first recorded Krakatau eruption in history was in 416 AD that destroyed the Krakatau and forming a 7 km wide caldera, the eruption also left volcano remnants of Panjang Island and Sertung Island. Before the 1883 eruption, the Krakatau Island was formed by three volcanoes which are Rakata, Danan and Perbuatan, in this article we will call these volcanoes or the island as Krakatau volcano. The boundaries of the calderas formed by the 1883 and pre%1883 eruptions are shown in Figure 1.
Geographically, the position of the Krakatau volcano is at 6°06’5.8” S and 105°25’22.3” E.
Series of eruptions on 26%27 December 1883 destroyed the Danan and Perbuatan volcanoes, and left only half of the Rakata volcano. The catastrophic 1883 eruption was among the largest eruptions in recorded history. The eruption of Krakatau in 1883 was not only felt by the population residing in the vicinity of the Sunda Strait. The amount of energy released and the material thrown affected the earth's atmosphere globally. Decker and Hadikusumo (1961)
estimated that the material ejected by the eruption was about 18 km3. Hendervari (1979)
estimated that the energy required to eject the material is equivalent to 1,810 x 1026 J. On 29
Fig. 1 Boundary of the collapsed caldera (Simkinand Fiske, 1983)
The tsunami generated due to the Krakatau eruption destroyed around 167 villages along the coast of Southern Sumatra and Western Java and killed over 36.000 people. The highest run% up of 41 m was measured in Merak on Java Island. In Betung Bay, Sumatra Island the tsunami dragged a steam ship up to 2.5 km inland along Kuripan River (Simkin and Fiske,
1983). At Anyer 4th Point, a lighthouse destroyed during tsunami inundation,a distribution of
coral boulders near the lighthouse suggest that it was destroyed by one of the coral boulders that were transported by the tsunami.
Previous numerical simulation studies of the Krakatau tsunami has been performed by Nakamura (1984), Kawamanta et al., (1992), and Nomanbhoy and Satake (1995). Nakamura (1984) simulated the tsunami using caldera formed by the eruption as the tsunami source. Nomanbhoy and Satake (1995) concluded that the submarine explosion model as the source of the largest tsunami.
2. MODELING DOMAIN AND MODELING SETUP
2.1. Modeling Domain
The modelling domainof the tsunami simulation has boundaries of 5°4’ % 6°54’ S and 104°20’%107° E (Figure 2). The bathymetry data is obtainedby digitizing a Bathymetry Map of Dinas Hidro Oseanografi TNI AL, which was printed in 1987.The modeling domain of the propagation model has a size 500 grids × 343 grids in –x and –y directions, respectively, with
grid size of 594 m (dx = dy).
Fig. 2 Map of Sunda Strait
Krakatau volcano is located in the middle of the Sunda Strait between Java Island to the east side and Sumatera Island to the northwest side. The northeast part of the strait is narrowing before enters the Java Sea. In the southwest side, the strait gets wider and deeper before crossing with continental shelf of Indian Ocean where the depths are change dramatically from 50 m to about 1000 m (Figure 3).
2.2. Krakatau Caldera
For the tsunami source models, we assumed the Krakatau caldera was the main source that generates tsunami along west coast of Java and south coast of Sumatra. In this study we have threescenarios oftsunami simulation with different shapes of caldera models. The caldera models are based on the volume of the Krakatau caldera which was collapsed to the bottom of the sea during the primary eruption. The volume of the Krakatau caldera was obtained by comparing the bathymetry around Krakatau before and after the eruption. The bathymetry data around Krakatau volcanobefore the eruption was produced by the British Admiralty
Charts, 4th edition of the year 1868 (Figure 4). The bathymetry data around the Krakatau
caldera after the eruption (Figure 5) was produced from a survey in 1885 by Verbeek.
Fromthose bathymetry data the volume of collapsed caldera is calculated to be about 8.6 km3.
Fig. 4 Bathymetry data before the 1883 eruption (British Admiralty Charts, 1868).
2.2.1. Scenario I
In this scenario, we approximate the collapsed caldera with a square surface and an average depth of the Krakatau calderawhich was formed after the primary eruption. We approximate that the square sizes 10 × 10 grids with grid size of 594 m. We assumed the sea surface drops instantly to the depth of 200 m ( t =0). This dimension calculates the volume of caldera
model in scenario I as about 7.6 km3. The modeling area for the source generation has a size
of 30 grids in –x direction and 30 grids in –y direction. The tsunami source is simulatedusinga time interval of 0.5 sec (∆t = 0.5 sec).
Fig. 6 Model of Krakatau caldera in Scenario I, x and y axes are in grid unit, z axis and color
bar are in meter
2.2.2. Scenario II
In this scenario, we approximate the collapsed caldera with a cylinder shaped caldera. We assumed the sea surface drops instantly to the depth of 200 m ( t =0). The volume of caldera
model in scenario II is about 8.6 km3. The modeling area for the tsunami source generation
has a size of 40 grids in –x direction and 40 grids in –y direction. The tsunami source is simulatedusinga time interval of 0.5 sec (∆t = 0.5 sec).
Fig. 8 Model of Krakatau caldera in Scenario II, x and y axes are in grid unit, z axis and color
bar are in meter
Fig. 9 Initial elevation of the tsunami source in scenario II, x and y axes are in grid unit, z axis
2.2.3. Scenario III
In this scenario, we approximate the size of the Krakatau caldera with a more realistic shape obtained using the bathymetry data around Krakatau. The Krakatau caldera model has a
volume of 8.6 km3. The modeling domain of the tsunami source generation has a dimension
of 400 × 400 grids in –x and –y directions, where each grid has a size of 54.9 m (dx = dy).
The tsunami source is simulatedusing a time interval of 0.5 sec (∆t = 0.5 sec).
Fig. 10 Model of Krakatau caldera in Scenario III, x and y axes are in grid unit, z axis and
color bar are in meter
Fig. 11 Initial elevation of the tsunami source in scenario III, x and y axes are in grid unit, z
2.3. Tsunami Simulation
To simulate the tsunami propagation we solve the linear shallow water equation numerically using the finite different scheme. The governing equations for the tsunami computation explained by Johnson (1999) are the following
equations are the expression of the linear shallow water theory in Cartesian coordinate system for near field tsunami.
A time interval of 0.5 sec ( t = 0.5 sec) is used for tsunami simulation to satisfy the stability condition. The total simulation time is 21600 iterations or 3 hours. The three source models are used for the simulation of tsunami run%up and arrival time at locations indicated by Figure 2.Then we compare the observed tsunami with the simulated ones at these locations to evaluate which scenario can best explain the observations.
3. RESULTS AND ANALYSIS
3.1. Tsunami RunFup
We used observed tsunami run%up in Betung Bay, Kalianda, VlakkeHoek lighthouse, Merak,
Panaitan Island, and Anyer 4thPoint. We also used the observed tsunami waveform at Batavia.
Fig. 12 Snapshot of the simulated tsunami propagation at t = 20 minutes Red indicate negative elevation and blue indicate positive elevation
Tabel 1. Maximum tsunami run%up
Simulated tsunami runFup Locations
Scenario I Scenario II Scenario III
Observed Tsunami
RunFup
Betung Bay 29 m 16.5 m 24.3 m 21.9 m
Kalianda 33 m 36.5 m 36 m 24.4 m
VlakkeHoek lighthouse 15.6 m 17.5 m 12.2 m 15.2 m
Merak 15.6 m 27 m 21.8 m 15 % 41 m
Panaitan Island 21.2 m 40 m 16.6 m 15.2 m
Caringin 23.8 % 30 m 41 m 19.3%21.6 m 15.2 % 21.3 m
Batavia 1.25 m 1.5 m 1.5 m 2.35 m
Anyer 4th Point 20%28 m 26%44m 13.3%18 m 10 m
3.2. Tsunami Arrival Time
From eye witness accounts we obtain the arrival time of tsunami generated by the Krakatau eruption. The simulated tsunami arrival time and the reported arrival time at eight locations are shown in Table 2. Comparison of the simulated arrival time and the observed arrival time of tsunami at Betung Bay show that the models are about 60 minutes late. A report from the Besse ship that sailed toward Sunda strait says that they felt an unusual current with a speed of 12 knot at 10.02 AM. This report suggests that the primary eruption at 10.00 AM may not be the only eruption that generated a tsunami around Sunda Strait. From these facts, we speculate that the tsunami that was observed at 10.18 AM in Betung Bay was not generated by the Krakatau primary eruption.
arrival times from scenario II are between %2 and +15 min (Table 3). The result shows that the simulated arrival time from scenario II are closer to the observation compare to the other scenarios.
Table 2.Tsunami arrival time (local time)
Locations Observed Scenario I Scenario II Scenario III
Betung Bay 10.18 11.16 11.22 11.19
Kalianda % 10.48 10.48 10.35
Vlakke Hoek lighthouse 10.30 10.27 10.28 10.25
Merak 10.32 10.51 10.47 10.58
Panaitan Island % 10.23 10.26 10.28
Caringin 10.30 10.43 10.40 10.47
Batavia 12.30 12.50 12.44 12.52
Anyer 4th Point % 10.36 10.33 10.38
Table 3.Delay of the simulated arrival timewith respect to observation
Locations Scenario I (min) Scenario II (min) Scenario III (min)
Betung Bay +58 +64 +61
The realistic caldera model of scenario III gives good result on the simulation of tsunami run% up. The cylinder shaped caldera model of scenario II gives good result on the calculation of tsunami arrival time.Tsunami simulation using the collapse of caldera as the generating force is able to explain the arrival time and run%up of the tsunami caused by the 1883 Krakatau eruption. The early tsunami recorded in Betung Bay suggests that tsunami was also generated by smaller eruption on August 27, 1883 before the primary eruption at 10.00 AM.
REFERENCES
Decker,R.W., and Hadikusumo D., (1961), Result of the 1960 Expedition to Krakatoa. Journal of Geophysics, 16, 267%297.
Heliker, (1990), Volcanic and Seismic Hazards on the Island of Hawaii, USGS General Interest Publication.
Hendervari, (1979), The relationship Between Tectonic Earthquakes and Volcanic Eruptions with Particular Reference to Santorini (Aegean Sea) and Indonesia. Geologie en Mijnbouw, 58(2), 213%224.
Kawamata, S., F.Imamura and N.Shuto, (1993), Numerical Simulation of The 1883 Krakatau Tsunami, Proceeding of XXV Congress of International Association for Hydraulic Research, Vol.IV, 24%31.
Latief, H., Nanang T. Puspito., Imamura, (2000), Tsunami Catalog and Zoning in Indonesia, Journal of Natural Disaster, 22, 25%43.
Nakamura, S, (1984), A numerical tracking of the 1883 Krakatau tsunami, Science of Tsunami Hazards, 2, 41%54.
Nomanbhoy, N and Satake K., (1995), Generation mechanism of tsunamis from the 1883 Krakatau eruption, Geophys. Res. Letters, 22, 509%512.
Simkin, T and Fiske, R. S. (1983), Krakatau 1883 Eruption and its effects, Smithsonian Institution Press, Washington, D.C.
Verbeek, R.D.M. (1885), Krakatau. Uitgegeven Op Last Van Zune Excellentie Den