Soil Liquefaction in Padang due to Padang Earthquake
30 September 2009
Hakam, A.1
Abstract: The Padang earthquake of M7.6 on 30 September 2009 (30S’09) caused damage to buildings, houses, public water facilities, and road ways. Several buildings were damaged due to liquefaction. This paper describes the liquefaction potential in Padang based on the site observation and analytical examination. The liquefaction was observed at a number of sites including roadway, river bank and play ground. The samples of sand boils were sent to the laboratory to determine the soil grain size distributions. It is found that the fine-sand (diameter less than 0.4 mm) content of the liquefied soil samples is more than 65%. This type of soils satisfies the criteria of liquefaction susceptibility. Based on the field soil test data, the liquefaction potential of sites is also examined. The results show that the observed locations have liquefaction potential.
Keywords: Liquefaction, grain size, CPT.
Introduction
It has been reported [1] that the 1964 Niigata as well as Alaska earthquakes had caused overturned buildings due to liquefaction. The Niigata liquefaction phenomena and its devastating effects attracted the attention of engineers and seismologists. An extraordinary ground failure caused by bearing capacity failure due to liquefaction occurred near the river bank causing the apartment buildings to tilt severely as shown in Figure 1 [2].
Numerous studies to evaluate the liquefaction potential in a soil deposit have been done. Seed and Idriss [1] have done comprehensive study on soil liquefaction and proposed a soil liquefaction assess-ment based on the soil parameters from laboratory as well as field tests. The assessment method has been used to investigate the liquefaction potential of a soil deposit due to Sumatra Earthquake on 6th March 2007 [3]. Shibata and Teparaksa [4] also proposed a liquefaction potential evaluation based on cone penetration test data. More recent, the liquefaction risk assessment of earth embankments using a probabilistic seismic hazard has been studied by Rosidi [5].
Liquefaction of soil is the behaviour of soils under cyclic load that transform from a solid state to a liquid state.
1 Civil Engineering Department, Andalas University, Padang, INDONESIA.
Email: [email protected]; [email protected]
Note: Discussion is expected before November, 1st 2012, and will be published in the “Civil Engineering Dimension” volume 15, number 1, March 2013.
Received 12 December 2010; revised 08 December 2011; accepted 10 May 2012
It is well known that liquefaction is more likely to occur in loose saturated granular soils. The types of soil deposit that potentially liquefy during the earthquake are fine sand, silty sand, sand, and gravely sand. Since the rate of earthquake loading is faster than the flow of water in the soil, the cyclic loading can increase the pore water pressure and consequently decrease the soil shear strength. This type of cyclic load is called undrained loading.
When a cyclic loading is applied to a sandy deposit, the total stress, , in the soil element is increased. This increase of stress in the soil element occur in terms of pore pressure, u, meanwhile the effective stress between soil particles remain constant. For a very permeable sandy deposit, the pore pressure will be transferred directly to the stress between soil particles in terms of effective stress, '. However for semi-impermeable sandy soil, such as silty sand, clayey sand and fine sand, the time of increasing pore pressure is very short compared to the time required to transfer the stress between soil particles. If the pore pressure is higher than its effective stress, then the stress in the soil is dominated by the pore pressure.
In this condition, sandy deposit behaves as liquid and it is refered to as liquefaction condition. In mathe-matical term, the liquefaction on the soil deposit is written as:
' = - u < 0.0 (1) where and ' are total and effective stresses in the soil respectively and u is the pore pressure in the liquefied soil element.
Das [6] concluded that there is no unique criterion for quantitative evaluation of the liquefaction potential. However, the liquefaction potential of the soil depends on several factors:
- Relative density, Dr - Initial stress of the soil, i - Mean grain size of the soil, D50 - Applied peak stress, d or max - Duration of the motion, t
- Over consolidation ratio, OCR
- Initial pore pressure, ui
Even though the criteria for each of these factors are not clearly specified, relationships of the factors can be described. For higher soil relative density (Dr),
more dynamic peak stress (max) is needed to liquefy
the soil. The higher the level of over consolidation ratio (OCR), the longer motion is needed to liquefy the soil. The effects of initial stress (i) and pore
pressure (ui) are in term of soil resistance against
liquefaction which will be described later. Based on site experience summarized by Cetin et al [7], liquefaction phenomena occur in sands with mean grain size (D50) of 0.05 – 0.50 mm.
Liquefaction in Padang
The liquefaction phenomena have occurred in some area of Padang during Padang earthquake of 30 September 2009. Soil liquefaction induced by the M7.6 of Padang earthquake has contributed to damage of houses, water facilities and road ways. The liquefactions on sites of Padang were indicated by sand boils right after the earthquake. The soil liquefactions were observed on a number of sites including roadway, river bank, sport court and play ground (Figure 2).
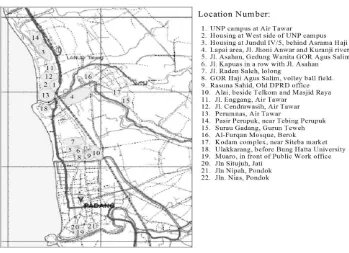
The identified soil liquefaction on sites in Padang then is plotted in the map of Padang City (Figure 3).
Figure 2. Sand Boils on the Ground Surface
It can be seen that the liquefaction mostly found along riverbanks and beaches that generally consist of sands and/or silts deposits.
Grain Size Distribution
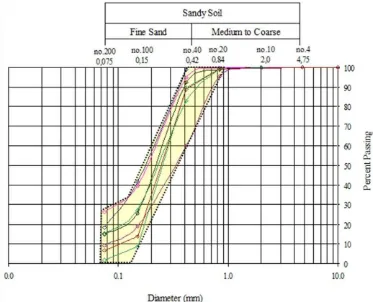
In order to have the distribution of the grain size of the liquefied soil, samples of sand boils are sieved to determine its grain size distributions (Figure 4). It is found the soil samples have more than 65% fine-sand grains with D50 of 0.15 – 0.35 which agree with the liquefaction criteria.
Figure 4 shows that the liquefied soils have a similar pattern of grain distribution which can be placed in a plotted boundary. This picture can be used in evaluation of liquefaction potential based on the grain distribution. However, the potential for liquefaction should also be determined by other methods.
Site Analyses
Four points of Cone Penetration Test (CPT) have been carried out, two points each are carried out in Lapai and Agus Salim Sport Centre (GOR AS) sites. Results of the CPT are shown in Figure 5. The cone resistance (qc) of every soil layers were recorded.
In the end of each test the ground water table was investigated. The analyses of liquefaction suscep-tibility based on the CPT [8] are then conducted. In this analysis, the value of qc1, the ratio of cone
resistance to the effective overburden of soil, is calculated. Then, the Cyclic Stress Ratio (CSR), the ratio of the soil resistance compared to the potential cyclic stress, is also calculated. CSR is calculated
stresses in the soil respectively, amax is the maximum
horizontal acceleration, g is the acceleration of gravity, and rd is shear stress reduction factor which depends
on the depth [1]. The values of stress reduction factor (rd) vary from 1.0 at ground surface to 0.9 at a depth
of about 10 m. The soil parameters for calculating CSR are estimated from CPT results [9].
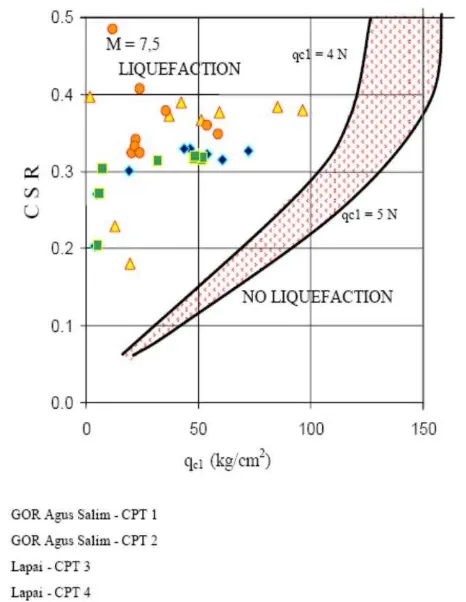
The potential of liquefaction can be found by plotting of value of qc1 to Cyclic Stress Ratio as shown in
Figure 6. The plots show that these sites can be classi-fied as highly potential liquefaction area. This result agrees with the liquefaction potential of the soil that is examined based on the soil grain size distribution.
Figure 5. CPT Test Point on the Lapai and GOR Agus Salim Sites
Conclusions
The liquefaction phenomena due to the Padang Earthquake on 30 September 2009 were observed at a number of sites in Padang. The soil grain size distributions show that the fine-sand grains of the soil sites are more than 65%. The results of analysis based on CPT on particular sites show potential liquefaction of deposit during the earthquake. The results show that liquefaction potential can be determined by CPT and grain size distribution.
References
1. Seed, H B and Idriss, I M, Ground Motions and Soil Liquefaction During Earthquake, Earthquake Engg. Research Institute, California, 1982. 2. Wikipedia:http://upload.wikimedia.org/wikipedia/
en/4/42/Liquefaction at Niigata.JPG, 12 March 2012.
3. Hakam A and Oscar F Nur, Liquefaction Ana-lysis of Silty Sand Deposit due to West Sumatra Earthquake on 6th March 2007, Proceeding of
International Symposium on Disaster in Indo-nesia, Padang, 2007.
4. Shibata, T. and Teparaksa, W., Evaluation of Liquefaction Potential of Soils using Sone Pene-
tration Tests, Soils and Foundations, 28(2), 1988, pp. 49-60.
5. Rosidi, D., Seismic Risk Assessment of Levees,
Civil Engineering Dimension, 9(2), September 2007, pp. 57–63.
6. Das, BM., Fundamental of Soil Dynamics, Elsevier, New York, 1983.
7. Cetin, K.O., Seed R.B., Moss, R.E.S., Der Kiureghian, A., Tokimatsu, K., Harder L.F., Jr., and Kayen R.E., Field Case Histories for SPT-Based In Situ Liquefaction Potential Evaluation,
Geotechnical Engineering Research Report No. UCB/GT-2000/09, Geotechnical Engineering- Department of Civil and Environmental Engi-neering, University of California, Berkeley, August 2009.
8. Robertson, P.K., Campanella, R.G., Gillespie, D. and Greig, J., Use of Piezometer Cone Data,
Proceeding of the ASCE Specialty Conference In
Situ ’86: Use of In Situ Tests in Geotechnical
Engineering, Blacksburg, 1263-80, American Society of Civil Engineers (ASCE), 1986.
![Figure 1. Liquefaction due to Niigata Earthquake [2]](https://thumb-ap.123doks.com/thumbv2/123dok/3672988.1469828/1.595.300.524.626.761/figure-liquefaction-due-to-niigata-earthquake.webp)
![DAFTAR iSI - Research on Earthquake Induced Liquefaction in.pdf [980.6 KB]](data:image/gif;base64,R0lGODlhAQABAIAAAP///wAAACH5BAEAAAAALAAAAAABAAEAAAICRAEAOw==)